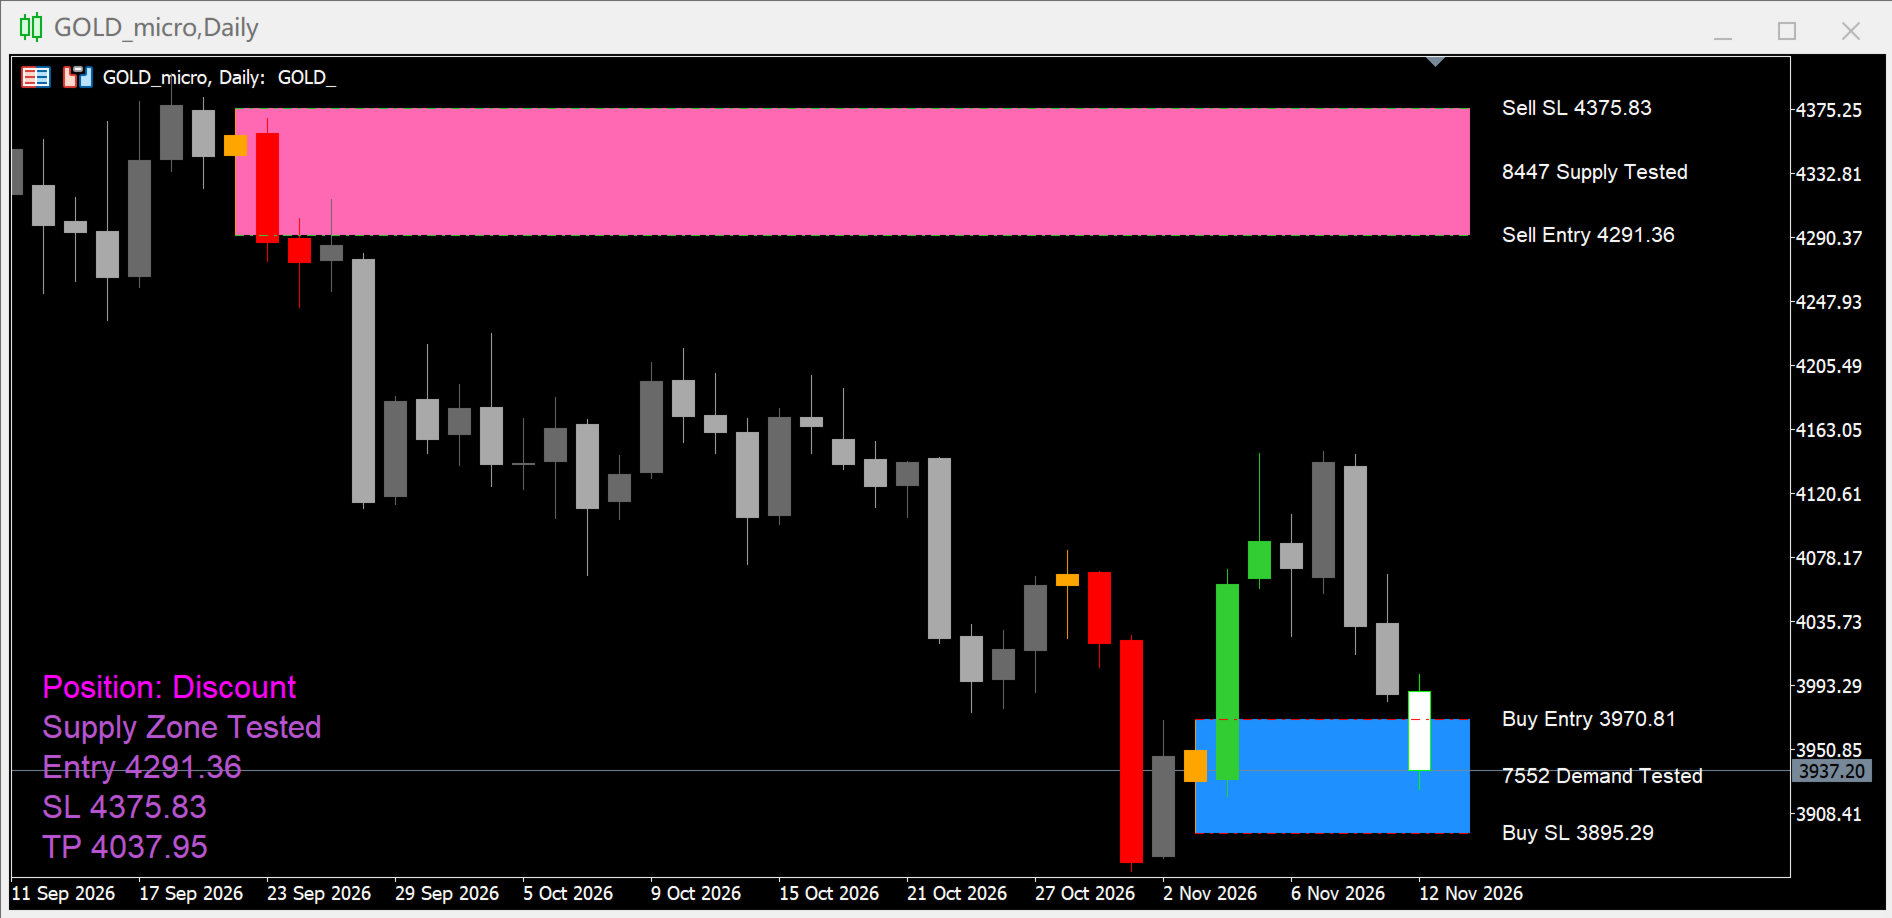
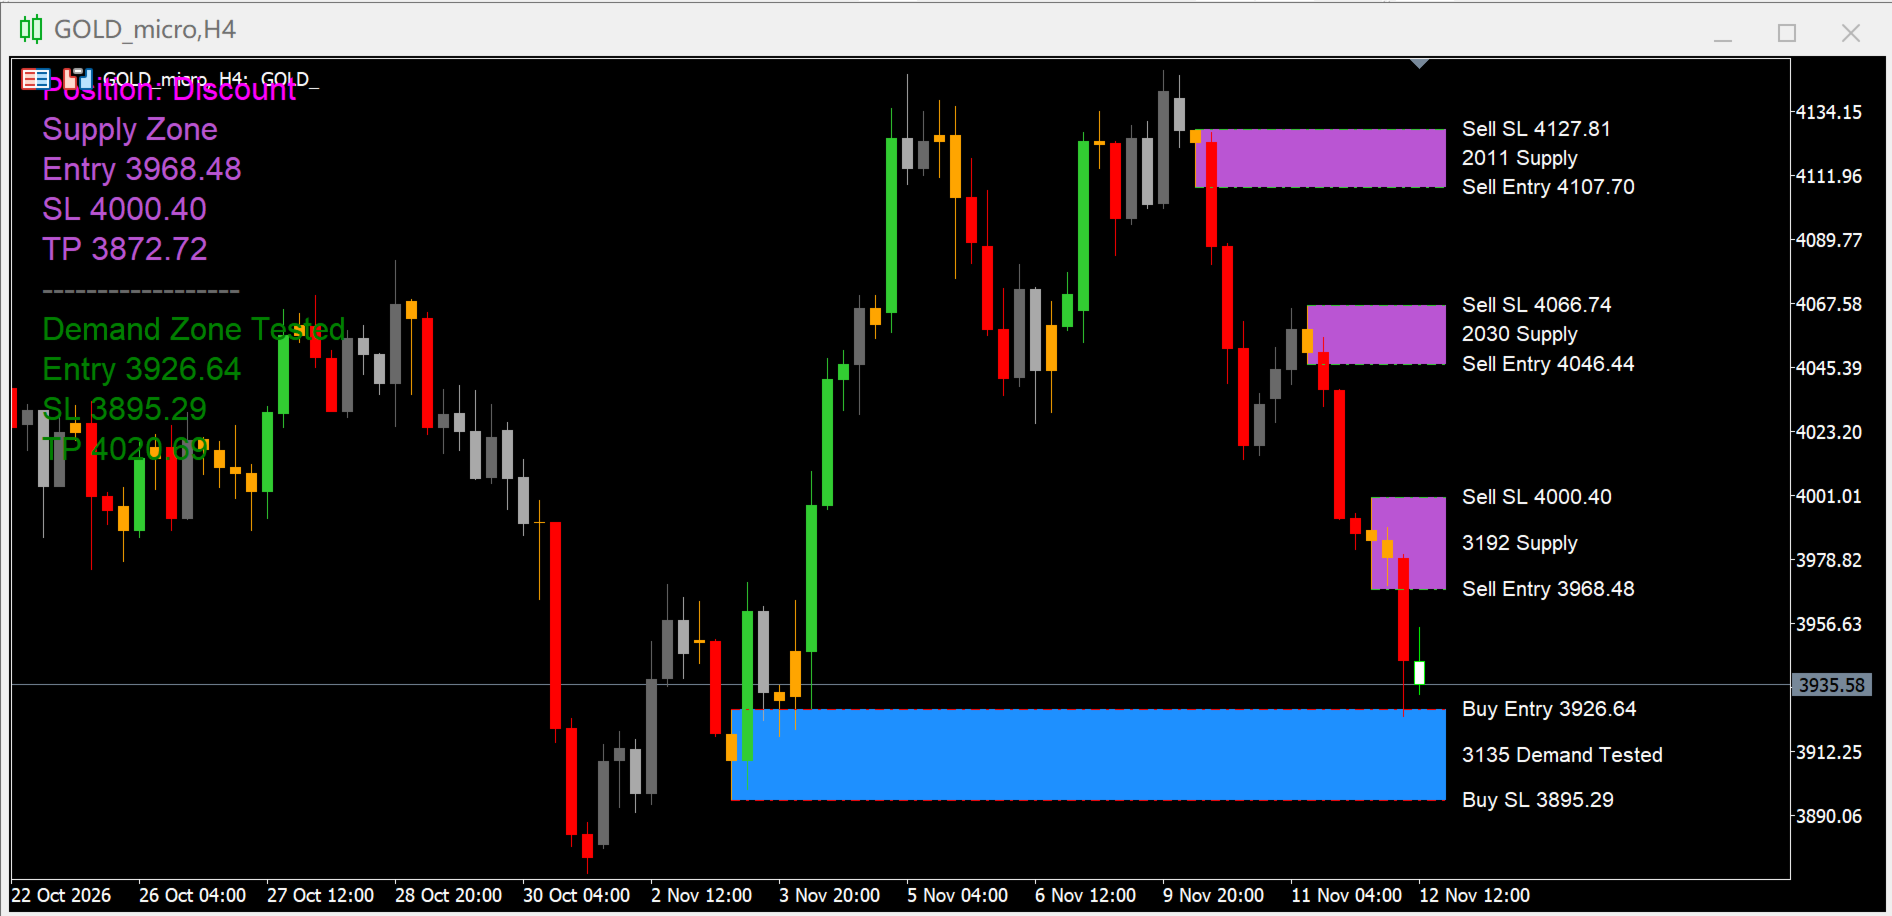
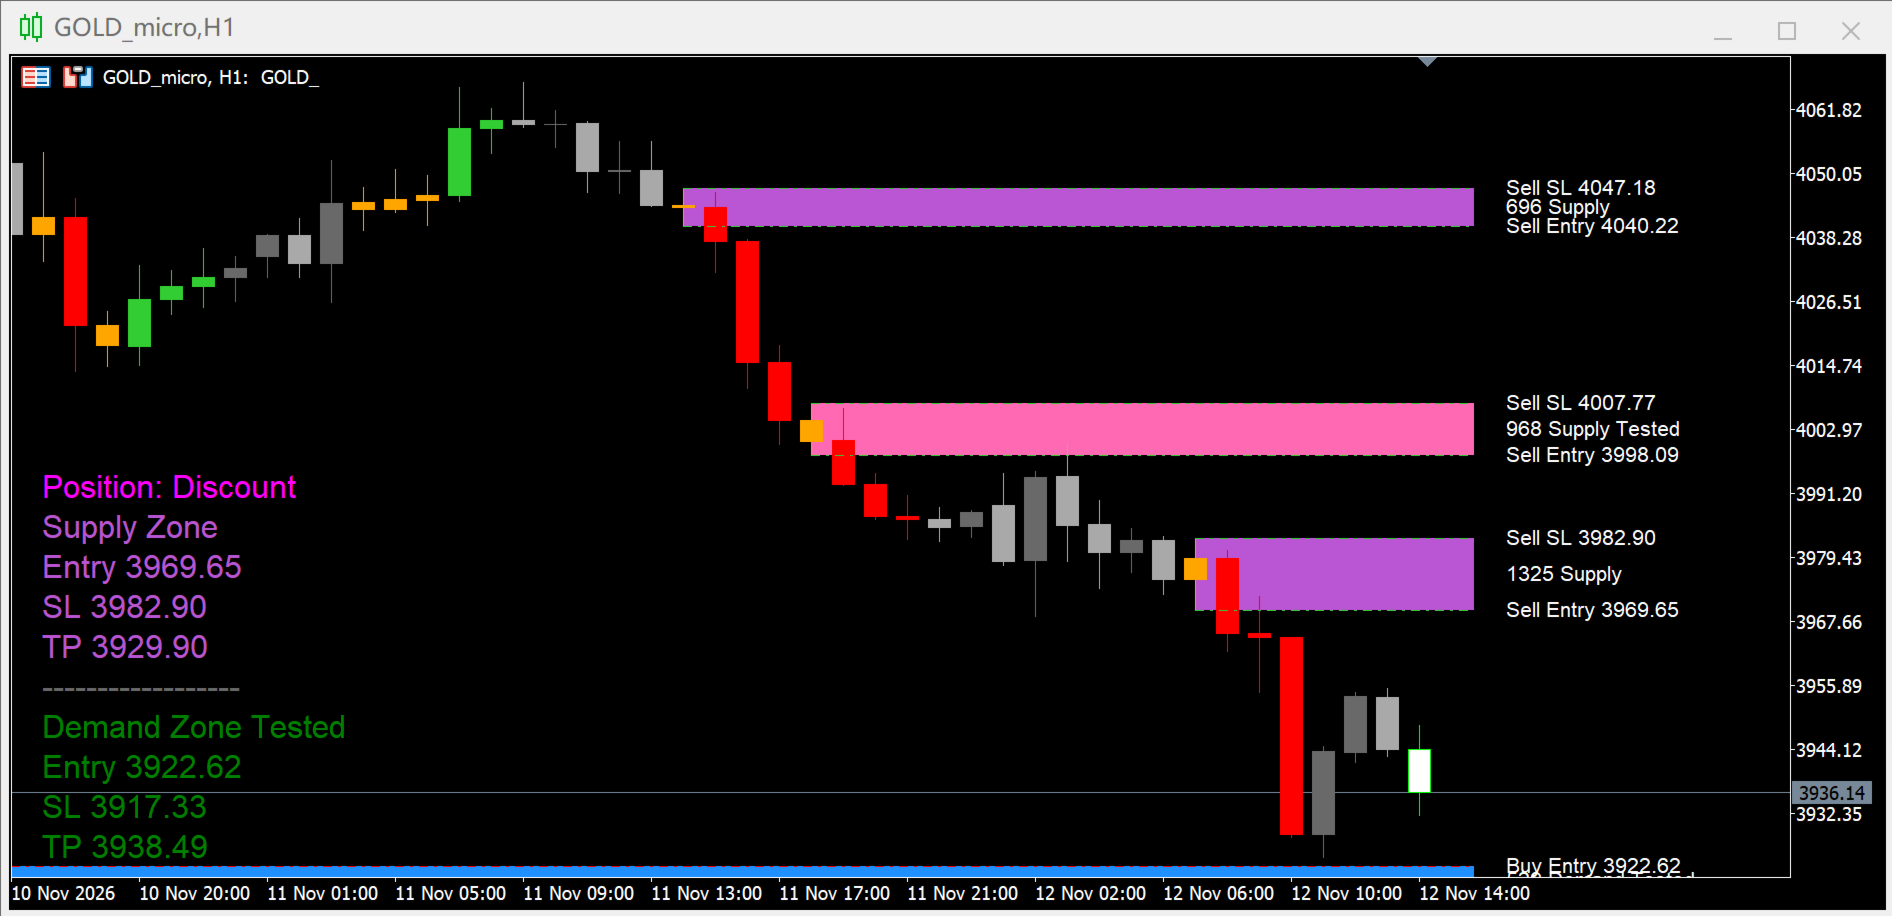
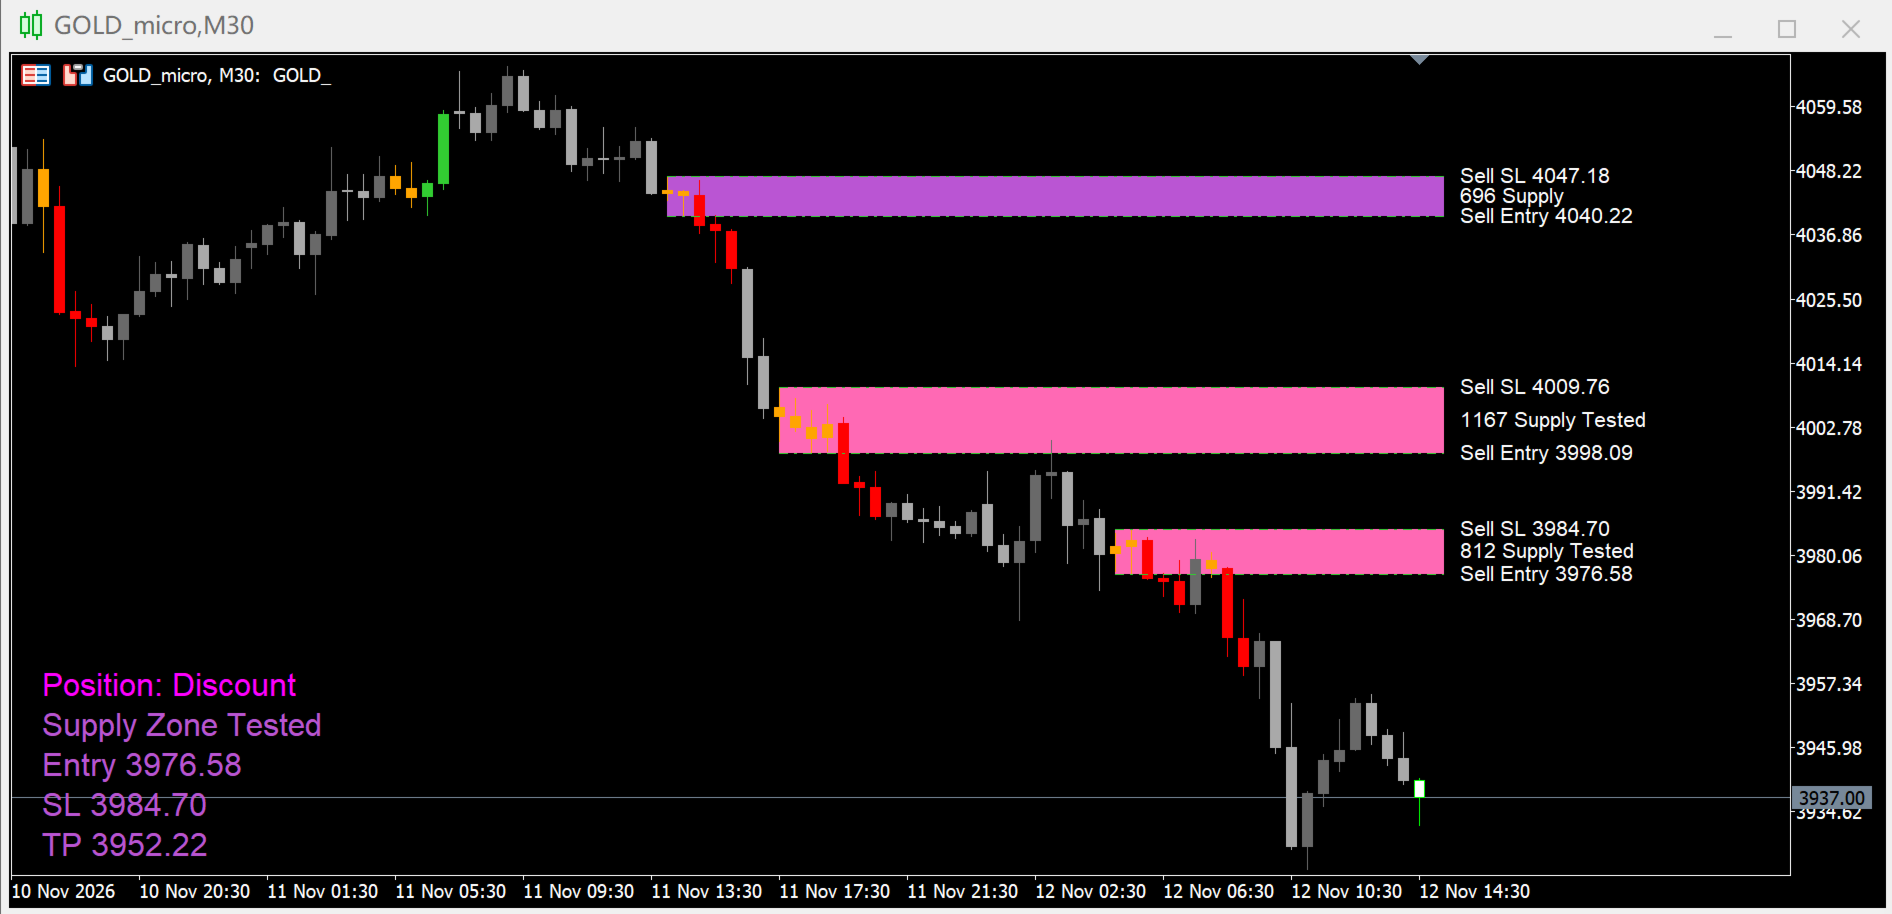
Supply Demand GoldMaster
- Индикаторы
- Версия: 6.60
- Обновлено: 13 ноября 2026
- Активации: 5

Supply Demand GoldMaster
Overview
Supply Demand GoldMaster is a technical analysis indicator for MetaTrader 5 designed to identify supply and demand zones, as well as momentum and base candles. It is built for price action and order-flow-oriented traders who analyze market structure, liquidity, and order blocks. The indicator operates strictly on closed bars to prevent repainting.
How it works
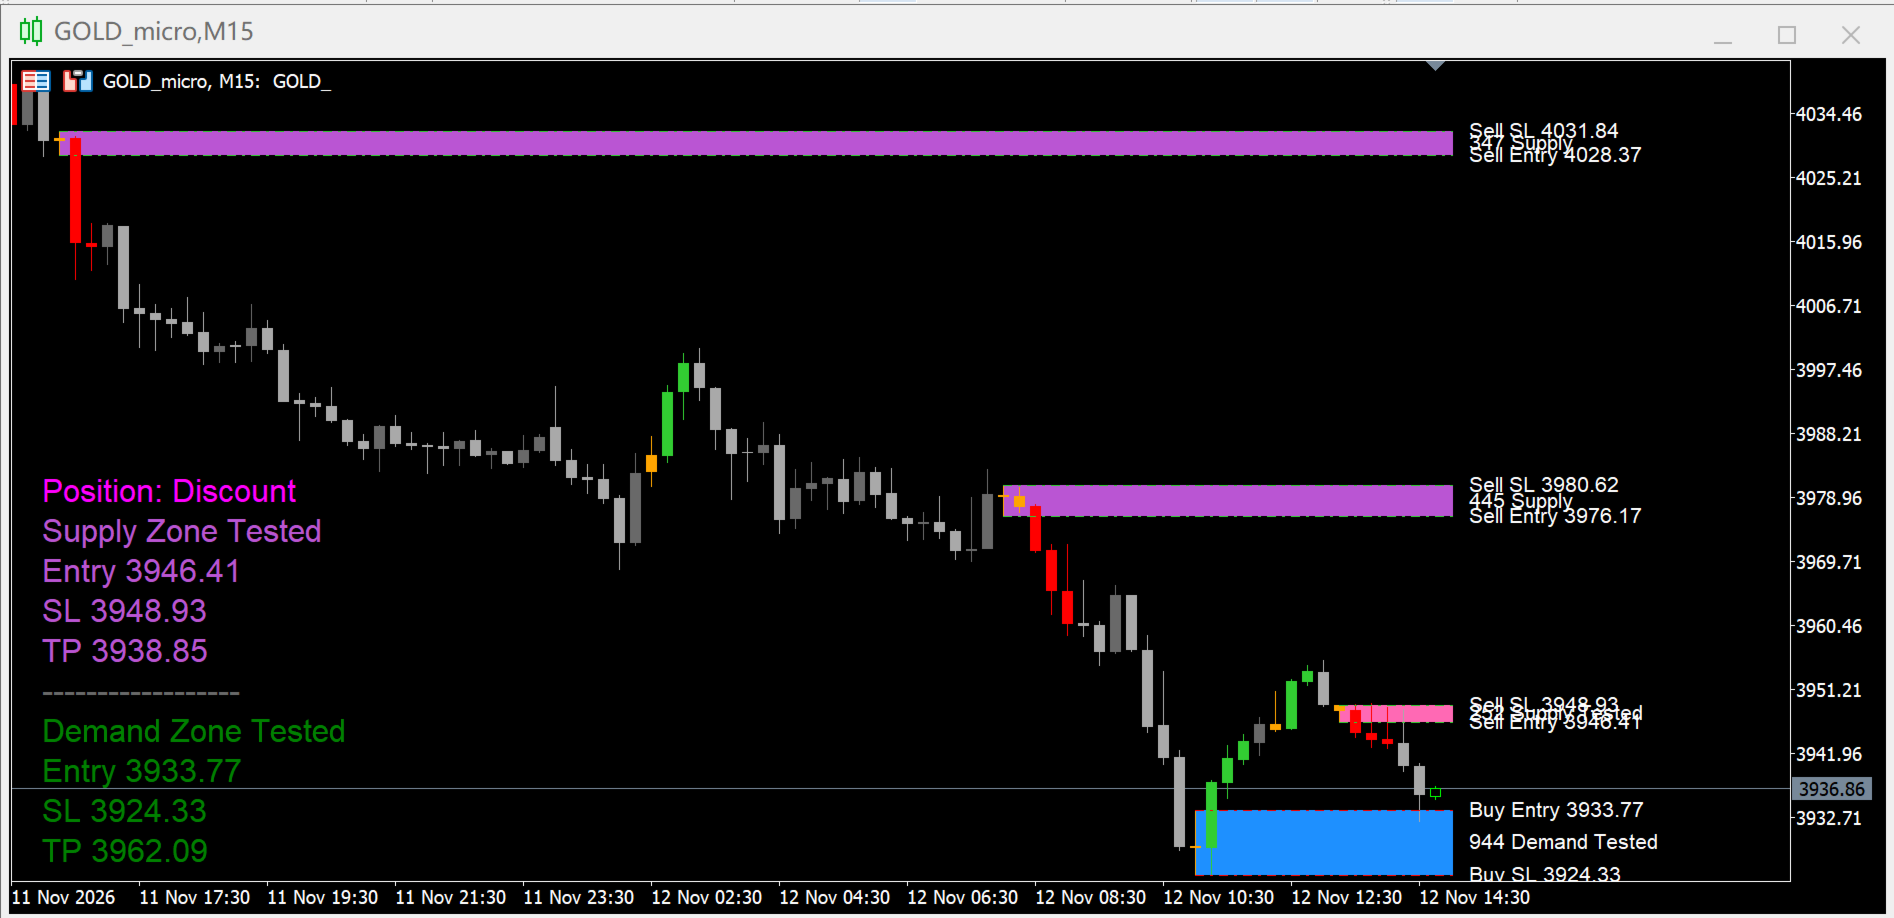
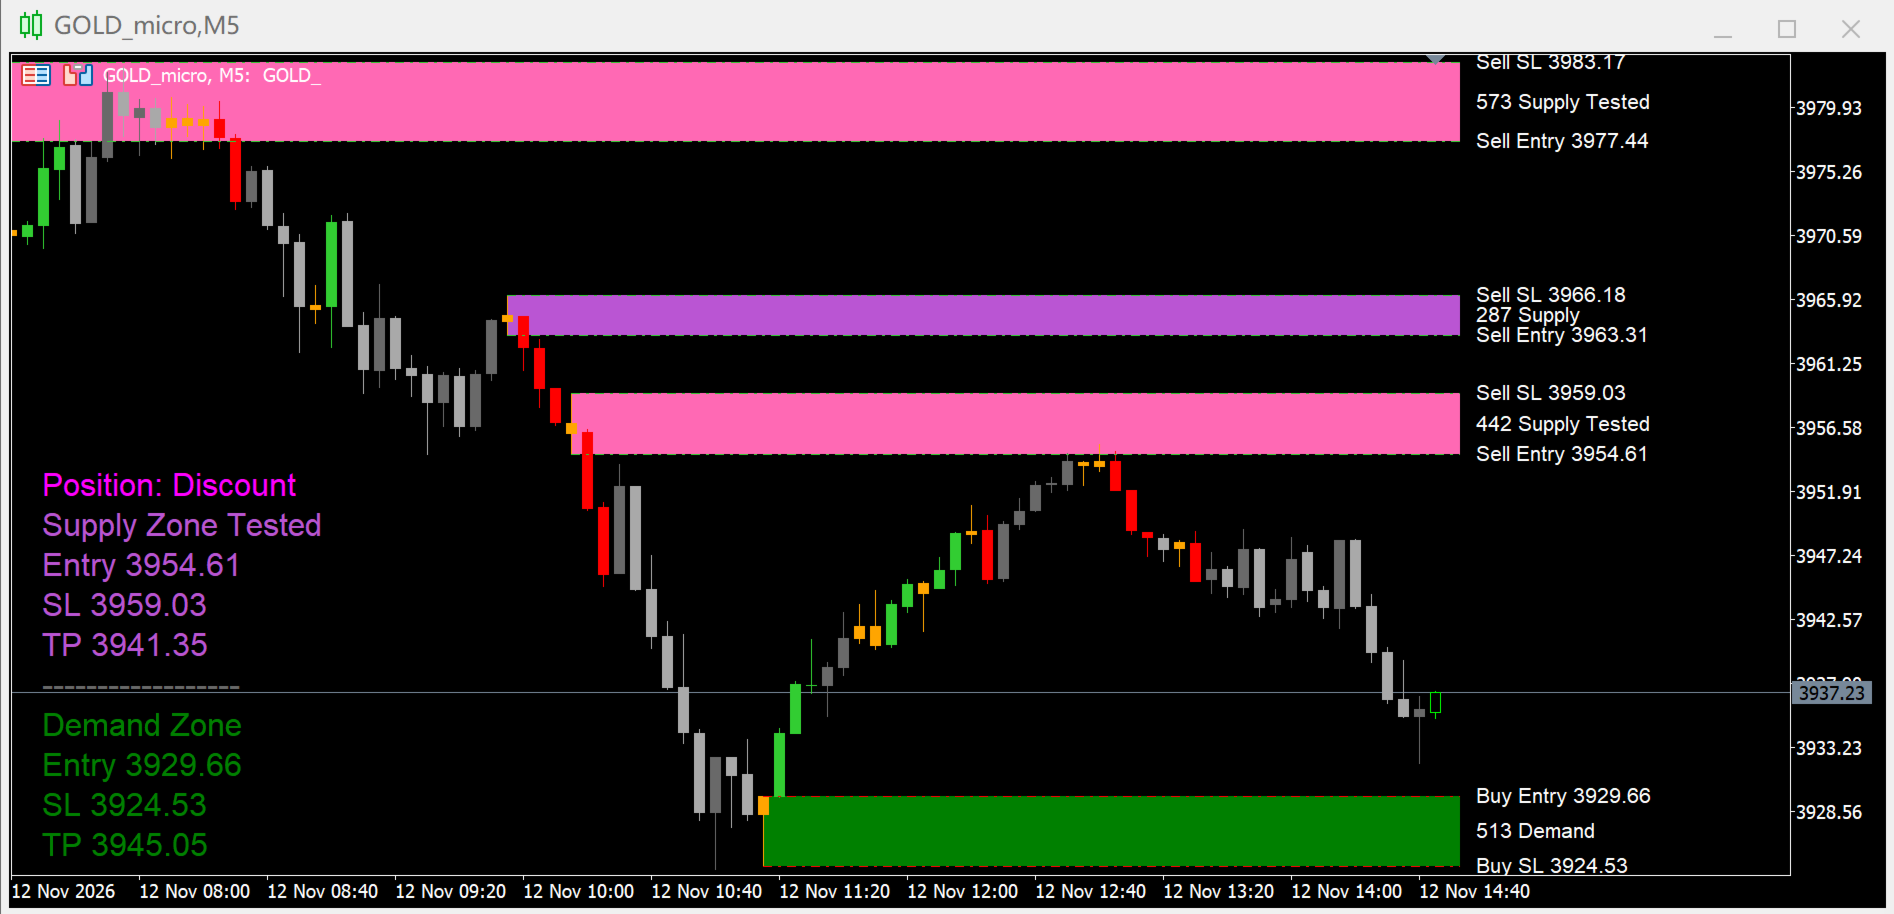
The indicator scans recent price data to locate valid base structures (short consolidations or small-bodied candles) followed by strong impulsive movements (large-bodied candles).
-
When a bullish impulse breaks above a base structure, a Demand Zone is created.
-
When a bearish impulse breaks below a base structure, a Supply Zone is created.
The core logic also detects overlapping zones and can automatically merge them or remove zones that have been structurally broken by price action, keeping the chart clean.
Key Features
-
Zone Detection: Automatically draws Supply and Demand zones based on base and impulse candle structures.
-
Zone Status: Differentiates between untested zones and retested zones using independent color inputs.
-
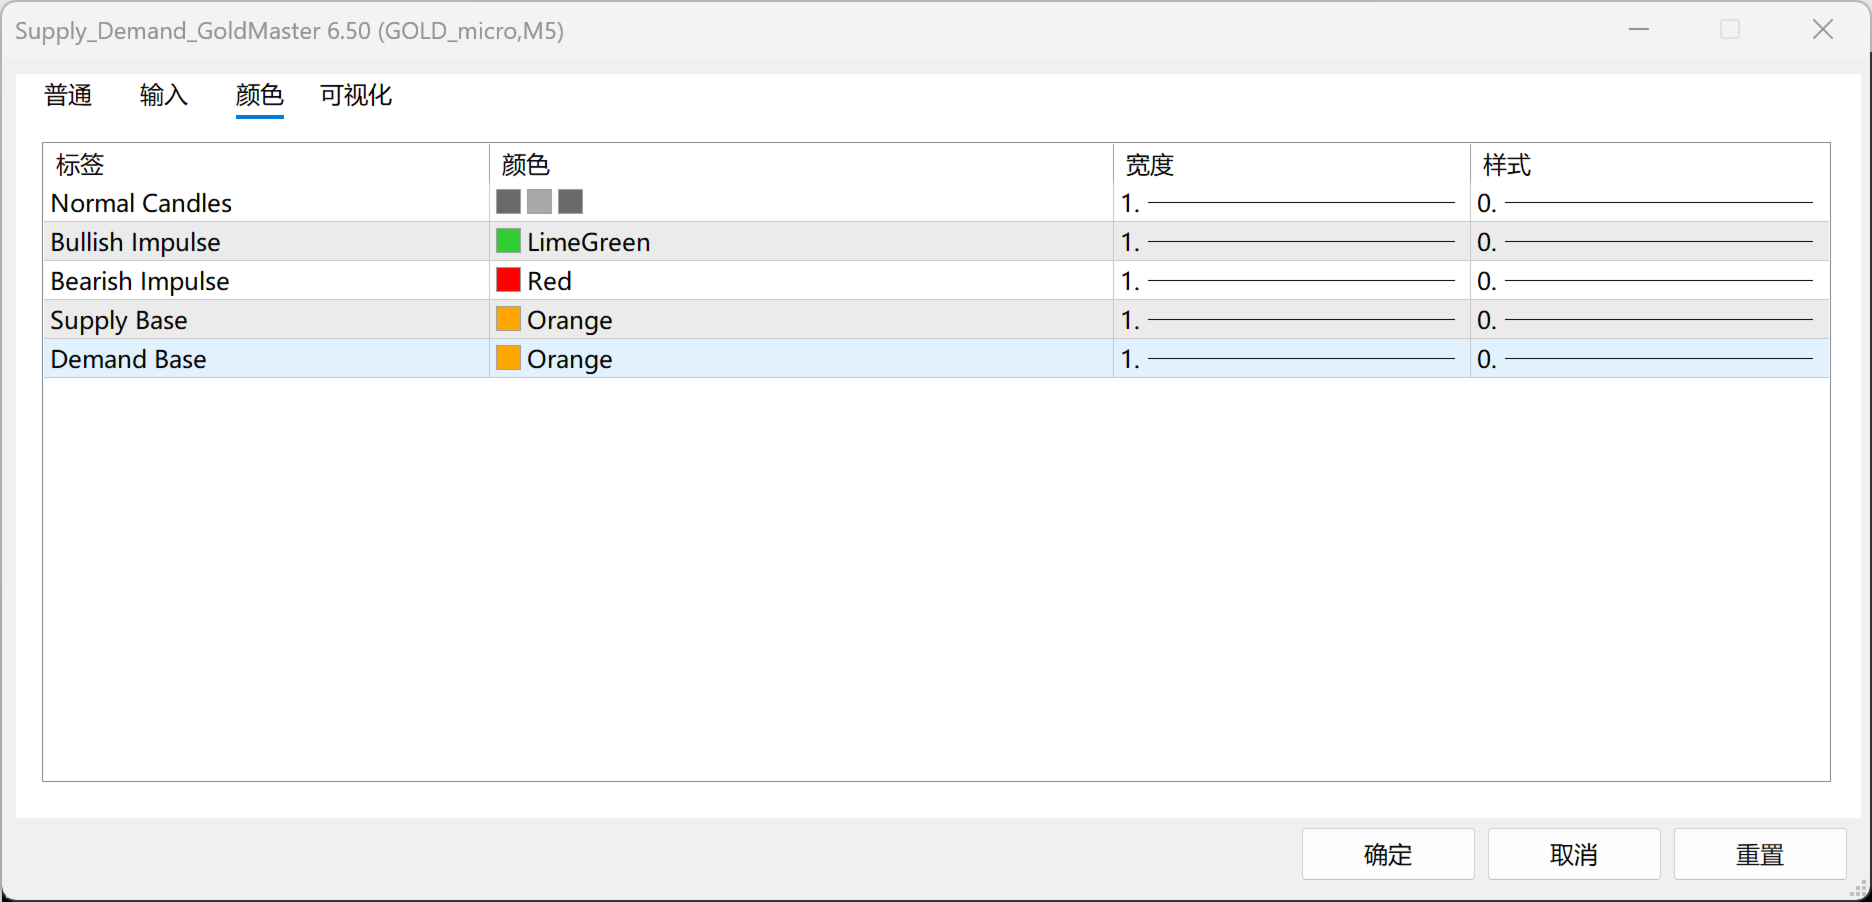
Candle Highlighting: Optional coloring for base candles and impulse candles to visually confirm the zone origin.
-
Info Dashboard: A customizable on-chart panel that displays the nearest Supply and Demand zones, current market position (Premium, Discount, or Equilibrium), and calculated Entry, Stop Loss, and Take Profit levels based on a user-defined Risk/Reward ratio.
-
Equilibrium & Target Lines: Option to display the 50% midline of a zone and the projected target levels.
-
Non-Repainting: Calculations for zones and alerts are synchronized with new bar formation.
-
Multi-Channel Alerts: Notifications for when price enters a zone or breaks a zone, delivered via popup, sound, push notification, or email.
Input Parameters Summary
-
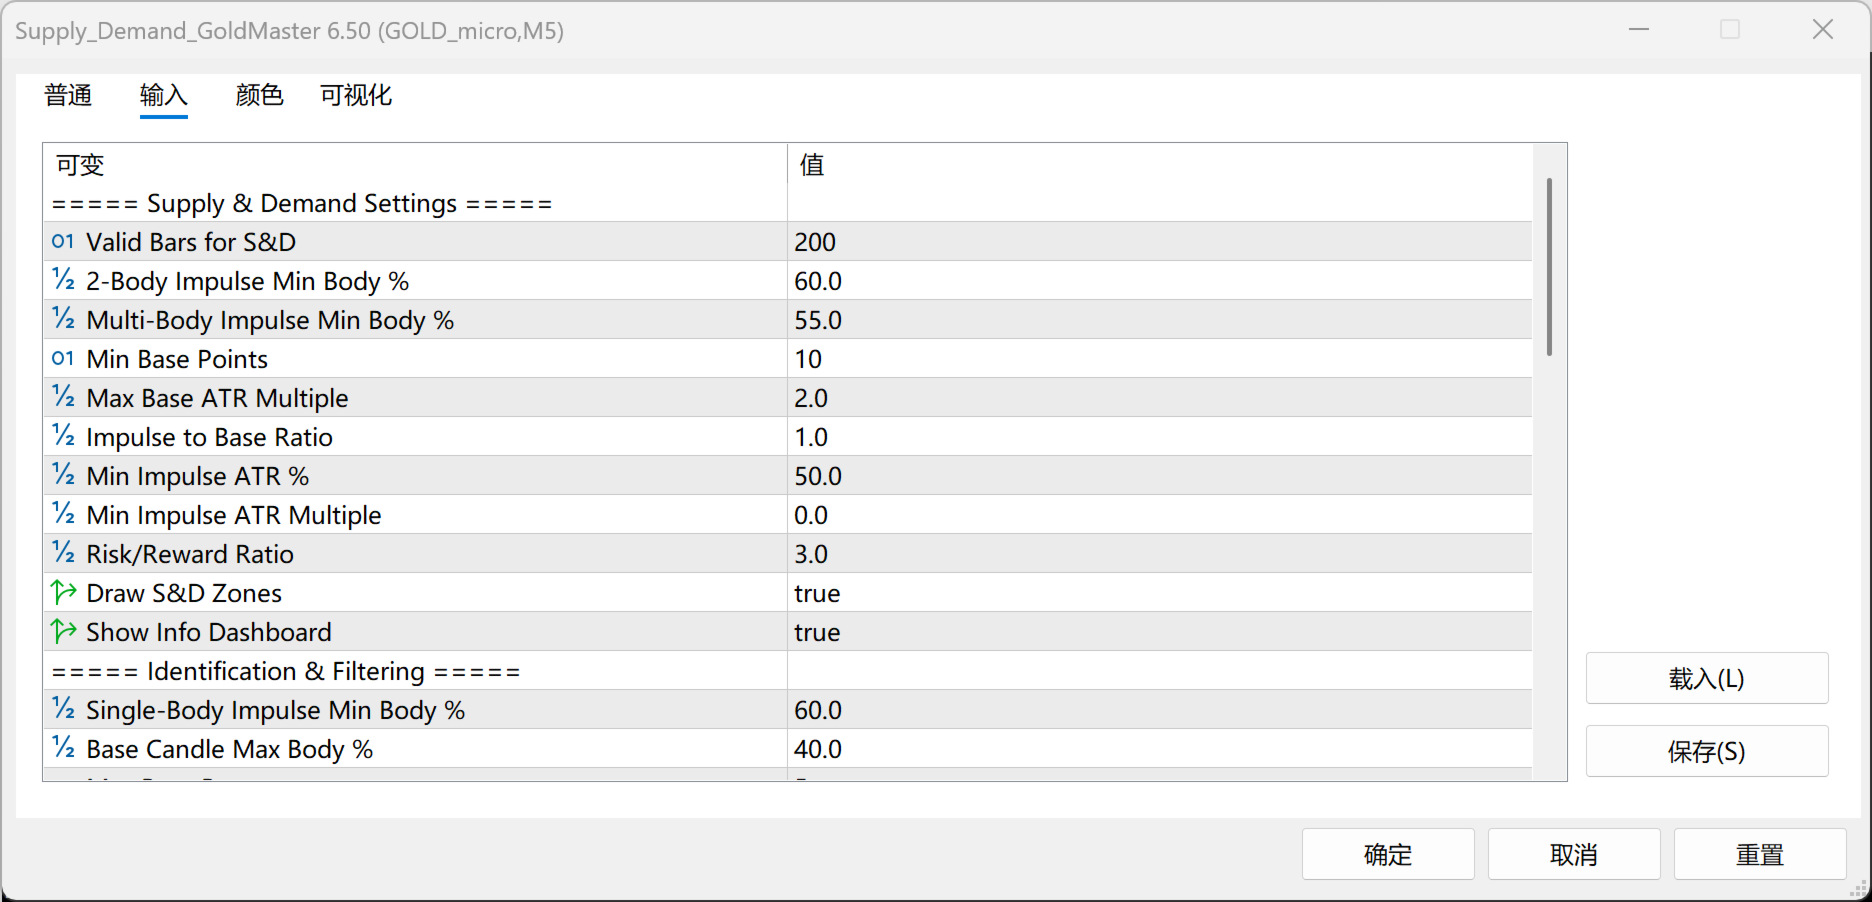
Supply & Demand Settings: Adjust body percentage thresholds for impulses, maximum base bars, ATR filters, and minimum impulse size.
-
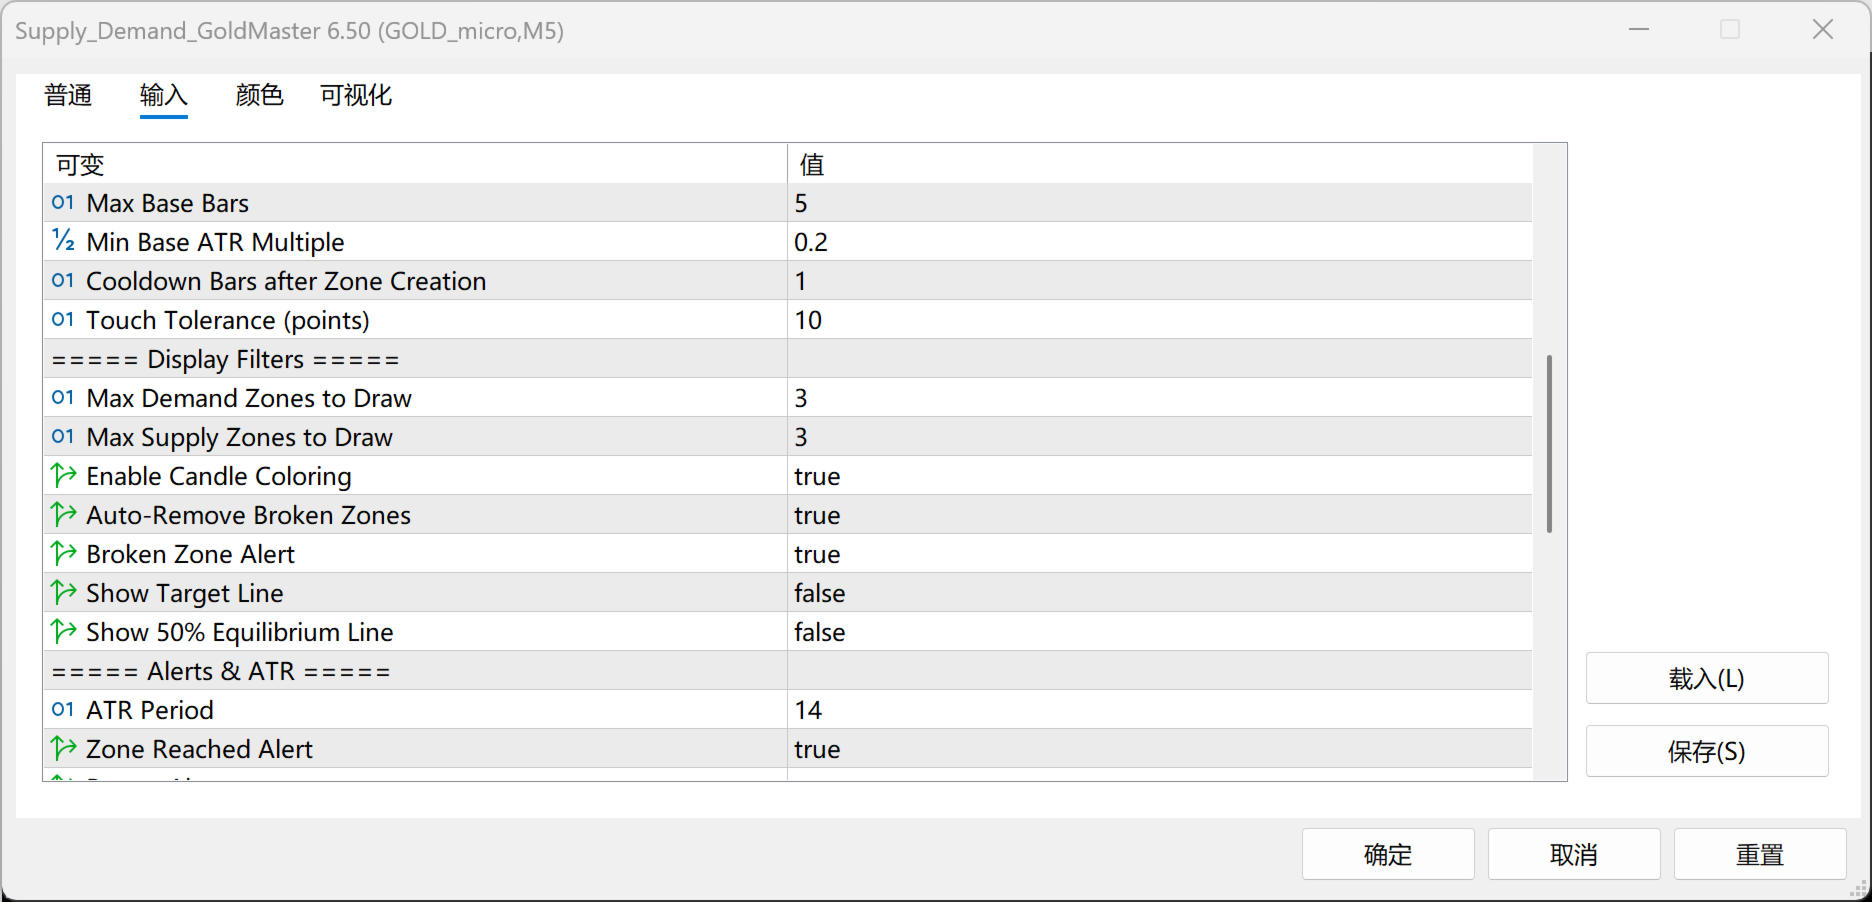
Identification & Filtering: Configure touch tolerance, cooldown bars between zones, and auto-removal of broken zones.
-
Display Filters: Control the maximum number of demand/supply zones drawn on the chart, enable/disable candle coloring, and toggle the information dashboard.
-
Alerts & ATR: Set ATR period and configure popup, push, and email alerts.
-
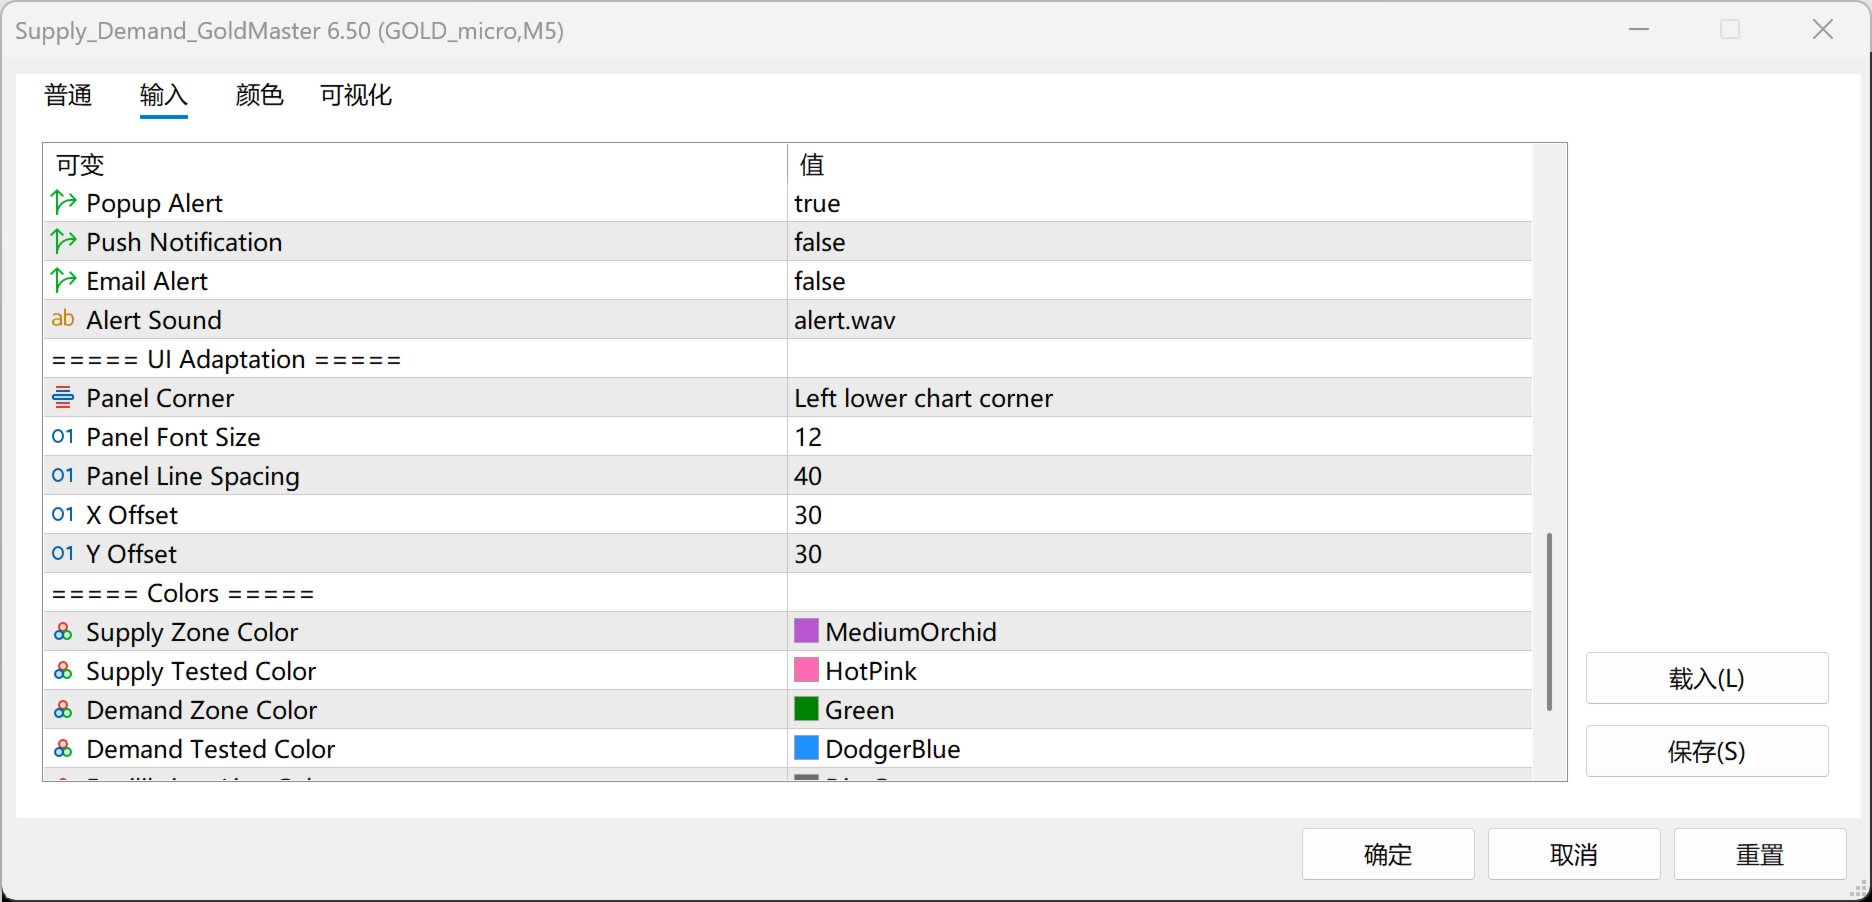
UI Adaptation: Customize the dashboard position, font size, and line spacing.
-
Colors: Fully customizable colors for supply/demand zones (tested and untested), midlines, and chart text.
Usage Notes
-
Attach the indicator to any chart and timeframe.
-
The indicator updates its calculations when a new bar opens. It will not redraw historical zones based on current tick fluctuations.
-
The Info Dashboard provides the most recent structural levels. If a zone is broken, the dashboard will update to the next available zone.
-
Alerts trigger when the current price action touches the boundaries of an active zone (using the configured touch buffer).
Risk Disclaimer
This indicator is a technical analysis tool designed for educational and analytical purposes. It does not place trades, manage risk, or guarantee any specific trading outcome. Supply and demand zones represent areas of potential interest, not guaranteed reversal or breakout points. Trading foreign exchange and CFDs carries a high level of risk. Please test the indicator on a demo account and use proper risk management before applying it to live trading.