 MetaTrader 5
 Эксперты
 Индикаторы
 Библиотеки
 Утилиты
 Виджеты
 Правила
Смотри обучающее видео по маркету на YouTube
Как купить торгового робота или индикатор
Запусти робота на
виртуальном хостинге
виртуальном хостинге
Протестируй индикатор/робота перед покупкой
Хочешь зарабатывать в Маркете?
Как подать продукт, чтобы его покупали
Технические индикаторы для MetaTrader 5 - 225
 На основании сигналов технических индикаторов принимаются решения относительно открытия или закрытия сделки на фондовом и форекс-рынках. Суть индикаторов заключается в математическом преобразовании цены и/или объемов финансового инструмента для прогнозирования изменений цен в будущем.
Протестируйте технические индикаторы, чтобы лучше предсказывать поведение рынка и зарабатывать на этом.

X Ray — Загляните внутрь каждой свечи (MT5) Большинство индикаторов считывают только цены открытия, максимума, минимума и закрытия (OHLC). Это лишь итоговая история свечи, которая скрывает то, как именно она формировалась. X Ray отслеживает потиковое поведение внутри каждой формирующейся свечи в реальном времени: Скорость поступления тиков и время удержания цены перед импульсом Частоту пробоя локальных максимумов и минимумов Соотношение времени, проведенного ценой в теле свечи и в ее тенях Длите

MFI Zone Pro — профессиональный индикатор на основе индекса денежного потока (Money Flow Index), объединяющий в себе динамику цены и реальные рыночные объемы. В отличие от стандартных ценовых осцилляторов, MFI показывает не просто движение котировок, а интенсивность реального вливания денег в актив. Индикатор решает главную проблему классического MFI — ложные сигналы на тонком, низколиквидном рынке. Благодаря скрытому алгоритму Advanced Trend Filter , инструмент фильтрует каждый выход из экстрем

Daily gold recaps and new signals on my channel: https://www.mql5.com/en/channels/kizami-gold Launch price: 39 USD. The price goes up by 10 USD after every 10 copies sold.
Buyers get the KIZAMI Trade Assistant for free (one-click orders with Entry, SL and TP already filled in). Just send me a message after purchase. KIZAMI - Gold Scalper Signals 76.6% win rate on XAUUSD M5 (backtest, TP1 hit before SL).
Around 15 signals a day, each with Entry, TP1, TP2 and SL. KIZAMI is Japanese for "to carve".

Key Market Profile — Interactive Volume & TPO Profile Строит профессиональный Volume/TPO Profile за 2 клика. Интерактивные уровни POC, Value Area, Zero-Lag архитектура. Больше никаких тяжелых картинок, вешающих график. Профиль рынка, который не тормозит график и строится за 2 секунды. Классические индикаторы Volume Profile часто требуют долгой настройки, выделения зон и, что самое неприятное, сильно нагружают терминал из-за тяжелых растровых картинок (Bitmaps). Key Market Profile решает эти

A simple, highly effective trend-following and pullback indicator based on the EMA 8/13 crossover. Displays clear visual arrows with built-in trend direction to help you enter high-probability trades!
Take the emotion out of your trading with the Trend Reversal & Pullback Arrow Indicator ! Built on the classic, battle-tested EMA 8 & EMA 13 crossover , this indicator helps traders identify both major trend reversals and high-probability pullback continuation setups. Designed specifically for M5

NewsLens - Economic News on the Chart for MT5
High-impact news moves the market in seconds and many prop firms forbid trading around it. NewsLens shows the economic calendar directly on your chart, so you always know what is coming and when to stay out. Data comes from the economic calendar built into MetaTrader 5: no external website, no DLL, nothing to configure.
Panel - The next events of your currencies with a live countdown ("in 2h 15m", "NOW"). - Importance colour: red high, orange medi

Overview Astro Gann Cycles is an analytical timing indicator for MetaTrader 5 inspired by interpretations of W.D. Gann's work. Astro Gann Cycles tries to calculates planetary positions directly within MetaTrader to identify repeating astronomical configurations. By analyzing the celestial backdrop associated with major market highs and lows, the indicator models hypothetical cycle waves that could help anticipate potential timing windows where market turning points might occur. Important Note :

Elliott Wave ABC
Overview Elliott Wave ABC is an interactive indicator designed for MetaTrader 5 (MT5) that automates the detection, scoring, and visualization of Elliott Wave Zig-Zag (A-B-C) structures. It scans chart data to locate both completed and incomplete Zig-Zag patterns, offering structural analysis, Fibonacci projection targets, and a stacked dual-panel user interface.
This Elliott Wave indicator is only focused an ABC - Zig-Zag Pattern.
---
Key Features
1. Automated Zig-Zag D

ScanLens - Multi-Symbol Trend Scanner for MT5
Stop flipping through 20 charts. ScanLens shows up to 30 symbols in one panel with the trend on four timeframes, the last market-structure break, the position against the Asian range, the daily change and the volatility. Aligned symbols are highlighted, so you see at a glance where the opportunities are.
Columns - Trend on M15, H1, H4 and D1: fast/slow EMA (21/55) with ADX(14) confirmation. Green arrow = up, red arrow = down, dash = range (ADX bel

KillzoneLens - ICT Killzones for MT5
The ICT killzones are the hours when the big players move the market: the London open and the New York open above all. KillzoneLens draws them on your chart in the right place every day, converting New York time to your broker's server time automatically, including the US and European daylight-saving changes.
Killzones (New York time, all adjustable) - Asian 20:00-00:00, London open 02:00-05:00, New York open 07:00-10:00, London close 10:00-12:00. - A colo

JournalLens - Trading Journal and Account Statistics for MT5
Do you really know how you trade? JournalLens turns your account history into a clear trading journal right on the chart: how much you made today, this week or this month, your win rate, profit factor, drawdown, best hours and best symbols. No spreadsheets, no external websites.
Periods Today, Week, Month, Year and All, one click away.
Statistics - Net profit/loss in money and % of the starting balance of the period. - Number of tr

لوحة نابا هي لوحة مساعدة تظهر على الرسم البياني الخاص بك وتبقي ثلاثة أشياء أمامك: ما هي الأخبار القادمة، وكم من الوقت المتبقي، وما هو حجم مركزك بالنسبة للمخاطرة التي اخترتها.
ما يفعله - أخبار اقتصادية قادمة. يعرض هذا القسم الأحداث القادمة من التقويم الاقتصادي المدمج في منصة MetaTrader 5، مع تحديد العملة والأهمية (عالية، متوسطة، منخفضة) والتوقيت المحلي. يمكنك تصفية النتائج حسب الأهمية واختيار عدد الأحداث المراد عرضها. يعمل هذا القسم مع جميع العملات أو مع عملات رمز التداول فقط. - عد تنازلي مباشر

Account Info Panel выводит цифры, которые вы проверяете чаще всего, в одну небольшую панель на графике, чтобы не переключаться на вкладку «Торговля».
Что показывает - Баланс и средства. - Плавающая прибыль/убыток открытых позиций. - Закрыто сегодня: прибыль, своп, комиссия и сборы по сделкам, закрытым с начала серверного дня. Пополнения и выводы не учитываются. - Использованная маржа и свободная маржа. - Уровень маржи, выделяется, когда опускается ниже 200%. - Просадка за сегодня: насколько сре
FREE

Day and Week Separators рисует вертикальные линии в начале каждого дня, недели и месяца на внутридневных графиках, с необязательной подписью дня недели у каждой линии. Это небольшая визуальная подсказка, которая помогает увидеть, где заканчивается один торговый день и начинается следующий.
Как это работает - Для разделителей дня, недели и месяца есть свой переключатель, цвет и стиль линии. - Если несколько периодов начинаются на одном баре, рисуется только самая сильная линия: месяц важнее неде
FREE

Opening Range Levels отмечает максимум, минимум и середину диапазона открытия — первых минут выбранной вами сессии — и протягивает эти уровни на остаток дня.
Как это работает - Вы задаёте окно и его часовой пояс: Нью-Йорк (по умолчанию 09:30-10:00), Лондон, Токио или серверное время вашего брокера. - Летнее время США и Великобритании учитывается автоматически. Смещение сервера брокера определяется по терминалу; большинство брокеров переводят часы вместе с летним временем США, это значение по ум
FREE

Spread and Swap Info показывает торговые издержки и временные параметры текущего символа в небольшой панели, чтобы новички могли проверить их, не открывая спецификацию символа.
Что показывает - Спред в пунктах, с пометкой "(fixed)", если брокер даёт фиксированный спред. - Своп long / short с правильной единицей для режима свопа символа: пункты, валюта (базовая, маржинальная или валюта счёта), проценты годовых или "reopen". Если свопы отключены или оба равны нулю, отображается "Swap: none". - Де
FREE

Bring institutional-level order flow and Smart Money Concepts (SMC) directly to your MetaTrader 5 charts with the Price Action Toolkit . Ported from advanced Pine Script logic, this all-in-one indicator automates the heavy lifting of market structure analysis. Whether you trade Forex, Gold (XAUUSD), Indices, or Crypto, it identifies institutional footprints—such as break of structure, order blocks, and market imbalances—so you can trade alongside smart money with absolute clarity. Key Features &

Adaptive Trend Channel (ATC) — чистые трендовые каналы, которые начинаются там, где рынок действительно развернулся. ATC рисует трендовые каналы прямо на графике и привязывает каждый из них к реальному развороту рынка, а не к произвольному числу свечей. В итоге видно, где начался текущий тренд, насколько он крутой и когда цена выходит из канала. Как это работает Развороты определяются автоматически по волатильности (ATR), поэтому чувствительность подстраивается под инструмент и таймфрейм. Для к

StrengthLens - Currency Strength Meter for MT5
Trade the strongest currency against the weakest one. StrengthLens ranks the 8 major currencies (USD, EUR, GBP, JPY, CHF, CAD, AUD, NZD) from the 28 pairs between them, on three timeframes at once, and tells you the best pair to trade right now.
How it works - For every currency it measures the average % change against the other 7 currencies over the last N candles (12 by default). - The 8 currencies are ranked on the main timeframe, with a stren

Market Breakouts Premium Professional multi-symbol, multi-timeframe breakout and structure confluence system that identifies high-probability directional setups by combining Wick Sequence Breakouts, institutional-style market structure (CHoCH / BOS / Rejected Blocks / FVG), and a daily directional bias filter.
Market Breakouts Premium is a complete visual trading terminal for MetaTrader 5. It scans your Market Watch, detects Wick Sequence Breakout formations, confirms them against Entry Termin

G-Labs BTMM All-In-One Template — the classic Beat The Market Maker chart pack for MetaTrader 5. One indicator that brings together the tools BTMM traders have used for years on MT4 installer-style templates: Traders Dynamic Index (TDI), the multi-MA stack, Asian London and New York session frames, ADR information panel, EMA cross signals, and TDI W/M shark-fin markers.
If you know the old MT4 BTMM installer pack — the all-in-one chart setup that many traders still run today — this is that ide

MarketProfile Complete A visual TPO workspace for MetaTrader 5 that brings profile structure, session context and M30 price action together. Compare profiles across sessions, focus on one daily session with Profile + M30 , or review chronological TPO columns . The built-in information panel helps you inspect key levels, value-area changes and the available data. Explore the workspace Multi-profile view: compare several profiles and select the session you want to examine. Profile + M30: view a se

KNN-VWMA Confluence Scanner Multi-Timeframe Machine-Learning Confluence Scanner with Daily Bias, Risk Box & News Filter
SaintEmma KNN-VWMA Confluence Scanner is a professional multi-symbol, multi-timeframe scanner that combines two independent machine-learning engines (VWMA + kNN ADX/MFI and KNN Momentum) and only presents signals when they agree. It delivers ranked setups with calculated entry, stop-loss, take-profit, position size and daily bias context in a clean dashboard.
2. WHAT THIS IN

Product name Zones Detector— Support & Resistance Reaction Zones Short description Automatic supply/demand zones built the way traders mark them by hand: swing pivots that produced a real ATR-sized reaction, clustered into thin bands. Multi-reaction zones, higher-timeframe confluence, previous-day levels, break detection and retest arrows. Chart-only, no trading. Why Zones Detector! USING THIS INDICATOR YOU DONT NEED TO WATCH THE CHART FOR A LONG PEROID OF TIME TO CATCH A TRADE. ITS MADE FOR

Liquidity Zones MTF следит за ближайшим нетронутым свинг-максимумом над ценой и ближайшим нетронутым свинг-минимумом под ценой и показывает, что происходит, когда цена до них доходит. Та же логика второй раз выполняется на старшем таймфрейме, и его уровни и события рисуются на вашем графике. Используются только закрытые свечи: значение для свечи записывается после её закрытия и больше не меняется. КАК НАХОДЯТСЯ УРОВНИ - Свинг-максимум - свеча, максимум которой не превышен N свечами с каждой стор

Anchored Periodic VWAP with Deviation Bands A lightweight, interactive VWAP indicator that restarts every Day, Week or Month, with a built-in on-chart control panel. Overview Anchored Periodic VWAP plots the Volume Weighted Average Price and resets it automatically at the start of each Daily, Weekly or Monthly period. Around the VWAP it draws two pairs of standard-deviation bands, so you can see at a glance where price is trading relative to the period’s “fair value”. You can switch the anchor p
FREE

This indicator automatically detects harmonic price patterns on your chart, both bullish and bearish, and shows them as soon as they form, including potential patterns that are still developing. For every pattern it draws the Potential Reversal Zone (PRZ), and for completed patterns it also draws two take-profit and two stop-loss levels.
Supported Patterns: Gartley, Bat, Butterfly, Crab, Deep Crab, Shark and Cypher. Each pattern can be switched on or off individually.
Key Features: Completed
FREE
The Schaff Trend Cycle (STC) is a technical analysis tool designed to help traders identify trends and potential reversals in the market. It combines elements of cycle analysis and moving averages, making it particularly useful for predicting price movements in various financial instruments, including forex 1 . Key Features Predictive Nature : The STC is known for its ability to provide early signals about potential trend changes. This makes it a valuable tool for forex traders looking to
FREE
The RSI Channel Binary indicator is a specialized tool designed for binary options trading, leveraging the power of the Relative Strength Index (RSI) . The RSI is a momentum oscillator that ranges from 0 to 100 , helping traders identify overbought and oversold conditions in the market. In the RSI Channel Binary indicator, the following key signals are utilized: Buy Signal (CALL) : A CALL option is indicated when the RSI crosses above the 30 level. This movement suggests that the ass
FREE
The Pattern ADX RSI indicator is a powerful trading tool designed to enhance decision-making by combining the strengths of three distinct components: price patterns , Relative Strength Index (RSI) , and Average Directional Index (ADX) . This indicator waits for specific pattern signals to emerge in the market and then applies filtering mechanisms based on RSI and ADX readings to confirm the quality of the signal before executing trades. Key Components Pattern Detection : The indicator
FREE
The Trend ADX RSI Volumes is an advanced technical indicator that combines the Average Directional Index (ADX), the Relative Strength Index (RSI), and volume information to provide a comprehensive analysis of market trends. This indicator is designed to help traders identify not only the strength of a trend but also its direction and validity. Key Features of the Indicator Trend Strength Measurement : The ADX quantifies the strength of a trend on a scale from 0 to 100. Values above 25 ge
FREE

The Trend ADX is a specialized implementation of the Average Directional Index (ADX) that focuses on identifying and confirming market trends. By utilizing ADX along with its directional indicators, Trend ADX helps traders pinpoint the strength of a trend and make informed trading decisions. Key Features of Trend ADX Strength Measurement : The Trend ADX quantifies the strength of a trend, allowing traders to determine whether to enter or exit positions based on trend momentum. Direction Indi
FREE
Flux Binary FX is a powerful trading tool designed specifically for binary options and forex trading. This innovative indicator utilizes a unique approach to identify significant market trends, providing traders with clear signals to enhance their trading strategies. Key Features: Flux Trend Detection: The indicator generates arrows on the chart that indicate the presence of a flux trend. This feature allows traders to quickly identify potential entry and exit points, making it easier to cap
FREE
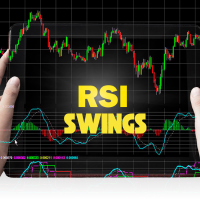
The RSI Swings indicator is a powerful tool designed for MetaTrader 5 (MT5) that combines the principles of the Relative Strength Index (RSI) with high and low price levels to enhance trading decisions. This innovative indicator helps traders identify potential reversal points in the market by analyzing price swings in conjunction with RSI readings. Key Features High-Low Analysis : The RSI Swings indicator focuses on the highs and lows of price movements, allowing traders to pinpoint signifi
FREE
The RSI Back Arrows indicator is a powerful tool designed for traders who rely on the Relative Strength Index (RSI) to identify potential market reversals. This indicator specifically highlights when the RSI has exited the oversold or overbought zones, providing clear visual signals to inform trading decisions. Key Features: Visual Cues : The indicator marks arrows on the chart when the RSI crosses back into a neutral zone, making it easy to spot potential entry and exit points. Over
FREE

BB Out Arrows is a powerful and intuitive indicator designed for MetaTrader 5 (MT5) that enhances trading strategies using Bollinger Bands. This indicator signals potential trading opportunities by displaying arrows when a candle closes outside of the Bollinger Bands, but with an added layer of precision through a wick percentage filter. Key Features: Bollinger Bands Integration: Utilizes the classic Bollinger Bands to identify market volatility and potential price reversals. Arrows Indicati
FREE
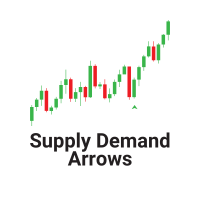
The "Supply Demand Arrows" indicator for MetaTrader 5 (MT5) is a powerful trading tool designed to help traders identify critical supply and demand zones in the market. By visually marking these zones with arrows, the indicator enhances trading precision and decision-making. Key Features Identification of Supply and Demand Zones : The indicator effectively highlights key supply and demand zones on the price chart, allowing traders to see where significant buying or selling pressure exists. T
FREE

SMC Structure Map draws market structure, order blocks, fair value gaps and liquidity sweeps the same way every time: only from closed candles, with fixed rules you can read. What you see on history is exactly what you would have seen live — nothing is redrawn later. Application instructions Market structure Confirmed swing highs and lows labelled HH / HL / LH / LL (equal highs / lows as EQH / EQL). BOS (continuation) and CHoCH (change of character) when a candle closes beyond the active swing
FREE

Fx Gamma Profile - see where the options market is positioned, directly on your MetaTrader 5 chart. Fx Gamma Profile turns an options-chain file into a gamma-exposure (GEX) map and draws it beside price: a bar for every strike, the call wall, the put wall and the zero-gamma level, plus a status panel that explains in plain words what the numbers imply. It is a decision-support tool for discretionary traders who want options-market context for FX pairs. READ BEFORE YOU BUY - THIS INDICATOR NEE

Polynomial Regression Pro – Advanced Curve Fitting Indicator for MetaTrader 5 Unlock advanced mathematical modeling in your trading with Polynomial Regression Pro , a professional-grade indicator designed specifically for MetaTrader 5. By fitting a smooth polynomial curve to historical price action, this indicator helps traders accurately identify cyclical trends, market turning points, and dynamic support or resistance levels.
Key Features & Technical Highlights: Least Squares Method: The cor

DFA Hurst Trend Strength Pro – Advanced Fractal & Momentum Indicator for MetaTrader 5 Unlock the deep statistical properties of market dynamics with DFA Hurst Trend Strength Pro , a cutting-edge technical indicator developed specifically for MetaTrader 5. Based on Detrended Fluctuation Analysis (DFA), this sophisticated tool is designed to quantify the self-similarity and long-term memory of price fluctuations, allowing traders to accurately measure trend persistence and market regimes.
Key Fe

FinoSR Trinity — CRT, Liquidity Sweep & Market Structure Analysis FinoSR Trinity is a multi-timeframe technical analysis indicator for MetaTrader 5, designed to help traders identify potential trading opportunities using Candle Range Theory (CRT), Liquidity Sweeps, Market Structure Shifts (MSS), and Fair Value Gap (FVG) analysis. Instead of relying on a single buy or sell signal, FinoSR Trinity combines price action and market structure analysis to provide additional context for trading decision
Какой сегодня день: трендовый день, день в диапазоне, разворотный день, внутренний или внешний день? Day Type Map называет каждый день на вашем графике, показывает, каким складывается сегодняшний день, и как прошлые дни этого символа распределились между шестью типами. На золоте за последние 250 дней 32% составили дни в диапазоне, 17% — трендовые дни вверх и 16% — разворотные дни. Бесплатно, понятно и проверено отдельной реализацией. Что он делает Каждый из последних дней подчёркнут и назван сво
FREE

Hello, traders. Ever stared at your chart wondering what really happened between those highs and lows? Well, allow me to introduce myself. I'm Inspector, your market structure detective
My job you ask? To investigate price action so you don't have to piece together every move yourself. I identify swings, classify market structure, measure retracements, and track how market behavior evolves, turning a busy chart into a clearer picture of what's happening.
Curious about a particular price move?
FREE

Trading View Toolkit is a chart tools indicator for MetaTrader 5. It brings Trading View-style chart handling and drawing tools to MT5: free chart drag, wheel zoom, go-to-date calendar, ruler, rectangles, text, alert lines and zones, and Long and Short positions with a risk-reward ratio. The user guide is published on the MQL5 blog: https://www.mql5.com/en/blogs/post/778436 . Support is available through the product comments or mql5.com messages. Chart movement Free drag moves the chart in time

Your lot may risk more than the percent you set. True Risk shows the real risk of your next trade before you open it. The problem Brokers round every lot down to a step and never go below the minimum lot. On a small account the minimum lot alone can be many times your plan. With 300 dollars and a gold stop 25 dollars away, 0.01 lot already risks 25 dollars, which is 8.3 percent and not the 1 percent you set. The spread and the commission are part of the loss as well. Most calculators show the lo
FREE

Тестовый продукт. Пожалуйста, НЕ ПОКУПАЙТЕ! Тестовый продукт. Пожалуйста, НЕ ПОКУПАЙТЕ! Тестовый продукт. Пожалуйста, НЕ ПОКУПАЙТЕ! Тестовый продукт. Пожалуйста, НЕ ПОКУПАЙТЕ! Тестовый продукт. Пожалуйста, НЕ ПОКУПАЙТЕ! Тестовый продукт. Пожалуйста, НЕ ПОКУПАЙТЕ! Тестовый продукт. Пожалуйста, НЕ ПОКУПАЙТЕ! Тестовый продукт. Пожалуйста, НЕ ПОКУПАЙТЕ!
MetaTrader Маркет - лучшее место для продажи торговых роботов и технических индикаторов.
Вам необходимо только написать востребованную программу для платформы MetaTrader, красиво оформить и добавить хорошее описание. Мы поможем вам опубликовать продукт в сервисе Маркет, где его могут купить миллионы пользователей MetaTrader. Так что занимайтесь только непосредственно своим делом - пишите программы для автотрейдинга.

Вы упускаете торговые возможности:
- Бесплатные приложения для трейдинга
- 8 000+ сигналов для копирования
- Экономические новости для анализа финансовых рынков
Регистрация
Вход
Вы принимаете политику сайта и условия использования
Если у вас нет учетной записи, зарегистрируйтесь