Guarda i video tutorial del Market su YouTube
Come acquistare un Robot di Trading o un indicatore
Esegui il tuo EA
hosting virtuale
hosting virtuale
Prova un indicatore/robot di trading prima di acquistarlo
Vuoi guadagnare nel Market?
Come presentare un prodotto per venderlo con successo
Nuovi indicatori tecnici per MetaTrader 4 - 101

Necessary for traders: tools and indicators Waves automatically calculate indicators, channel trend trading Perfect trend-wave automatic calculation channel calculation , MT4 Perfect trend-wave automatic calculation channel calculation , MT5 Local Trading copying Easy And Fast Copy , MT4 Easy And Fast Copy , MT5 Local Trading copying For DEMO Easy And Fast Copy , MT4 DEMO Easy And Fast Copy , MT5 DEMO Fibo: from KTrade 1. Automatically calculate and analyze the band. -> Get the desired band 2.
FREE

Necessary for traders: tools and indicators Waves automatically calculate indicators, channel trend trading Perfect trend-wave automatic calculation channel calculation , MT4 Perfect trend-wave automatic calculation channel calculation , MT5 Local Trading copying Easy And Fast Copy , MT4 Easy And Fast Copy , MT5 Local Trading copying For DEMO Easy And Fast Copy , MT4 DEMO Easy And Fast Copy , MT5 DEMO
Can set the cycle for other varieties of K line graph covered this window, fluctuations obser
FREE

Time Range Pivot Points is an indicator that will plot Pivot Point + Support and Resistance levels on the chart, but it will calculate the formula based on a specific time range, that can be defined in the settings. If you want to successfully trade the European and US sessions it will be smart to check all levels generated by the Asian session time range. This indicator will allow you to do that. Everything is designed to get you an advantage of the potential support and resistance levels for t

BeST_ADX Scalping Strategy is an MT4 Strategy of an Entry and Exit Signals Indicator based on the ADX values that is an excellent tool for scalpers to scalp the currency market multiple times a day for profit .
It is built mainly for scalping purposes although it can also be used as a breakout indicator . Its Signals produce a complete and standalone trading system of impressive results . The indicator comes with a new enhanced Real Time Updated Info and Statistics Panel that can improve its ove
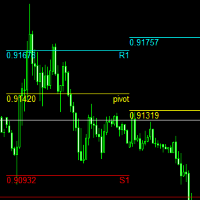
pivot points using by many traders and pivot levels most of the times are very helpfull . this indicator is a custom with internal parameters. it can show two times pivot (weekly and daily). you can choose periods total for each time showing pivots.( 1 week , 2 week ,...1day , 2day ,...) when use weekly and daily pivots , it can show you many support and resistance zones. if have proposal comment too me for upgrading indicator.
FREE
This is a SnR tool.
It is built based on the body candle.
It is a multi timeframe indicator.
There is a powerful scalabar for vertical line slides to limit the candle bars.
Color for each line can also be changed.
It can detect:
1. Support && Resistance
2. Support become Resistance && vice versa
3.Support become Resistance become Support && vice versa
It also can be used for trading tools and studies on SnR *New Version avaiable
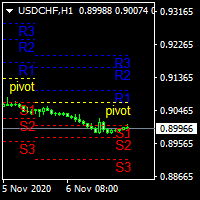
.................................if you need pivot point s levels............................... ............................this is a daily pivot point level creator........................... ...it is for daily pivots and show levels at times period H4 , H1 , M30 , M15 ,M 5... .................................also shows levels for 3 last days.............................. ................can use it with other indicators and see important levels...............
FREE
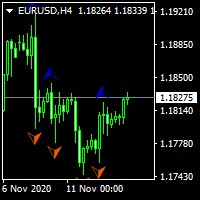
...................................................custom fractal............................................... .................................fractal is very help full to find waves and ............................... ...the defult fractal at meta trader dosent have input parameters and cant find any waves.. .............................................this is fractal with input......................................... ................................................for find any waves.......
FREE
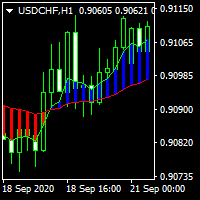
............................................hi................................................ .........................its a simple indicator of movings ............................
.........................a diffrent show of moving averages.......................... ...............can select period , shift , mode and applied price.................. ............many traders use movings for find market movement.................
...........................it can helpfull for finding trends.......
FREE
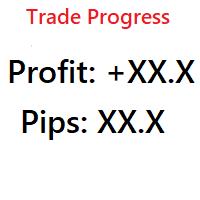
Simple indicator that shows your history in pips and profit. You can use it to follow your progress on the positions. It shows you the trade progress only for the symbol that the indicator is on and only for your trade history. Label text is updated when order is closed. The text can be displayed on each corner, it is in the parameters.
Basic input parameters: Label color Font size Conrner position Anchor position Note: corner and anchor have to be the same position.
FREE
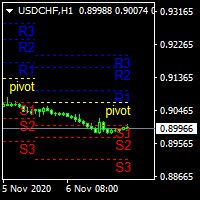
.................................if you need pivot point s levels............................... ............................this is a weekly pivot point level creator........................... ...it is for weekly pivots and show levels at times period d1 , H4 , H1 , M30 ............... .................................also shows levels for 3 last weeks.............................. ................can use it with other indicators and see important levels........
FREE

ATR Moving Average draws a moving average of the standard Average True Range( ATR ) in the same window.
Settings Name Description ATR period
Set Price per iod for ATR calculation
ATR level Set ATR value for thresholding( only whole number, ignore leading zeros e.g. 0.00089 = 89 ) MA Period Set moving Average Period MA Method Set moving average method( Simple, Exponential, Smoothed and Linear Weighted ) MA Shift
Set moving average shift
Enable Alerts ? Generate Alert when ATR Crosses
FREE
Concept:
This indicator will help you find Spike Bar. 1/ Check Yesterday Range (Open-Close ) 2/ Check Today pips: Price from Daily Open to current price (Bid/Ask) Then alert for you when the pips range of current candle is equal to or greater than the user defined minimum range. This indicator is related to Strategy: Daily Range Spike and Pull Back, you can find it on FFX forum
FREE

Positon index is the cyclical index of market trend movement, and Positon's value ranges from 0 to 100. When Positon value is below 10, it means that the market is in extreme decline, the market atmosphere is extremely pessimistic, and the market is about to hit bottom and turn around. When Positon value is above 80, it means that the market is in extreme excitement, the market atmosphere is extremely bullish, the market is about to peak and there is a sharp decline.

How to use this indicator is simple.
Please look on pictures. Please use Pending Limit order only.
Set Pending order according line, with Take Profit and Stop Loss base on line. example1: Put pending order Sell Limit 1 on the line of Sell Limit 1 and Take Profit on Take Profit 1 line, Stop Loss on Stop Loss line...skip... example2: Put pending order Sell Limit 5 on the line of Sell Limit 5 and Take Profit on Take Profit 3,4,5 line, Stop Loss on Stop Loss line.
and do to opposite buy limit ord

This is indicator for checking your trades. Please see the pictures attachment, the indicator show info about: - Breakeven Level; - Margin Call Level; - Two volume info, past and current (With color exchange base on the past volume); - Spreads; - Swap Long and Swap Short (With color change, positive and negative swap); - Running Price; -Today High Low Pips; - Today Open to Current Running Price pips.
This indicator not for trading entry, only to assist your trade management
Regards

This is a very complex indicator that calculates resistance and supportlevels. When the calculation is done, it merges levels that are close to eachother. It support different timeframes, simply by changing timeframe.
Features: See support and resistance levels Alarm can be set off when price enters a support/resistance zone Different timeframes
See screenshots for visual.
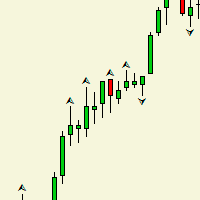
Индикатор рисует на графике фрактал, и в чем отличие между обычным фракталом? спросите вы. Ответ таково,_ после формирования второго бара фрактал рисуется и не удаляется в отличие от обычного. Данный индикатор создан в целях расширения Торгового робота. Она составляет одним из важнейших частью робота. Таким как выход из торгов. У индикатора нет входных параметров.
FREE
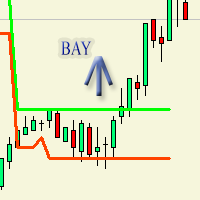
Индикатор изначально предназначался для торгового робота который в дальнейшем опубликуется. Рисует на графике флет. То-есть покой тренда. Очень отчетливо выражает флет по параметрам по умолчанию. flateWigth - допустимая ширина или разница между барами по которому индикатор будет засчитывать флет. Индикатор работает в реальном времени. Для наглядного просмотра работы можно запустить в тестере.
FREE

This is a combination of 3 customized indicators, to make chart clean, we only showing up or down arrows. This gives good result in 1 hour and above time frames. In one hour chart, please set sl around 50 pips. Once price moves into your direction, it would be good to trail your sl by 30 to 50 pips to get more profit as this indicator kinda trend follower. In four hour chart, set ls around 100 pips. Works in all major pairs and winning ration is around 70 % based on back test in mt4.
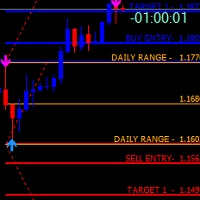
FiboZZ Trade Panel is trade assistants designed for manual trading and include account information panel with automatic drawing of ZigZag Extreme Arrows , Daily Fibonacci Extension with 3 levels for targets. You can use it with the following tow strategies or to use the indicators to create your own strategies. The information panel shows you: -Today and Yesterday Profits, -Balance, -Last Profit, -Last Open Lot Size, -All Open Buy/Sell Position and total lots , -Free Margin Level, -Equity, -24 h

Unexpected Decision is a trend indicator that uses an original calculation algorithm. This is a new product that allows you to identify the current market phase (uptrend, downtrend or flat). The indicator is applicable for any data and periods. The middle of the trend wave, as well as the edges, are places of special heat and market behavior; when writing the indicator, an attempt was made to implement precisely finding the middle. This indicator paints arrows in different colors depending on th

Description
SuperCCI is an indicator based on the standard CCI indicator. It identifies and displays convergences/divergences in the market and forms the corresponding entry points. Also, using the trading channel index, it determines the direction of the trend and displays the levels of support and resistance .
Features Not repaint. Shows entry points. Shows the direction of the current trend and support/resistance levels. Has notifications. Recommendations
Use convergence/divergence to ide

Pattern Trader No Repaint Indicator
MT5 Version of the indicator: https://www.mql5.com/en/market/product/57462 Advanced Chart Patterns Tracker MT4: https://www.mql5.com/en/market/product/68550
I ndicator searches for 123 Pattern, 1234 Pattern, Double Top, Double Bottom Patterns , Head and Shoulders, Inverse Head and Shoulders and ZigZag 1.618 Pattern.
Pattern Trader indicator uses Zig Zag Indicator and Improved Fractals to determine the patterns. Targets and Stop Loss Levels are defined by

The Your Chance indicator studies price action as a collection of price and time vectors, and uses the average vector to determine the direction and strength of the market. It also estimates the market trend based on rough measurements of price movement. This indicator is confirming and can be especially useful for traders looking for price movements. This indicator highlights the direction and strength of the market and can be used to trade price fluctuations.

Necessary for traders: tools and indicators Waves automatically calculate indicators, channel trend trading Perfect trend-wave automatic calculation channel calculation , MT4 Perfect trend-wave automatic calculation channel calculation , MT5 Local Trading copying Easy And Fast Copy , MT4 Easy And Fast Copy , MT5 Local Trading copying For DEMO Easy And Fast Copy , MT4 DEMO Easy And Fast Copy , MT5 DEMO
The homeopathic indicator is also called the CCI indicator. The CCI indicator was proposed
FREE

The indicator is designed for trading binary options on small timeframes up to 15 m Easy to use does not need additional settings and can be used without additional filters Recommendations for trading When a signal appears (blue arrows pointing up), you need to consider the buy direction When a signal appears (the red line indicates the bottom), you need to consider the direction to sell To conclude a deal is on the candle where the signal for one candle came, if the signal turned out to be unpr
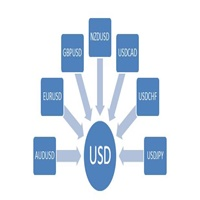
The USDIndex is the USD dollar index, which is integrated for the seven currencies of AUDUSD, EURUSD, GBPUSD, NZDUSD, USDCAD, USDCHF and USDJPY. Through this index, the direction of USD overall trend can be intuitively understood. The USDIndex works better with other indexes in combination. For example, the combination of USDIndex and AUDIndex can directly reflect the trend of currency AUDUSD. It is easy to understand that the currency AUDUSD is split into two indices, one is the USDIndex and
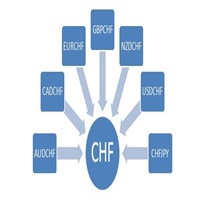
The CHFIndex is the Swiss franc index, which is integrated for the seven currencies of AUDCHF, CADCHF, EURCHF, GBPCHF, NZDCHF, USDCHF and CHFJPY. Through this index, the direction of CHF overall trend can be intuitively understood. The CHFIndex works better with other indexes in combination. For example, the combination of CHFIndex and JPYIndex can directly reflect the trend of currency CHFJPY. It is easy to understand that the currency CHFJPY is split into two indices, one is the CHFIndex an
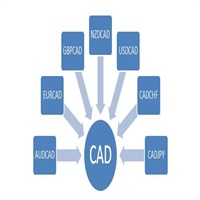
The CADIndex is the Canadian dollar index, which is integrated for the seven currencies of AUDCAD, EURCAD, GBPCAD, NZDCAD, USDCAD, CADCHF and CADJPY. Through this index, the direction of CAD overall trend can be intuitively understood. The CADIndex works better with other indexes in combination. For example, the combination of CADIndex and EURIndex can directly reflect the trend of currency EURCAD. It is easy to understand that the currency EURCAD is split into two indices, one is the CADInde
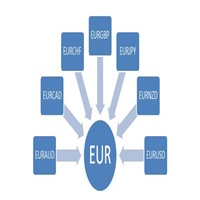
The EURIndex is the Europe dollar index, which is integrated for the seven currencies of EURAUD, EURCAD, EURCHF, EURGBP, EURJPY, EURNZD and EURUSD. Through this index, the direction of EUR overall trend can be intuitively understood. The EURIndex works better with other indexes in combination. For example, the combination of EURIndex and CHFIndex can directly reflect the trend of currency EURCHF. It is easy to understand that the currency EURCHF is split into two indices, one is the EURIndex
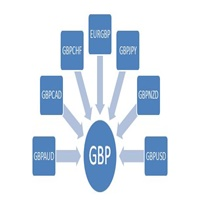
The GBPIndex is the Pound index, which is integrated for the seven currencies of GBPAUD, GBPCAD, GBPCHF, GBPJPY, GBPNZD, GBPUSD and EURGBP. Through this index, the direction of USD overall trend can be intuitively understood. The GBPIndex works better with other indexes in combination. For example, the combination of GBPIndex and NZDIndex can directly reflect the trend of currency GBPNZD. It is easy to understand that the currency GBPNZD is split into two indices, one is the GBPIndex and the
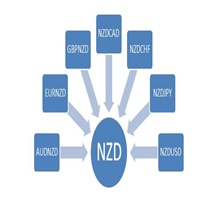
The NZDIndex is the Pound index, which is integrated for the seven currencies of AUDNZD, EURNZD, GBPNZD, NZDCAD, NZDCHF, NZDJPY and NZDUSD. Through this index, the direction of USD overall trend can be intuitively understood. The NZDIndex works better with other indexes in combination. For example, the combination of NZDIndex and GBPIndex can directly reflect the trend of currency GBPNZD. It is easy to understand that the currency GBPNZD is split into two indices, one is the NZDIndex and the

Do you want to see the future lines of the ZigZag indicator? This indicator will help you do that because the indicator model is based on two indicators: Historical Memory and ZigZag. So it can forecast the ZigZag lines. Very useful as an assistant, acts as a key point to forecast the future price movement. The forecast is made using the method of searching the most similar part in the history (pattern) to the current one. The indicator is drawn as a line that shows the result of change o

The Supertrend indicator available on the MQL5 Market for MetaTrader 4 is an exceptional tool for traders seeking to identify prevailing trends in specific trading instruments. This indicator boasts two built-in indicators, Average True Range and Standard Deviation, allowing traders to choose the most suitable indicator based on their preferred trading strategy. Additionally, users can customize the period of these indicators and select the price (Close, High, Low, Open, Weighted) to which it s

Hi. The main obstacle for multi timeframe traders or traders who use multiple indicators on multiple charts is when they want to do analysis on multiple pairs quickly. You can imagine if there are 3 or 10 charts that must be opened when you want to do analysis. and each chart has its own template. of course it will take a long time to replace one by one before analysis. how many opportunities are lost due to the time spent changing charts. or maybe when a mentor wants to explain to his students
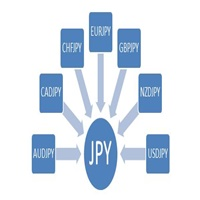
The JPYIndex is the YEN index, which is integrated for the seven currencies of AUDJPY, CADJPY, CHFJPY, EURJPY, GBPJPY, NZDJPY and USDJPY. The JPY Index works better with other indexes in combination. For example, the combination of JPYIndex and AUDIndex can directly reflect the trend of currency AUDJPY. It is easy to understand that the currency AUDJPY is split into two indices, one is the JPYIndex and the other is the AUDIndex. Through the analysis, it can be intuitively found that, in a

FXC iDeM-DivergencE MT4 Indicator
This is an advanced DeMarker indicator that finds trend-turn divergences on the current symbol. The indicator detects divergence between the DeMarker and the price movements as a strong trend-turn pattern.
Main features: Advanced divergence settings
Price based on Close, Open or High/Low prices Give Buy/Sell open signals PUSH notifications
E-mail sending Pop-up alert Customizeable Information panel Input parameters: DeM Period: The Period size of the DeMarker in

Indicator user manual: https://www.mql5.com/en/blogs/post/741402
A moving average is a widely used technical indicator and it often acts as dynamic support or resistance. MA bounce is useful tool based on this technical indicator. It can be used as proximity sensor , so you will get alert when price is near selected moving average. It can be used as bounce indicator as well, and you will get non-repainting BUY/SELL arrows, when there is high probability of a price bounce from
Time your Entry and Exits with Average True Range (ATR) Trailing Stops ATR Trailing Stops are primarily used to protect capital and lock in profits on individual trades but they can also be used, in conjunction with a trend filter, to signal entries. The indicator will help make your calculation of stop loss easier as it will be visually aiding you in choosing where to put your stoploss level on the chart by calculating the current value of ATR indicator. For those who are unfamiliar with ATR, i
FREE

FXC iCCI-DivergencE MT4 Indicator
This is an advanced CCI indicator that finds trend-turn divergences on the current symbol. The indicator detects divergence between the CCI and the price movements as a strong trend-turn pattern.
Main features: Advanced divergence settings
Price based on Close, Open or High/Low prices Give Buy/Sell open signals PUSH notifications
E-mail sending Pop-up alert Customizeable Information panel Input parameters: CCI Period: The Period size of the CCI indicator.
CCI Ap
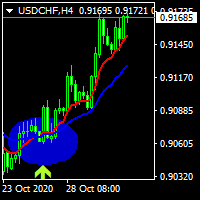
hi dear today i write an indicator of crossing 2 moving averages and show a label for the signals of it . .......................you can select the period of movings and the method of moving............... ......................and also method of apply price and see the movings and signals.................. ................also you can turn off showing movings to see just signal labels.......................... ................................................wish the best for you................
FREE

ITS FREE I Recommend www.CoinexxBroker.com as a great broker and the one I personally use Asia session 1:00 to 9:00 (6pm est to 2 am est) Eur means London Session 10:00 to 18:00 (3 am est to 11 am est) USA means New York Session 15:00 to 23:00 (8 am est to 4 pm est) Session indicator highlights the start of each trading session. You can show all sessions or edit the settings to only show the hours you want highlighted (Asia) means Asian Session ,(Eur) means London Session , (USA) means New
FREE

Time to Trade Trading timing indicator is based on market volatility through 2 ATR indicators to determine the timing of a transaction. The indicator determines the times when the market has strong volatility in trend. When histogram is greater than 0 (blue) is a strong market, when histogram is less than 0 (yellow) is a weak market. Should only trade within histograms greater than 0. Based on the histogram chart, the first histogram value is greater than 0 and the second histogram appears, this
FREE

...................................................................................................................... ............rsi................ ...........................................rsi for times M30 and D1............................................. ...............................almost every one uses rsi at 1 time frame but.............................. ..................................when we have 2times rsi what can see .....
FREE
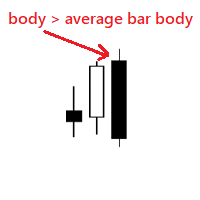
Very simple indicator that shows if body of a new bar is bigger than the average bar body. We can use the indicator to notice bars that are bigger than usual, for example this could mean a new trend. Input params: history bars to display from how many bars to get the average bar body To calculate only bars from the same type distance for the dots bull color bear color dot size
FREE

This is a simple trend indicator. It draws the arrows live and shows when the potential trend starts or ends. It is separated by my indicator for positions on the trend direction Cross MAs Trend Entry , so that you can use it practice with it and get more familiar with my strategies. Note : the indicator does not redraw arrows, it works absolutely live and for every period and simbol ( it is most optimized for M5 )
It has simple input parameters, the default values are optimized for M5 for most

The reason why many traders new to using the Fibonacci retracement tool find it hard to effectively use it is because they are having trouble identifying swing points that are significant enough to be considered.
Main Features Show Fibonacci number with LL to HH in multitimeframe
Show 23.6,38.2,50,61.8,78.6,88.6,100,112.8,127.2,141.4,161.8,200,224,261.8,314,361.8 and 423 of Fibonacci number
Easy to use with simple interface. Real time information for the Fibonacci number .
Settings Global Sett

This gives you many opportunities and gives you beautiful goals in a short time that you can see for yourself and this indicator depends on the foundations and rules of special knowledge It also gives you entry and exit areas with very good and profitable goals This is an indicator that I have been training on for a long time The results were more than impressive

This indicator Super Turbo indicator.Indicator displays trend movement. Indicator calculates automatically line. Features
FiltPer - displays indicator period. Step - displays indicator Step. Trend - displays indicator trend (true/false). X - move the trend left and right.
Y - move the trend up and down.
How to understand the status:
If the Trend color is green, trend is up.
If the Trend color is red, trend is down.
///////////////////////////////////////////////////////////////////////////
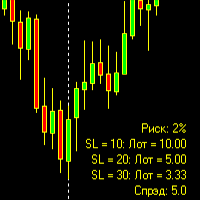
The information panel of the indicator displays the specified number of parameters. Depending on the installed location, information will be displayed in one of the corners. The indicator only displays information without trading on its own. This means, if you need to open a deal, you should look at the information panel, find the line with the SL value and see which lot you want to place.
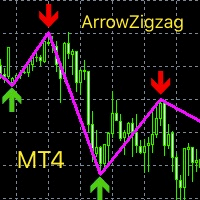
This index is based on the secondary development of zigzag, adding high and low point arrow indication, thickening the line and changing the color. Can be a good display of the current admission trading signals, current long or short. It can be combined with other indicators to determine the trading point, which has great reference value. Compared with the general trend index or oscillation batch standard, the accurate determination is higher from the perspective of historical data research and
FREE

The Multicurrency Trend Detector ( MTD ) indicator allows you to immediately and on one chart on a selected time interval (extending from a zero bar to a bar set in the settings by the value horizon) determine the presence, direction and strength of trends in all major currencies, as well as assess the reliability of these trends. This is achieved by calculating indices (non-relative purchasing power) of eight major currencies, namely: AUD, CAD, CHF, EUR, GBP, JPY, NZ

Trend Analytics is a technical analysis indicator that allows you to determine with sufficient probability when a trend and its direction or flat prevail in the foreign exchange market. The indicator is built on special algorithms. The dignity of which you see in the screenshots. The indicator can work on any timeframe, but to minimize the likelihood of false signals, you should set a timeframe from H15 and higher. In this case, you should use a small stop loss to protect against false signals.
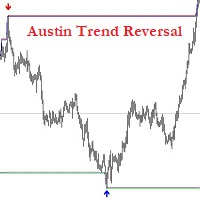
Introducing the Austin Trend Reversal Indicator: Your Key to Identifying Profitable Market Reversals.
The Austin Trend Reversal Indicator is a revolutionary MetaTrader 4 tool designed to provide traders with reliable signals for trend reversals. Powered by advanced techniques and algorithms, this non-repainting indicator offers unparalleled accuracy in pinpointing potential turning points in the market.
Key Features: 1. Non-Repainting Signals: The Austin Trend Reversal Indicator provides non-r

The IndicatorPivot indicator is suitable for using forex trading strategies designed for intraday trading. "IndicatorPivot" displays on the price chart of a currency pair the Pivot level (average price for the current day) and the three closest support and resistance levels, calculated based on Fibonacci levels. The "Indicator Pivot" indicator uses Fibonacci levels to solve the problem of building support and resistance levels in Forex trading. This indicator is very easy to understand and to ap
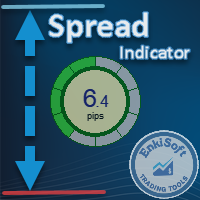
Custom Spread Indicator *Please write a review, thanks!
Also MT5 version is available
Spread Indicator show the current spread in pips with color codes. Handle 3 levels, Low, Medium, High. You can set levels and colors for each level (eg. Low: Green, Medium: Orange, High: Red), and can choose display position on the chart.
There is two spread calculation mode: -> Server spread value -> Ask - Bid value
Can set opacity, for better customization. When spread jump bigger, then display do not
FREE

I present to you an indicator for manual trading on DeMark's trend lines. All significant levels, as well as the indicator signals are stored in the buffers of the indicator, which opens the possibility for full automation of the system. Bars for calculate (0 = unlimited) - Number of bars to search for points DeMark range (bars) - Shoulder size to determine point

------ GOOD LUCK -----
(Telegram: @MagicBinary) The indicator allows you to trade binary options. T his indicator give high winning ratio with over 20 years of backtesting The recommended time frame is М1 and the expiration time is 3, 5 minutes. The indicator suitable for Auto and Manual trading. A possible signal is specified as a arrows above/under a candle. You can entry current candle /intrabar or can wait until candle close Arrows are not re-painted Trade sessions: Any/ Rec

Simple indicator that shows external ( outside ) bars. In certain cases, external bars can be seen as strong trend bars instead of range bars. This can be observed when a with-trend external bar occurs at a reversal from a strong trend. It will help you notice more easily different patterns like - Inside-outside-inside, Inside- Inside -inside, outside - Inside -outside, etc. Works perfectly with my other free indicators Internal bar and Shadows
Inputs: How many history bars to calculate on loa
FREE
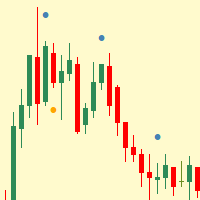
Simple indicator that shows internal (inside) bars.
Internal bars are probably one of the best price action setups to trade Forex with. This is due to the fact that they are a high-chance Forex trading strategy. They provide traders with a nice risk-reward ratio for the simple reason that they require smaller stop-losses compared to other setups. They can also be successfully utilised as reversal signals from key chart levels. Inside bar is a series of bars contained within the range of the co
FREE

The PatternMMB trading indicator finds the most common candlestick analysis patterns and provides trading recommendations based on them. The PatternMMB trading indicator is designed to search for candlestick patterns on the price chart and issue trading recommendations depending on the nature of the found candlestick pattern. It is also possible to send sound notifications when all or any of the selected patterns appear, with an explanation of the pattern and its interpretation. In addition, th

Simple introduction to currency meter indicator : Currency Meter Is Indicator to determine power of each currency and show them in very simple design
This indicator can help you to see power of each currency separately.
As you know when GBPUSD goes up, it means GBP going to more power or USD goes more weak, but you cant understand what is the reason of this movement, it was about GBP ? or it was about USD ?
To determine GBP power , This indicator, will check all pairs contain GBP and determine
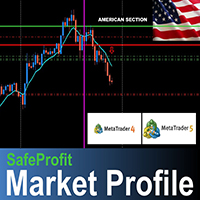
The SafeProfit Market Profile is the most advanced tracking indicator in the Forex Market. It was developed to track the market profile of each session of the day: Asian, European and American. With this indicator you will operate Intraday smiling ... knowing exactly where the Big Players are positioned and the exact moment where they are going to. The indicator is simple, fast and objective, tracking every movement of the Big Players in price. Get out of the 95% statistic that only loses and us

Exclusive Stairs is a trend indicator for the MetaTrader 4 platform. Its operation algorithm is based on moving averages, processed by special filters and price smoothing methods. This allows the Exclusive Stairs to generate signals much earlier than the conventional Moving Average. This indicator is suitable both for scalpers when used on the smaller timeframes and for traders willing to wait for a couple of days to get a good trade. Exclusive Stairs for the MetaTrader 5 terminal : http

This is a professional TrendFact indicator. Knowledge of the entry point of each currency is very important for every trader trading in the forex market. This indicator measures the changes in the trend direction for any currency pair and timeframe, using the built-in authoring algorithm. The strategy for trading on trend, filtering and all the necessary functions are built into one tool! The indicator displays signals in a simple and accessible form in the form of arrows (when to buy and when t

In Out Trend is a trend indicator for working in the Forex market. A feature of the indicator is that it confidently follows the trend, without changing the signal if the price slightly pierces the trend line. The indicator is not redrawn.
In Out Trend - the indicator gives entry signals at the most logical prices after the price pierces the trend line. The indicator works on the basis of mathematical calculations on the price chart. It is one of the most common and useful indicators for findi

Primary Trend is a handy tool if you are used to trading on a clean chart, but sometimes you need to take a look at Primary Trend. The Primary Trend indicator studies price action as a collection of price and time vectors, and uses the average vector to determine the direction and strength of the market. This indicator highlights the short-term direction and strength of the market. The indicator is not redrawn. The indicator implements a breakout strategy. The arrows show the direction of the ma
Hello dear friend! Here's my story. I'm fast. After many attempts to trade manually, I decided to use expert. I started writing my robot. But testing took a lot of time! In parallel, I tried other people's robots. And again I spent a lot of time testing. Night scalpers, news scalpers, intraday scalpers, and many other classes... you needed to know exactly when the robot was trading, when it was making a profit, and when it Was losing. Some robots have time-based trading features that are not de
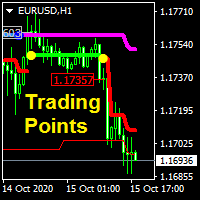
This indicator analyzes price in both current and larger timeframes to generate trendline, trading signals and take profit level. It can work on any financial instruments or securities. Features: Trend line, trend line is a 2 colors scheme thick line, blue line denotes uptrend and pink line for downtrend. Trading line, trading line is a 2 colors scheme thick line, green line denotes buy signal and red line for sell signal. Price label, the label shows the beginning price of new trading signal.
Il MetaTrader Market è il posto migliore per vendere robot di trading e indicatori tecnici.
Basta solo sviluppare un'applicazione per la piattaforma MetaTrader con un design accattivante e una buona descrizione. Ti spiegheremo come pubblicare il tuo prodotto sul Market per metterlo a disposizione di milioni di utenti MetaTrader.
Ti stai perdendo delle opportunità di trading:
- App di trading gratuite
- Oltre 8.000 segnali per il copy trading
- Notizie economiche per esplorare i mercati finanziari
Registrazione
Accedi
Se non hai un account, registrati
Consenti l'uso dei cookie per accedere al sito MQL5.com.
Abilita le impostazioni necessarie nel browser, altrimenti non sarà possibile accedere.