• Visão global
  • Comentários
  • Discussão
  • O que há de novo

WAPV Full MT5

## Se você não conseguir utilizar a versão demo , por favor entrar em contato por mensagem.

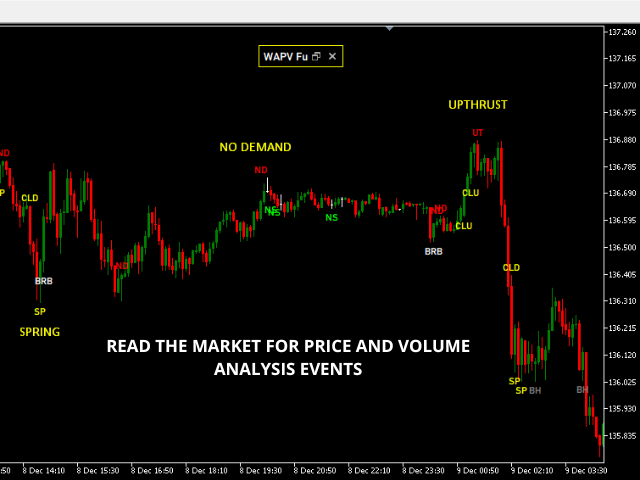
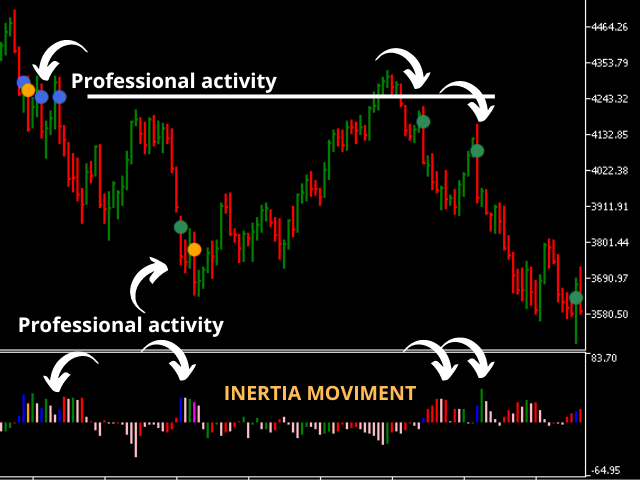
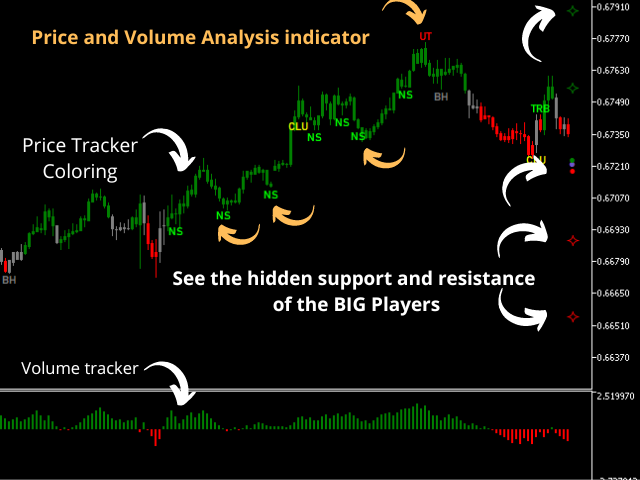
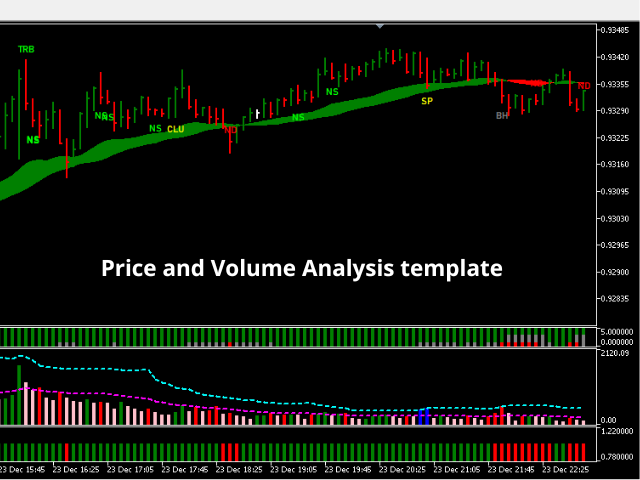
## Opere de forma Profissional utilizando o WAPV Full e consiga rastrear

aonde esta o dinheiro dos Grandes Players

Funciona em qualquer Mercado que tenha Preço e Volume, FUTUROS, FOREX, CRIPTOS, AÇÕES, CFDS...

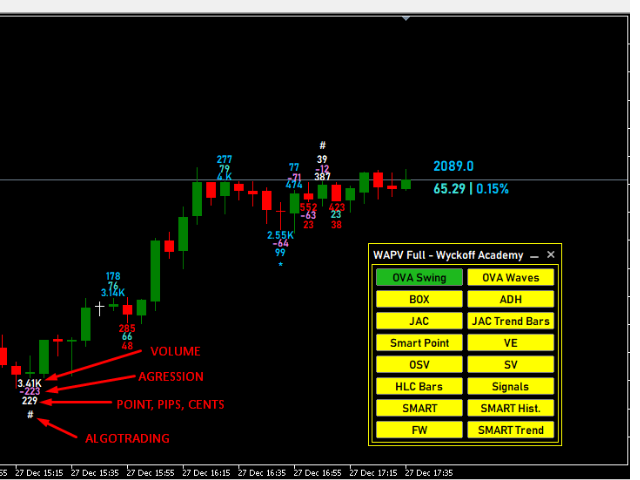
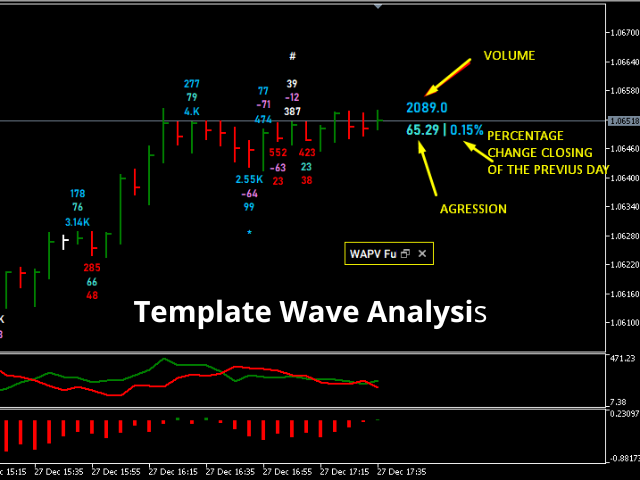
Imagine você ter em suas mão uma ferramenta que sozinha faz a leitura dos grandes Players do Mercado, mostrando as melhores regiões de negociação
com base da análise de Preço e Volume.

O WAPV Full é um ferramenta completa, 100% focada no operacional de R. Wyckoff
Ela além de mapear a movimentação do mercado em ondas de negociação, ela também mapeia o Mercado através da leitura de Preço e Volume.

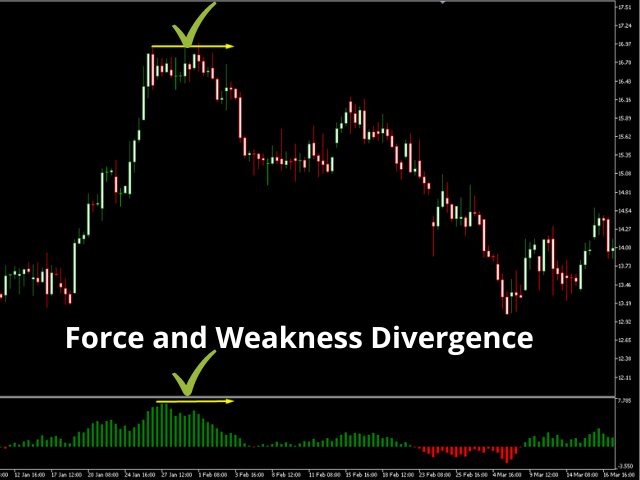
O Mercado Profissional opera com base nas 3 leis de R. Wyckoff


# Causa e Efeito

# Oferta e Demanda 

# Esforço x Resultado


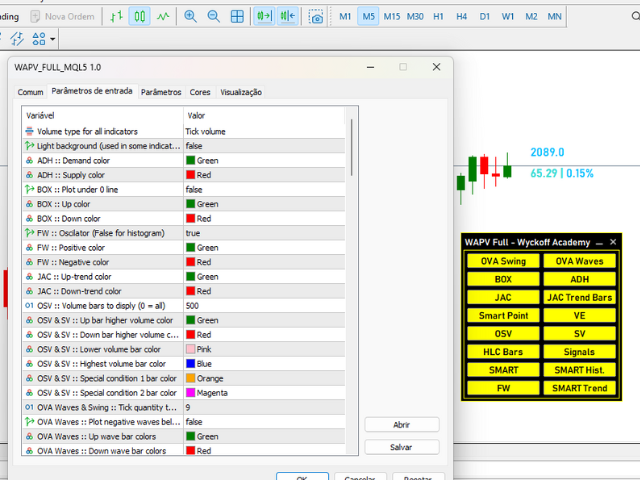
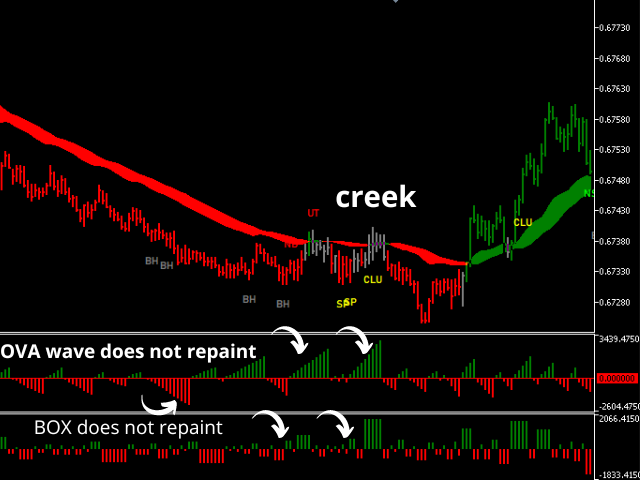
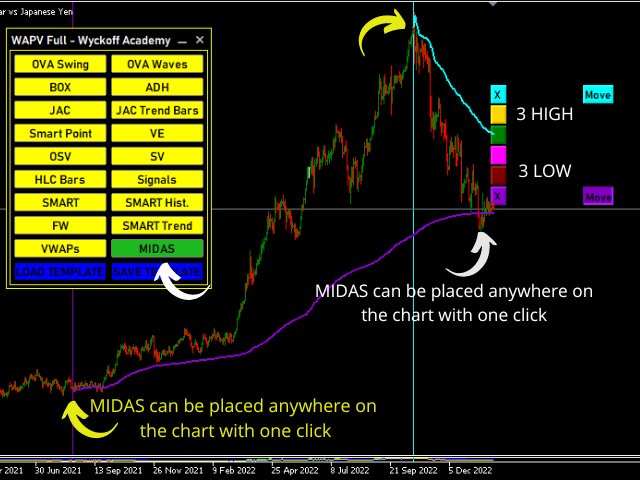
Tudo isso é entregue no WAPV Full, ele te da 16 ferramentas fundamentais 
para você analisar o mercado de forma profissional e consequentemente

melhorar seus resultados.

#Além da Ferramenta WAPV_FULL é  enviado por email um 


Manual de Instruções de 

utilização das ferramentas com as estratégias e um pacote de vídeos 

para auxiliar na melhor utilização dos indicadores.

Veja as imagens e ao vídeo para entender o que estou falando.


Produtos recomendados
Este indicador é baseado na transformada discreta de Hartley. O uso dessa transformação permite aplicar diferentes abordagens ao processar séries temporais financeiras. Uma característica distintiva deste indicador é que suas leituras não se referem a um ponto no gráfico, mas a todos os pontos do período do indicador. Ao processar uma série temporal, o indicador permite selecionar vários elementos da série temporal. A primeira possibilidade de filtragem baseia-se nesta abordagem - todos os comp
120 USD
This z-score indicator shows the correct z-score of an asset, as it uses the normalized price data for calculation, which is the only correct way. Z-score is only applicable for normal distributed data, therefore not the actual price is considered, but the normalised returns, which were assumed to follow a normal distribution. Returns are mean reverting and assumed to follow a normal distribution, therefore z-score calculation of returns is more reliable than z-score on price, as price is NOT m
99 USD
My Trendline
Ashok Kumar Singha
My Trendline is an Indicator based on Upper and Lower Trendline which will Plot Automatically into the Chart. This Indicator will perfectly indicate you the Trend of the Market. It can be use in any Time Frame. The Indicator will automatically adjust according to the Current Time Frame. Steps to Setup the Indicator: Install the Custom Indicator; Set all the Inputs, Line Color, Width and Styles etc. (Can use the Default Setting also); Set visualization to All Timeframe; and DONE It ca
499 USD
Limitless MT5
Dmitriy Kashevich
Limitless MT5 is a universal indicator suitable for every beginner and experienced trader. works on all currency pairs, cryptocurrencies, raw stocks Limitless MT5 - already configured and does not require additional configuration And now the main thing Why Limitless MT5? 1 complete lack of redrawing 2 two years of testing by the best specialists in trading 3 the accuracy of correct signals exceeds 80% 4 performed well in trading during news releases Trading rules 1 buy signa
1 399 USD
TPO Profile MT5
Kyra Nickaline Watson-gordon
Definition : TPO is a Time Price Opportunity. Instead of using bars or candles with an Open, High, Low, and Close price, each "bar" in a Market Profile is represented by horizontal bars against the price It is called Market Profile terminology. In other words time-price-opportunity (TPO) profiles are histograms of how much time was spent at each price within the span of the profile. By using a TPO chart, you are able to analyze the amount of trading activity, based on time, for each price leve
60 USD
Frankenstein
Aleksei Grebenkin
Multifunctional universal trading system . Suitable for all Forex and Crypto markets. ----   Frankenstein.ex5 [GUI VERSION], provides with graphical interface for TS_DayTrader Trading System. Features an extensive array of tools for manual and automated trading. For optimization capabilities, see Frank.ex5 [VERSION FOR OPTIMIZATION] - version for the MT5 Tester. Both Frankenstein.ex5 and Frank.ex5 have automatic trading capabilities. Parameters(.set files) for Frank.ex5 and Frankenst
1 000 USD
Urgently mt5
Tatiana Savkevych
The Urgently indicator is designed to quickly determine the situation in the market, reflect the state of the market and signal profitable levels for opening trades. Market conditions change quickly enough, requiring constant calibration of trading strategies. Recommended for use in conjunction with any of the oscillators. The Urgently forex market trend indicator shows the trend direction and entry points. It smooths out price fluctuations when generating a signal by averaging the data and the
66 USD
The   Visual Volatility Clustering   indicator clusters the market based on volatility. The indicator does not redraw and gives accurate data, does not use closing prices. Uses the opening prices or the highs or lows of the previous completed bar. Therefore, all information will be clear and unambiguous. The essence of the indicator is to divide the price market into certain areas according to a similar type of volatility. This can be done in any way. In this example, the indicator is configure
109 USD
BoxChart MT5
Evgeny Shevtsov
5 (6)
The market is unfair if only because 10% of participants manage 90% of funds. An ordinary trader has slim changes to stand against these "vultures". This problem can be solved. You just need to be among these 10%, learn to predict their intentions and move with them. Volume is the only preemptive factor that faultlessly works on any timeframe and symbol. First, the volume appears and is accumulated, and only then the price moves. The price moves from one volume to another. Areas of volume accumu
33 USD
Reverse side scalper is the manual trading system, that works on choppy(anti-trend) market. As a rule markets are on 80% choppy and only 20% is trend phase. System is based on custom step Moving and RSI and reverse pattern. System defines up movement, down movement, trend / choppy phases. Indicator plots Buy signal arrow when current direction is down and phase is trend, Sell signal arrow is plotted when currently is up movement and phase is trend. As a rule it allows to "catch" local maximum/mi
199 USD
Volume Profile MT5
Mihails Babuskins
5 (2)
Contact me after the purchase to send you the guide file and add you in "Volume Profile Group", share your experiences with other users. Volume Profile FR(Fixed Range) supply and demand This is the full version of the indicator, to test please download the   demo version here   (It's free on BTCUSD or EURAUD charts) Using volume as a fundamental parameter in the analysis is very common.  A typical volume indicator works on a time axis. With it you can determine the volume of each candle, bu
39 USD
O indicador cria cotações atuais, que podem ser comparadas com as históricas e, com base nisso, fazer uma previsão do movimento dos preços. O indicador possui um campo de texto para navegação rápida até a data desejada. Opções: Símbolo - seleção do símbolo que o indicador exibirá; SymbolPeriod - seleção do período do qual o indicador coletará dados; IndicatorColor - cor do indicador; HorisontalShift - deslocamento das cotações desenhadas pelo indicador pelo número especificado de
55 USD
Pip Collector mt5
Manuel Rodriguez Fernandez
EA   based on collecting few pips   for each trade.  Provided with several exit systems, such as positive equity exit (parameterizable) or positive profit exit. Use the martingale system to facilitate the exit. Pip Collector mt4 ==> Operations Configuration <== Tamaño de lote inicial   → Initial lot size→ Initial opening lot per trade. Take Profit  → Take profit in pips Spread máximo   → Maximum Spread→ Maximum Spread filter. It is recommended to delimit this value as much as possible, placing
97 USD
Win43 Scalper
Eadvisors Software Inc.
O novo s43 Scalper para Mini-Índice (WIN-IND) faz operações de curto prazo no timeframe 1min buscando pequenas variações do mercado, utiliza nova tecnologia de trade, os resultados no intraday são íncríveis, confira:      Após a instalação adicione no gráfico dos instrumentos win para visualizar os resultados no backteste. Recomendamos o timeframe de 1min.
200 USD
Sam TrendBlaster for MT5
AKILA THILINDA JAYARATHNA RANASINGHEGE
3.5 (2)
***** This is an indicator for MT5 providing accurate arrow signals without repainting. ***** Trade With Sam Simple Strategy Guide :  https://www.mql5.com/en/blogs/post/740855 MT4 version of the indicator Try Out and see the Difference The Sam's Trend Blaster indicator tracks the market trend with an unmatched reliability, by ignoring sudden fluctuations and market noise. It has been designed to trend-trade intraday charts and small timeframes. Its winning ratio is around 85%. This is a
144 USD
Trigger Cash
Felipe Correa Carneiro
Gatilhos   são regras de negócios que você define para execução imediata após a criação ou atualização dos tickets.  Este programa indica ao usuário quando um gatilho de reversão de tendência é acionado.  Este programa me gerou bastante conforto em meus trades no mini índice.  Faça o back-teste gratuito!! Desde já muito obrigado pela sua atenção! TIP: And try together RSI (13)(9) !!! ;)
233 USD
FabFlowInPrice
Fabiano Luiz Roberto
Tape Reading, monitoramento de fluxo. FabFlowInPrice é um poderoso indicador para quem gosta de Tape Reading (Times & Trades). Ele apresenta os volumes negociados em cada nível de preço, considerando para cada nível as agressões de compra, de venda e dos diretos. Excelente ferramenta para análise do fluxo de mercado. Pensou em fluxo então monitore quem está agredindo mais, compradores, vendedores ou trocas diretas. O indicador apresenta as informações em 4 períodos distintos e fixos, em qualq
150 USD
A Market Profile (time price opportunity) implementation with an option to mark a point of control (POC) based on   volume   . Config: Hide default candles. Select a session time using exchange timezone. Experiment with tick multiplier value to achieve desired level of detail. Choose the symbols of your choice, e.g. squares or A-Z chars. For multiple sessions you will have to add additional instances of this script with a different time configuration. Limitations: TradingView has a hard
499 USD
This indicator has been developed to identify and display these trends quickly and easily, allowing you to see instantly, those currency pairs which are trending, and those which are not – and in all timeframes, with just one click. The 28 currency pairs are displayed as a fan as they sweep from strong to weak and back again, and this is why we call it the ‘currency array’. All 28 pairs are arrayed before you, giving an instant visual description of those pairs that are trending strongly, those
197 USD
Introducing RSIScalperPro - the revolutionary RSI-based indicator for Metatrader 5, specifically designed for scalping in the one-minute chart. With RSIScalperPro, you'll have a powerful toolkit for precise entry and exit signals to take your trading to the next level. RSIScalperPro utilizes two different RSI indicators that provide clear signals for overbought and oversold areas. You can customize the time periods and limit values of the two RSIs according to your preferences to achieve the be
30 USD
The Rainbow Multiple Moving Average (MMA) is a technical analysis tool used to identify trends and potential reversal points in financial markets. It is based on a system of moving averages that are designed to be used together, with each moving average having a different time frame. The Rainbow MMA consists of multiple exponential moving averages (EMAs) of different lengths, with each EMA plotted in a different color. Typically, the Rainbow MMA includes EMAs of 2, 3, 4, 5, 6, 7, 8, 9, 10, 11, a
199 USD
General Description In the simplest terms this is a contrarian intra-day scalping system. Built to try and let correct trades run as far as possible and flip the trade when indicated. The indicator looks at historical daily trading ranges to lay out levels at which it takes long and short positions based on the statistical levels. The indicator is built around index futures, mainly around S&P and the DOW but can be used an any futures contract mainly using AMP Futures to trade. The indicator is
250 USD
The idea of a Value Chart indicator was presented in the very good book I read back in 2020 , " Dynamic Trading Indicators: Winning with Value Charts and Price Action Profile ", from the authors Mark Helweg and David Stendahl. The idea is simple and the result is pure genius: Present candlestick Price analysis in a detrended way! HOW TO READ THIS INDICATOR Look for Overbought and Oversold levels. Of course, you will need to test the settings a lot to find the "correct" one for your approach.
FREE
Market Profile defines a number of day types that can help the trader to determine market behaviour. A key feature is the Value Area, representing the range of price action where 70% of trading took place. Understanding the Value Area can give traders valuable insight into market direction and establish the higher odds trade. It is an excellent addition to any system you may be using. Blahtech Limited presents their Market Profile indicator for the MetaTrader community. Inspired by Jim Dalton’s
99 USD
Before installing the HeatMap indicator make sure you are using a broker that gives you access to the Depth of market (DOM) !! This indicator creates a heatmap on your chart allowing you to see the buy or sell limit orders easily and in real time. You have the possibility to change the setting and the colors of the HeatMap in order to adapt to all markets and all charts. Here is an example of a setting you can use with the NASDAQ100 on the AMPGlobal broker :  https://www.youtube.com/watch?v=x0
80 USD
XCalper HiLo Activator
Aecio de Feo Flora Neto
HiLo Activator v1.02 by xCalper The HiLo Activator is similar to moving average of previous highs and lows. It is a trend-following indicator used to display market’s direction of movement. The indicator is responsible for entry signals and also helps determine stop-loss levels. The HiLo Activator was first introduced by Robert Krausz in the Feb. 1998 issue of Stocks & Commodities Magazine.
30 USD
Supply and Demand Indicator + FREE Currency Strength Meter ADD-ON Looking for a powerful tool that can help you identify the most reactive zones in the forex market? Our supply and demand indicator for MetaTrader 4 and 5 is exactly what you need. With its advanced algorithms and real-time analysis, this indicator helps traders of all experience levels make informed trading decisions. The supply and demand indicator is a cutting-edge tool that helps traders identify areas where buyers and sellers
30 USD
Setup Double 7s
Luigi Nunes Labigalini
Sinais de entrada e saída da Estratégia Duplo 7 de Larry Connors em seu livro "Estratégias Operacionais de Curto Prazo Que Funcionam". Larry alega que esta estratégia previu a direção do mercado mais de 80% do tempo desde 1995. Lucrando sem se expor ao mercado em mais de 25% do tempo. Ótima para swing trade em gráfico diário do SPY, Nasdaq, FXI da China, EWZ do Brasil (IBOV dolarizado) e a maioria dos ETFs e índices do mundo. Como o indicador funciona? O indicador plota o sinal de compra qu
99 USD
CoioteChart
Alexandre Moraes De Souza Lima
O Indicador CoioteChart foi construído pra facilitar desde a leitura de contexto de mercado até a micro estrutura do candle, facilitando ajustes operacionais e tomadas e decisão com alta eficácia. Possui um controle para habilitar e desabilitar a visualização das pocs, vwap, zonas de máxima e mínima negociação, pode ser utilizado data sources de tempos gráficos para cálculos ou utilizado os ticks de agressão do time and trades, funciona com volume real e volume de ticks. As colorações são at
60 USD
Session Control session indicator. Depending on from which continent the trading activity takes place in a certain period, the entire daily routine is divided into several trading sessions. Due to the fact that at each separate time interval exchange and banking platforms from different parts of the world are connected to the trading process, and the Forex market operates around the clock. There are 4 main trading sessions: Pacific. European. American. Asian. This indicator allows you t
49 USD
Os compradores deste produto também adquirem
Este é sem dúvida o indicador de reconhecimento automático de formação de preço harmônico mais completo que você pode encontrar para a MetaTrader Platform. Ele detecta 19 padrões diferentes, leva as projeções de Fibonacci tão a sério quanto você, exibe a Zona de Reversão Potencial (PRZ) e encontra níveis adequados de stop loss e take-profit. [ Guia de instalação | Guia de atualização | Solução de problemas | FAQ | Todos os produtos ] Detecta 19 formações harmônicas de preços diferentes Tr
249 USD
IVISTscalp5
Vadym Zhukovskyi
Apresentamos a você o indicador iVISTscalp5, que não é apenas único, mas também eficaz em operações de negociação. Este indicador é baseado em dados de tempo e é o resultado de muitos anos de experiência e análise aprofundada dos mercados financeiros. O indicador iVISTscalp5 é uma excelente ferramenta para negociação manual. Conveniência, simplicidade e visualização - toda a complexidade está escondida dentro dele. Simplificamos as configurações e o uso do indicador iVISTscalp5 ao máximo. O indi
500 USD
ToolBox 360 is the swiss knife of all indicators. It is full packed with useful tools to help you with your trading. It can be used to find best entry and exit points and help you to decide if you should open a trade or not. It shows market trends, candlestick formations outside / inside bars and you can sett time based allerts. Main features: Time based Fibonacci lines Choose a start and end time and the indicator shows you Fibonacci lines within the selected time range including range high
399 USD
Introduction to EFW Analytics EFW Analytics was designed to accomplish the statement "We trade because there are regularities in the financial market". EFW Analytics is a set of tools designed to maximize your trading performance by capturing the repeating fractal geometry, known as the fifth regularity in the financial market. The functionality of EFW Analytics consists of three parts. Firstly, Equilibrium Fractal Wave Index is an exploratory tool to support your trading logic to choose which r
200 USD
Introduction to X3 Chart Pattern Scanner X3 Cherart Pattern Scanner is the non-repainting and non-lagging indicator detecting X3 chart patterns including Harmonic pattern, Elliott Wave pattern, X3 patterns, and Japanese Candlestick patterns. Historical patterns match with signal patterns. Hence, you can readily develop the solid trading strategy in your chart. More importantly, this superb pattern scanner can detect the optimal pattern of its kind. In addition, you can switch on and off individu
250 USD
VTrende Pro
Andrey Dyachenko
VTrende Pro - MTF indicator for trend trading with a display panel for MT5 *** Videos can be translated into any language using subtitles (video language - Russian) Although the signals of the VTrende Pro indicator can be used as signals of a full-fledged trading system, it is recommended to use them in conjunction with the Bill Williams TS. VTrende Pro is an extended version of the VTrende indicator. Difference between Pro version and VTrende: - Time zones - Signal V - signal 1-2 waves
697 USD
Elliott Wave Trend was designed for the scientific wave counting. This tool focuses to get rid of the vagueness of the classic Elliott Wave Counting using the guideline from the template and pattern approach. In doing so, firstly Elliott Wave Trend offers the template for your wave counting. Secondly, it offers Wave Structural Score to assist to identify accurate wave formation. It offers both impulse wave Structural Score and corrective wave Structure Score. Structural Score is the rating to sh
200 USD
Please send me Direct message on MQL5 CHAT after purchasing the Indicator for Training and Installation Support There are some additional files that is important to use with the Indicator . So be sure to contact me after purchasing the Indicator So that I can add you for training and support . If you find any difficulty with installation then send me Direct message here So that I can connect with you via Anydesk or Teamview for the product installation. " Smart Order Block Indicator " to find
249 USD
Mystery Signal
Cristian Mihail Pauna
Mystery Signal is a reliable trading signal based on pure price action and filtered with Relative Momentum and Relative Cyclicality. If you love simple charts, Mystery Signal is fitting your needs and it is providing efficient entries for any market and any timeframe. There are more than 20 years of work behind this indicator, and it was tested with good results on M15, H1, H4, and D1 timeframes. Mystery Signal confirmed by Order Blocks is giving us good leverage. A stable  Risk and Capital M
500 USD
Big promotion! , prices are now on discount , get your copy now  The   Rubdfx Price Tracker   that is used to show price price bound , the price almost never goes out of the channel and most of the time price will react when it touches the channel limits .It determines the best highest and lowest prices at which you can sell and buy respectively Suitable for scalping & swing trading It Draws arrows that appear after a candle close , The arrows indicate bullish or bearish pressure For bearish an
499 USD
Offer 249 down from 350 for the next 3 copies. then back to 350 $ Are you tired of using outdated indicators that leave you guessing where to set your profit targets? Look no further than the AK CAP Opening Range Breakout Indicator. This powerful tool is backed by a US patent and has already helped countless traders pass funded challenges like FTMO. We use it daily on our prop traders and internal funds, and now it's available to you as well. The calculation behind the indicator is incredibly
249 USD
This is my own modified version of the RMI indicator. Its one of the best indicators i've found to take small profits from the market and i've been able to make it slightly better by modifying and fine tuning some parts Default settings works best for M1 timeframe The Relative Momentum Index calculates a ratio of upwards changes to downwards changes in prices over N-period bars. The RMI values range between 0 and 100. 30 and 70 are the two levels of oversold and overbought market conditions re
500 USD
Buy and Sell Alerts when price breaks out following strict price action. Sends Alerts – #On MT5 To Your Phone To Your Email Does not repaint . Works on any Forex pair, any timeframe. 10 Activations allowed so you are free from limitations >> MT4 Version Here Description When the indicator detects a possible trade, it sends you an alert. It shows you where to place your trade and even suggests Stop Loss and Take Profits for you. How To Trade With The Breakout Entry Signals Indicator
297 USD
Incinerat8
Paulos Ngwenya
This algorithm uses real time data to generate signals with an accuracy rate of 80%. It shows entries and where you should place both the stoploss and the take profit for each trade. It determines trend! It can even help you to become a signal provider! And it can generate up to 8 signals a day! You get access to a free forex trading community  Operates on any broker compatible to synthetic indices and forex   if you need any assistance whatsapp +2774 35 35 744 or telegram link @pipsempire01
400 USD
God win spike system
Israr Hussain Shah
1 (1)
• Non Repaint • DelayNo Lag •Pop Up notification • 98% Verified Accuracy • Real time arrows to catch spikes at least 4-8 bars We forward guide video how milk spikes  We also add in telegram group for better quality help  +see live trading results  https://youtu.be/DCG4CAWlg4I you will see an arrow signal and open trade for spike stop-loss of trade will be 8 or 10 candles if no spike exit you just need to follow spike arrow signals and for more good results follow inst
200 USD
Adaptive Cyclicality
Cristian Mihail Pauna
The Adaptive Cyclicality indicator defines the cycles of any price evolution. This indicator is computed by applying the "Cyclicality" mathematical transformation to the Adaptive Moving Average function introduced by Perry J. Kaufmann. The Adaptive Cyclicality defines very good entry and exit trading signals near the minimal and maximal points. It is a very accurate indicator that can be used on any market and any timeframe. The Adaptive Cyclicality indicator can be used to generate automated en
600 USD
Weis Wave with Alert MT5
Trade The Volume Waves Single Member P.C.
4.93 (14)
Rental Package Options and Privilages  * For optimum results the yearly package is suggested due to live training and Discord  channel trading with the  creator! Rent Monthly Six Months   Yearly Weis Wave with Speed with Alert+Speed Index x x x Manual  x x x Quick Set up Video x x x Blog x x x Lifetime Updates x x x Setup and Training Material x x Free Rectangle Break Alert Tool      x Discord Access Channel "The SI traders" x 2-hour live methodology training x ** NEW PLUTUS SIGN
379 USD
Seconds Charts
Aleksandr Goryachev
Micro  ******************* Секундные графики MT5 ********************** Более точного инструмента для входа в сделку вы не найдёте. Входные параметры: Timeframe, sek - период построения графика, секунды Displayed bars - отображаемые бары Step of price levels, pp, 0-off - шаг отрисовки ценовых уровней, пункты Scale points per bar, 0-off - масштаб в пунктах на бар Show lines - отображение текущих уровней Show comment - отображение комментария Standard color scheme - стандартная цветовая сх
1 500 USD
Prices move for many reasons and these can vary from one operator to another: software, private and institutional traders simultaneously contribute to the formation of the price, making predictive art very difficult. However, there are measurable factors that bind the price to an underlying trend in line with the physical reality that the financial asset represents: these are the macroeconomic indicators. Large investors use this information wisely to set their strategies. Understanding these m
249 USD
AO unpaid divergences
Diego Arribas Lopez
5 (1)
[ How to use the Demo version ] [ MT4 Version ] AO unpaid divergences MT5 AO unpaid divergences is the first indicator developed to detailed analyze Regular and Hidden Divergences. It uses this analysis to find out possible entry points and targets. Below some of the characteristics of this indicator:  Time saving Highly customizable Working for all pairs (Crypto, Forex, Stocks, Indices, Commodities...) Suitable for Scalping or Swing trading Possible reversal swings Alerts and Notifications on M
224 USD
Relative Cyclicality
Cristian Mihail Pauna
The Relative Cyclicality indicator defines the cycles of any price evolution. This indicator is computed by applying the "Cyclicality" mathematical transformation to the classic Relative Strength Index indicator made by J. Welles Wilder. The Relative Cyclicality defines very good entry and exit trading signals near the minimal and maximal points. It is better than RSI itself due to the unicity of the minimal and maximal points on a specific time interval. The Relative Cyclicality indicator can b
600 USD
Price Cyclicality MT5
Cristian Mihail Pauna
The Price Cyclicality indicator defines the cycles of any price evolution. It shows clearly the ascending and descending intervals with asymptotic evolution near the minimal and maximal price values. The Price Cyclicality indicator can be used to generate automated entry signals near the minimal price values. Also, the Price Cyclicality indicator can be used to define limit conditions to generate automated exit signals near the maximal price values. The efficiency of this indicator was proved du
400 USD
Robos
Namu Makwembo
5 (1)
Big promotion on the Robos, Get yours now Robos Indicator The   ROBOS   indicator is a multi timeframe oscillator that targets the   overbought   and   oversold  regions of a price chart, a signal is indicated by the two lines crossing, compatible with all tradable instruments Latest Release The latest release is the version 4.0 #What's new in version 4.0 ? Features Extreme oversold and overbought levels ROBOS version  4.0  comes with cool new feature , the ability to target on
499 USD
MT4 Version   Kill Zones   SMT Divergences Order Blocks ICT Multi TF The Order Blocks ICT Multi TF indicator is a cutting-edge tool designed to help traders make better trading decisions based on order block analysis. Order blocks are key levels on a price chart where large institutional traders placed their orders. These levels tend to act as strong support or resistance zones and often signal a potential reversal or continuation of a trend. By identifying these order blocks, traders can gain
224 USD
Introduction Excessive Momentum Indicator is the momentum indicator to measure the excessive momentum directly from raw price series. Hence, this is an extended price action and pattern trading. Excessive Momentum Indicator was originally developed by Young Ho Seo. This indicator demonstrates the concept of Equilibrium Fractal Wave and Practical Application at the same time. Excessive Momentum detects the market anomaly. Excessive momentum will give us a lot of clue about potential reversal and
200 USD
Sends Alerts – On MT5 To Your Phone To Your Email Does not repaint . Works on any Forex pair, any timeframe. 10 Activations allowed so you are free from limitations >> MT4 Version Here What Is An Order Block? An Order Block  (or Banker Candle, or Institutional Candle)  is an opportunity to get very high risk to reward trades (often 5:1 or more) but you have to know how to trade them. >>>> Please see my video below on how to maximise the winners. An Order Block is formed when the banks
297 USD
Marks Market Imbalance On The Chart As traders continue to search for the best trading indicators to guide their investments, the I mbalance / I mproper P rice A ction / F air V alue G ap I ndicator has become increasingly popular. This indicator helps to identify opportunities for taking profit . The indicator begins by scanning the markets for imbalance-improper price action events, allowing traders to immediately see when markets are not functioning efficiently. In particular, the indicator f
297 USD
Buy And Sell Signal Arrows On The Chart When The Price Is About To Reverse. Also Sends Alerts –On MT5 To Your Phone To Your Email. Does not repaint. Works on any pair, any timeframe.   (Just ajust the settings for your pair and timeframe.) 10 Activations allowed so you are free from limitations MT4 version here .   What is Price Rejection and Reversal and why is it important to you? If price shows certain signs of rejection e.g. a large wick, this often means that it will then re
297 USD
Fibonacci Suavizado
Cesar Juan Flores Navarro
Indicador en MQL5, que obtiene el promedio de 10 EMAS, que son alineadas según Fibonacci, obteniendo un promedio, que sera suavizado.  Se puede ingresar un numero desde 2 a N, que multiplica a los EMA-Fibonacci. Funciona en cualquier criptomoneda, etc. etc... pudiendo calcular el futuro segun la tendencia de las EMAS. Funciona excelentemente en tramos largos, determinando exactamente el mejor inicio/salida. El precio inicial por apertura sera por un periodo de tiempo, luego aumentará.
1 000 USD
SYSTEM INTRODUCTION:   The Binary Options Conqueror System Is Specifically Designed For Binary Options Trading. Unlike Other Systems And Indicators That Were Adopted From Other Trading Environments For Binary Options. Little Wonder Why Many Of Such Systems Fail To Make Money . Many End Up Loosing Money For Their Users.     Forward Testing Of The System Has Shown Remarkable Results . The Results Of Forward Testing On Live Trading Account Is Consistent With The Results Obtained By Back Testing .
240 USD
Mais do autor
Force and Weakness Trading
Eduardo Da Costa Custodio Santos
O Indicador Force and Weakness para MT5 Forex   faz parte do conjunto de Ferramentas do (Wyckoff Academy Preço e Volume) O Indicador Force and Weakness para MT5 Forex  foi desenvolvido para identificar Forca e Fraqueza de volume de forma acumulada. Possibilitando a visão de um panorama entre preço e volume. O Indicador pode ser utilizado como oscilador e como histograma. Como de costume ele tem todas as premissas das três leis de R. Wyckoff quando  colocado junto ao preço: Causa e Efeit
40 USD
HLC bar MT5 Wyckoff
Eduardo Da Costa Custodio Santos
O indicador "HLC_bar_MT5 Wyckoff" para MT5 foi criado para facilitar a análise na hora da negociação. A Barra HLC foi utilizada por Richard Wyckoff e atualmente muito utilizada nas operações de "VSA". Wyckoff descobriu que a utilização da Máxima, mínima e fechamento deixava o gráfico muito mais limpo e fácil de ser analisado. O Indicador "HLC_bar_MT5 Wyckoff" permite: # Alterar a largura da barra; # Deixar a barra da mesma cor; # E destacar a barra que abriu e fechou no mesmo preço.
30 USD
WA Order Block FVG bos MT5
Eduardo Da Costa Custodio Santos
O  WA Order Block FVG bos MT5  é um indicador com base no estudo de SMC (Smart Money Concepts) criado pelo ICT Inner Circle Trader, eleplota no seu gráfico as informações de Order Blocks em 3 tempos gráficos diferentes, fair Value Gaps e Regiões de Liquidez além do BOS ( Break os Structures), tudo em um só indicador. Dessa forma você não precisa colocar essas informações de forma manual. Agora você tem tudo isso de forma automática em seu gráfico.
55 USD
Weis Wave Double Side
Eduardo Da Costa Custodio Santos
O Indicador Weis Wave Bouble Side para o MT5 faz parte do conjunto de ferramentas (Wyckoff Academy Wave Market) O Indicador Weis Wave Bouble side para o MT5 foi criado com base no já consagrado  Weis Wave criado por David Weis. O indicador Weis Wave Double Side faz a leitura do Mercado em ondas como era feito por R. Wyckoff em 1900. Ele Ajuda na identificação de esforço x resultado, causa e efeito, e Oferta e demanda O seu diferencial é que ele pode ser utilizado abaixo do eixo zero, me
30 USD
Segmented Volume MT5
Eduardo Da Costa Custodio Santos
O indicador Volume Segmentado MT5 foi criado para facilitar quem opera utilizando  análise preço e volume, VSA, VPA, Método Wyckoff e Smart Money System . O Segmented volume funciona em qualquer Mercado ( Cripto, CFD, Forex, Futuros, ações ...) e funciona em qualquer tempo Gráfico. Veja como é fácil sua interpretação: #Verde: Volume muito maior que a média do mercado #Rosa escuro: Volume Maior que a média #Azul: Volume normal positivo #Vermelho: volume normal Negativo #Rosa: Baixo
30 USD
Volume Zone Fractal
Eduardo Da Costa Custodio Santos
O VZO Plus é um indicador que mostra regiões de sobre compra e sobrevenda com base no volume negociado. #Quando a linha do indicador esta entre -40 e -60 ele esta sobrevendido #Quando a linha do indicador esta entre 40 e 60 ele esta sobrecomprado. Fora dessas regiões o mercado esta seguindo seu caminho natural por inércia.  A cima da linha verde, significa que o mercado é positivo, Outra forma de analisar o indicador, é através de regiões de divergência. Quando temos o fundo mais alto que
30 USD
VSA Smart Money
Eduardo Da Costa Custodio Santos
O indicador VSA Smart Money rastreia a movimentação dos traders profissionais, Trades institucionais e todos os movimentos do homem composto. O Indicador VSA Smart money faz leitura barra por barra, sendo uma excelente ferramenta para quem usa as análises de VSA, Wyckoff, PVA e Qualquer outra que utilize preço e volume. São 10 indicações que você vai encontrar no seu Gráfico: *No Demand *Climax *UT Thrust *Top Reversal bar *Stop Volume *No Supply *Spring *Bottom Reversal *Shakeout *Bag Ho
30 USD
Jac Trend
Eduardo Da Costa Custodio Santos
O Indicador JAC Trend para MT5 foi criado para facilitar na identificação da tendência do mercado de forma fácil e ágil. # Quando o indicador JAC Trend estiver verde , temos um mercado pré tendência a tendência de alta. #Quando o indicador JAC Trend estiver Vermelho temos um mercado pré tendência a tendência de baixa. # Quando o indicador JAC Trend estiver cinza , temos um mercado lateral sem força. Dessa forma você tem todos os lados que o Mercado pode ir de forma clara e objetiva.
30 USD
Z Score Plus MT5
Eduardo Da Costa Custodio Santos
Em finanças, o Z Score são medidas da variabilidade de uma observação e podem ser usados ​​pelos traders para ajudar a determinar a volatilidade do mercado. As pontuações Z revelam aos Traders se uma pontuação é típica para um conjunto de dados especificado ou se é atípica. As pontuações Z também possibilitam que os analistas adaptem as pontuações de vários conjuntos de dados para fazer pontuações que possam ser comparadas entre si com mais precisão. # Na Prática, temos o ZScore com o ponto zero
30 USD
Trend Everest
Eduardo Da Costa Custodio Santos
O indicador  Trend Everest MT5 é um indicador seguidor de tendência que auxilia na tomada de decisão. Ele tem como base o cálculo de ATR que auxiliar e a média hull. Uma questão fundamental é que o indicado Trend Everest para MT5 não repinta, dessa forma você pode fazer seu backtest com maior confiança. Quando estiver Verde Tendência de Alta Quando estiver Vermelho tendência de baixa. Não que o Mercado é fractal, então quanto maior o tempo gráfico maior seu gral de assertividade.
30 USD
JAC Trend Color Candle
Eduardo Da Costa Custodio Santos
O indicador "JAC  Trend Color Candle" para Meta Trader 5, foi criado para facilitar visualmente a tendência para o trader. Ele tem como base três parâmetros, que identifica a tendência de alta, tendência de baixa e mercado sem tendência. As cores são podem ser configuradas pelo trader, e a média também pode ser configurada pelo trader. os parâmetros de tendência não podem ser configurados, pois, são o diferencial do indicador.
30 USD
WAPV adh Supply and Demand
Eduardo Da Costa Custodio Santos
O indicador WAPV ADH Supply and Demand faz parte de um conjunto de indicadores denominado (Wyckoff Academy Wave Market) O indicador WAPV ADH Supply and Demand para MT5 destina-se a identificar o lado vencedor entre compradores e vendedores. Sua leitura é muito simples, quando a linha verde está acima da linha vermelha a demanda está no comando, quando a linha vermelha está acima da linha verde a oferta está no comando. Quanto mais positivas as linhas verde e vermelha, maior a entrada de v
40 USD
WAPV adh Supply and Demand Forex
Eduardo Da Costa Custodio Santos
O Indicador WAPV ADH Supply and Demand Forex faz parte de um conjunto de Indicadores denominado (Wyckoff Academy Wave Market) O indicador WAPV ADH Forex Supply and Demand para MT5 destina-se a identificar o lado vencedor entre compradores e vendedores. Sua leitura é muito simples, quando a linha verde está acima da linha vermelha a demanda está no comando, quando a linha vermelha está acima da linha verde a oferta está no comando. Quanto mais positivas as linhas verde e vermelha, maior a
40 USD
WAPV Box Effort x Result
Eduardo Da Costa Custodio Santos
WA_PV_BOX_EFFORT X RESULT para MT5 O Indicador WAPV Box Effort x Result faz parte do grupo de Indicadores do Pacote (Wyckoff Academy Wave Market). O Indicador WAPV Box Effort x Result para MT5 te ajuda na leitura de preço e volume. Sua leitura consiste em auxiliar na identificação de effort x result em ondas criadas pelo gráfico. O Indicador WAPV Box Effort x Result para MT5 quando está com o Box verde significa que o volume está a favor da demanda e quando o box está vermelho  o volume e
40 USD
Wapv Price and volume
Eduardo Da Costa Custodio Santos
O Indicador WAPV Price and Volume para MT5 faz parte do conjunto de ferramentas do (Wyckoff Academy Wave Market) e ( Wyckoff Academy Price and Volume). O Indicador WAPV Price and Volume para MT5 foi criado para facilitar a visualização da movimentação do volume  no gráfico de forma intuitiva. Com ele você pode observar os momentos de pico de volume e momentos em que o mercado não tem interesse profissional Identificar momentos que o Mercado esta se movimentando por inércia e não por movim
40 USD
Weis Wave Double Side Alert
Eduardo Da Costa Custodio Santos
O Indicador Weis Wave Bouble Side para o MT5 faz parte do conjunto de ferramentas (Wyckoff Academy Wave Market) O Indicador Weis Wave Bouble side para o MT5 foi criado com base no já consagrado  Weis Wave criado por David Weis. O indicador Weis Wave Double Side faz a leitura do Mercado em ondas como era feito por R. Wyckoff em 1900. Ele Ajuda na identificação de esforço x resultado, causa e efeito, e Oferta e demanda O seu diferencial é que ele pode ser utilizado abaixo do eixo zero e Possui um
60 USD
VSA Candle Signal
Eduardo Da Costa Custodio Santos
O VSA Candle Signal para MT5 faz parte do conjunto de ferramentas (Wyckoff Academy Preço e Volume). Sua função é identificar a correlação do Preço e Volume na formação do candle. Sua criação tem como base as premissas de R.Wyckoff, precursor na análise de Preço e Volume . O VSA Candle Signal para MT5 auxilia na tomada de decisão, deixando sua leitura  mais clara e fluida. Veja as imagens abaixo.
40 USD
WAPV Force and Weakness MT5
Eduardo Da Costa Custodio Santos
O Indicador Force and Weakness para MT5 Volume Real faz parte do conjunto de ferramentas do (Wyckoff Academy Preço e Volume) O Indicador Force and Weakness para MT5 Volume Real foi desenvolvido para identificar Força e Fraqueza de volume de forma acumulada. Possibilitando a visão de um panorama entre preço e volume. O Indicador pode ser utilizado como oscilador e como histograma. Como de fantasia ele tem todas as premissas das três leis de R. Wyckoff quando colocado junto ao preço: Caus
40 USD
WAPV Weis Wave Chart Forex
Eduardo Da Costa Custodio Santos
O Weis Wave Chart Forex para MT 5 é um um indicador de Preço e Volume. A leitura de Preço e Volume foi amplamente divulgada através de Richard Demille Wyckoff com base nas três leis criadas por ele: Oferta e Demanda, Causa e Efeito e Esforço x Resultado. Em 1900 R.Wyckoff já utilizava o gráfico de Ondas em suas análises. Muitos anos depois, por volta de 1990 , David Weis Automatizou o gráfico de ondas de R. Wyckoff e hoje nós trazemos a evolução do gráfico de ondas de David Weis. Ele mo
100 USD
WAPV Weis Wave Chart MT5
Eduardo Da Costa Custodio Santos
O Weis Wave Chart  para MT5 é um um indicador de Preço e Volume. A leitura de Preço e Volume foi amplamente divulgada através de Richard Demille Wyckoff com base nas três leis criadas por ele: Oferta e Demanda, Causa e Efeito e Esforço x Resultado. Em 1900 R.Wyckoff já utilizava o gráfico de Ondas em suas análises. Muitos anos depois, por volta de 1990 , David Weis Automatizou o gráfico de ondas de R. Wyckoff e hoje nós trazemos a evolução do gráfico de ondas de David Weis. Ele most
100 USD
Filtro:
Sem comentários
Responder ao comentário
Versão 1.8 2023.05.06
Novas atualizações com WACD e Suporte e Resistência automático.
Versão 1.5 2023.03.12
Implementação de alerta no JAC e no FW
Versão 1.4 2023.02.01
Atualização com acréscimo da MIDAS ( VWAP Custom) e VWAP diária, Semanal e Mensal
Versão 1.3 2023.01.10
Atualização de bug
Versão 1.2 2023.01.06
Melhoria do WAPV
Versão 1.1 2023.01.04
correção de bug