• Genel bakış
  • İncelemeler
  • Yorumlar
  • Yenilikler

WAPV Full MT5

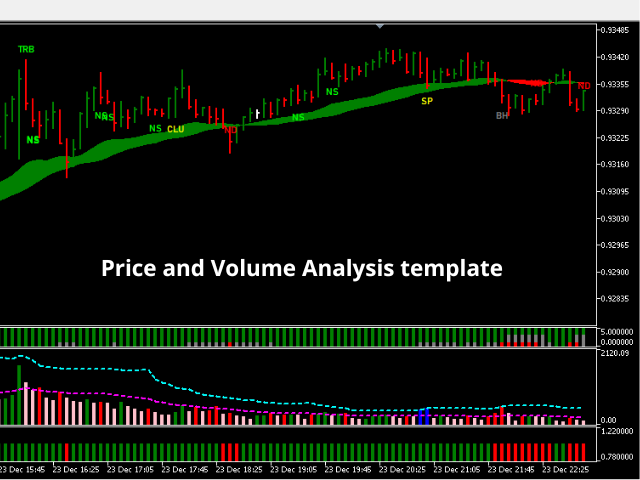
## WAPV Full kullanarak profesyonelce çalışın ve takip edin büyük oyuncuların parası nerede

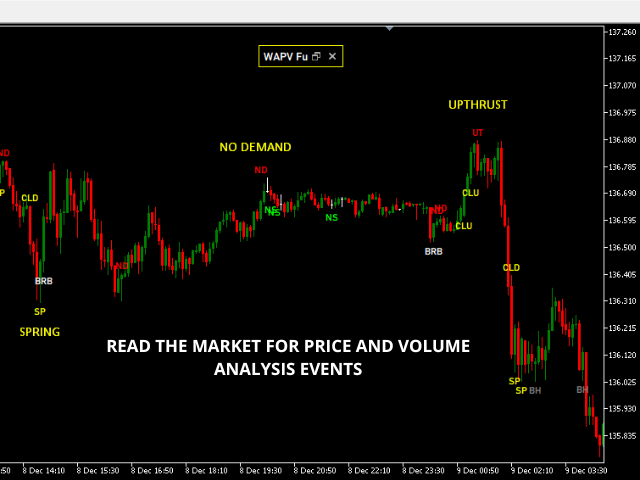
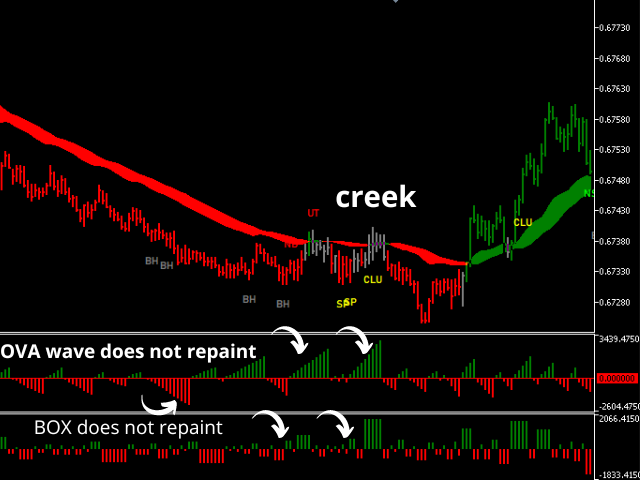
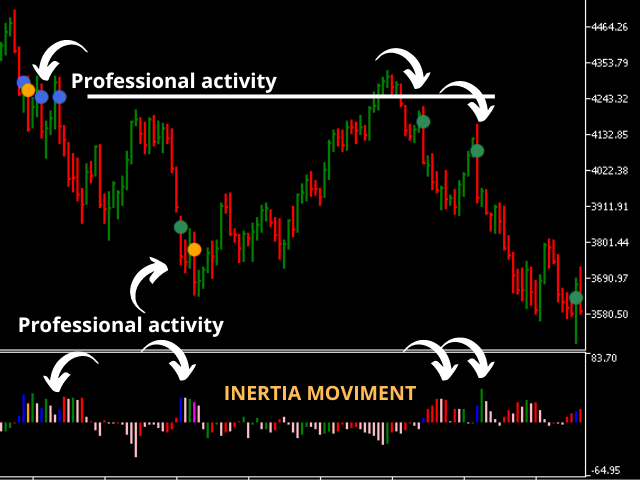
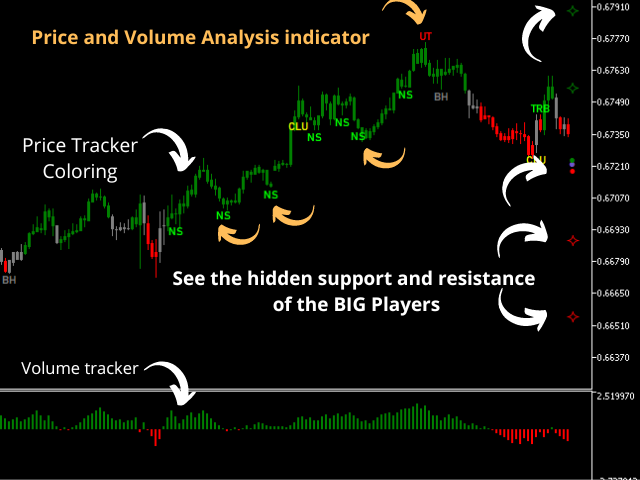
Elinizde okumayı tek başına yapan bir araç olduğunu hayal edin. en iyi ticaret bölgelerini gösteren başlıca Piyasa Oyuncuları Fiyat ve Hacim analizine dayalı. WAPV Full, eksiksiz bir araçtır ve %100 R. Wyckoff'un operasyonel özelliklerine odaklanmıştır. Ticaret dalgalarındaki piyasa hareketlerini haritalamaya ek olarak, aynı zamanda Fiyat ve Hacmi okuyarak Pazar. Profesyonel Pazar, R. Wyckoff'un 3 yasasına göre çalışır.

# Neden ve sonuç # Arz ve talep # Çaba x Sonuç

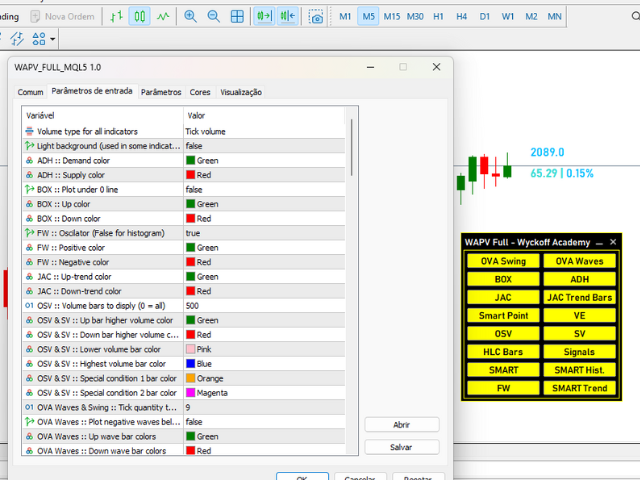
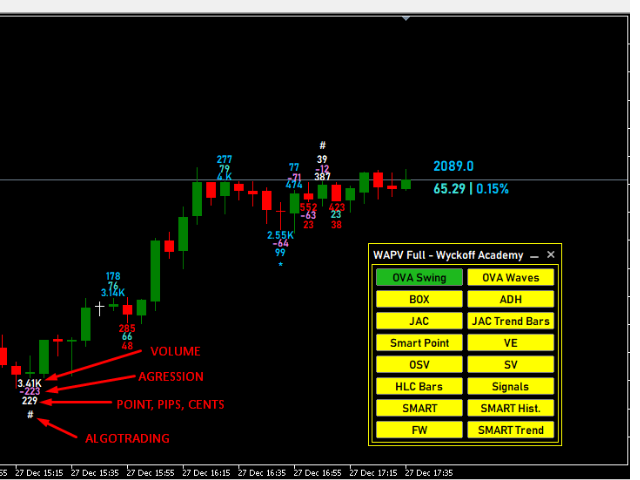
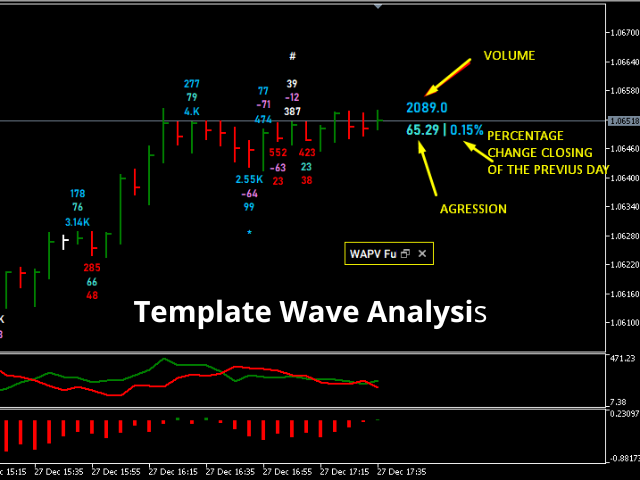
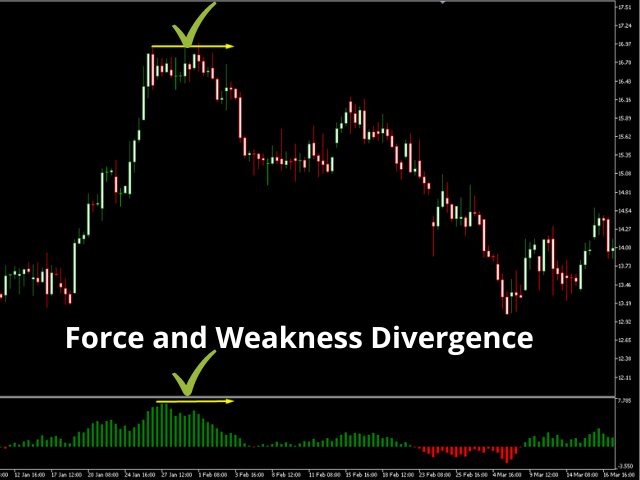
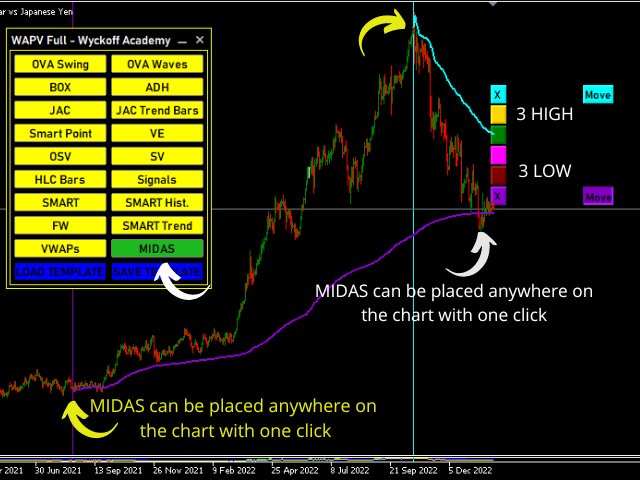
Tüm bunlar WAPV Full'de sunulur, size 16 temel araç sunar piyasayı profesyonelce analiz etmeniz ve sonuç olarak sonuçlarınızı iyileştirin. Neden bahsettiğimi anlamak için resimlere ve videoya bakın.


Önerilen ürünler
Bu gösterge, ayrık Hartley dönüşümüne dayanmaktadır. Bu dönüşümü kullanmak, finansal zaman serilerini işlerken farklı yaklaşımlar uygulamanıza olanak tanır. Bu göstergenin ayırt edici bir özelliği, okumalarının grafikteki bir noktaya değil, gösterge döneminin tüm noktalarına atıfta bulunmasıdır. Bir zaman serisini işlerken gösterge, zaman serisinin çeşitli öğelerini seçmenize olanak tanır. İlk filtreleme olasılığı bu yaklaşım üzerine kuruludur - tüm gereksiz yüksek frekanslı bileşenler basitçe
120 USD
This z-score indicator shows the correct z-score of an asset, as it uses the normalized price data for calculation, which is the only correct way. Z-score is only applicable for normal distributed data, therefore not the actual price is considered, but the normalised returns, which were assumed to follow a normal distribution. Returns are mean reverting and assumed to follow a normal distribution, therefore z-score calculation of returns is more reliable than z-score on price, as price is NOT m
99 USD
My Trendline
Ashok Kumar Singha
My Trendline is an Indicator based on Upper and Lower Trendline which will Plot Automatically into the Chart. This Indicator will perfectly indicate you the Trend of the Market. It can be use in any Time Frame. The Indicator will automatically adjust according to the Current Time Frame. Steps to Setup the Indicator: Install the Custom Indicator; Set all the Inputs, Line Color, Width and Styles etc. (Can use the Default Setting also); Set visualization to All Timeframe; and DONE It ca
499 USD
Limitless MT5
Dmitriy Kashevich
Limitless MT5 is a universal indicator suitable for every beginner and experienced trader. works on all currency pairs, cryptocurrencies, raw stocks Limitless MT5 - already configured and does not require additional configuration And now the main thing Why Limitless MT5? 1 complete lack of redrawing 2 two years of testing by the best specialists in trading 3 the accuracy of correct signals exceeds 80% 4 performed well in trading during news releases Trading rules 1 buy signa
1 399 USD
MR Dynamic POC 5
Sergey Khramchenkov
The indicator was created for the "Masters of Risk" trading system. The POC volume, known as the "Point of Control" , is the price with the highest trading volume over a selected time period. At this price, the positions of large traders and institutions accumulated. It serves as a reference point for all market participants. Price usually reacts to POC levels. The indicator can show the price changes of the maximum volume accumulation (POC). Settings are compared with volumes in NinjaTrader 8
150 USD
TPO Profile MT5
Kyra Nickaline Watson-gordon
Definition : TPO is a Time Price Opportunity. Instead of using bars or candles with an Open, High, Low, and Close price, each "bar" in a Market Profile is represented by horizontal bars against the price It is called Market Profile terminology. In other words time-price-opportunity (TPO) profiles are histograms of how much time was spent at each price within the span of the profile. By using a TPO chart, you are able to analyze the amount of trading activity, based on time, for each price leve
60 USD
Multifunctional universal trading system . Suitable for all Forex and Crypto markets. ----   Frankenstein.ex5 [GUI VERSION], provides with graphical interface for TS_DayTrader Trading System. Features an extensive array of tools for manual and automated trading. For optimization capabilities, see Frank.ex5 [VERSION FOR OPTIMIZATION] - version for the MT5 Tester. Both Frankenstein.ex5 and Frank.ex5 have automatic trading capabilities. Parameters(.set files) for Frank.ex5 and Frankenst
1 000 USD
Urgently mt5
Tatiana Savkevych
The Urgently indicator is designed to quickly determine the situation in the market, reflect the state of the market and signal profitable levels for opening trades. Market conditions change quickly enough, requiring constant calibration of trading strategies. Recommended for use in conjunction with any of the oscillators. The Urgently forex market trend indicator shows the trend direction and entry points. It smooths out price fluctuations when generating a signal by averaging the data and the
66 USD
The Volume by Price Indicator for MetaTrader 5 features Volume Profile and Market Profile TPO (Time Price Opportunity). Get valuable insights out of currencies, equities and commodities data. Gain an edge trading financial markets. Highest quality real-time and historical price data distributions. Versatile range selection methods. Drag and drop with time/price option. Unlimited segmentation. Session filtering with built-in presets for New York, London, Tokyo, Sydney and São Paulo. Composites w
149.95 USD
Market Profile defines a number of day types that can help the trader to determine market behaviour. A key feature is the Value Area, representing the range of price action where 70% of trading took place. Understanding the Value Area can give traders valuable insight into market direction and establish the higher odds trade. It is an excellent addition to any system you may be using. Blahtech Limited presents their Market Profile indicator for the MetaTrader community. Inspired by Jim Dalton’s
142 USD
BoxChart MT5
Evgeny Shevtsov
5 (6)
The market is unfair if only because 10% of participants manage 90% of funds. An ordinary trader has slim changes to stand against these "vultures". This problem can be solved. You just need to be among these 10%, learn to predict their intentions and move with them. Volume is the only preemptive factor that faultlessly works on any timeframe and symbol. First, the volume appears and is accumulated, and only then the price moves. The price moves from one volume to another. Areas of volume accumu
33 USD
Reverse side scalper is the manual trading system, that works on choppy(anti-trend) market. As a rule markets are on 80% choppy and only 20% is trend phase. System is based on custom step Moving and RSI and reverse pattern. System defines up movement, down movement, trend / choppy phases. Indicator plots Buy signal arrow when current direction is down and phase is trend, Sell signal arrow is plotted when currently is up movement and phase is trend. As a rule it allows to "catch" local maximum/mi
199 USD
Gösterge, tarihsel olanlarla karşılaştırılabilecek güncel teklifler oluşturur ve bu temelde bir fiyat hareketi tahmini yapar. Gösterge, istenen tarihe hızlı navigasyon için bir metin alanına sahiptir. Seçenekler: Sembol - göstergenin göstereceği sembolün seçimi; SymbolPeriod - göstergenin veri alacağı dönemin seçimi; GöstergeRenk - gösterge rengi; Ters - doğru tırnakları tersine çevirir, yanlış - orijinal görünüm; Sonraki, tarihi girebileceğiniz ve 'enter' tuşuna basa
55 USD
Volume Profile MT5
Mihails Babuskins
5 (2)
Contact me after the purchase to send you the guide file and add you in "Volume Profile Group", share your experiences with other users. Volume Profile FR(Fixed Range) supply and demand This is the full version of the indicator, to test please download the   demo version here   (It's free on BTCUSD or EURAUD charts) Using volume as a fundamental parameter in the analysis is very common.  A typical volume indicator works on a time axis. With it you can determine the volume of each candle, bu
39 USD
Pip Collector mt5
Manuel Rodriguez Fernandez
EA   based on collecting few pips   for each trade.  Provided with several exit systems, such as positive equity exit (parameterizable) or positive profit exit. Use the martingale system to facilitate the exit. Pip Collector mt4 ==> Operations Configuration <== Tamaño de lote inicial   → Initial lot size→ Initial opening lot per trade. Take Profit  → Take profit in pips Spread máximo   → Maximum Spread→ Maximum Spread filter. It is recommended to delimit this value as much as possible, placing
97 USD
Win43 Scalper
Eadvisors Software Inc.
O novo s43 Scalper para Mini-Índice (WIN-IND) faz operações de curto prazo no timeframe 1min buscando pequenas variações do mercado, utiliza nova tecnologia de trade, os resultados no intraday são íncríveis, confira:      Após a instalação adicione no gráfico dos instrumentos win para visualizar os resultados no backteste. Recomendamos o timeframe de 1min.
200 USD
Trigger Cash
Felipe Correa Carneiro
Triggers are business rules that you define for immediate execution after tickets are created or updated. For example, a trigger can be used to notify the customer when a ticket has been opened. The other can be created to notify the customer when the ticket is resolved. This program indicates to the user when a trend reversal trigger is triggered. This program gave me a lot of comfort in my trades on the mini index. Take the free back-test !! Thanks in advance for your attention!
233 USD
FabFlowInPrice
Fabiano Luiz Roberto
Tape Reading, flow monitoring. FabFlowInPrice   is a powerful indicator for those who like Tape Reading (Times & Trades). It presents the volumes traded at each price level, considering the purchase, sale and direct aggressions for each level. Excellent tool for market flow analysis. Thought of flow so monitor who is attacking the most, buyers, sellers or direct exchanges, thought FabFlowInPrice. The indicator displays information in 4 distinct and fixed periods, on any timeframe: @Day - All
150 USD
This indicator has been developed to identify and display these trends quickly and easily, allowing you to see instantly, those currency pairs which are trending, and those which are not – and in all timeframes, with just one click. The 28 currency pairs are displayed as a fan as they sweep from strong to weak and back again, and this is why we call it the ‘currency array’. All 28 pairs are arrayed before you, giving an instant visual description of those pairs that are trending strongly, those
197 USD
General Description In the simplest terms this is a contrarian intra-day scalping system. Built to try and let correct trades run as far as possible and flip the trade when indicated. The indicator looks at historical daily trading ranges to lay out levels at which it takes long and short positions based on the statistical levels. The indicator is built around index futures, mainly around S&P and the DOW but can be used an any futures contract mainly using AMP Futures to trade. The indicator is
250 USD
The idea of a Value Chart indicator was presented in the very good book I read back in 2020 , " Dynamic Trading Indicators: Winning with Value Charts and Price Action Profile ", from the authors Mark Helweg and David Stendahl. The idea is simple and the result is pure genius: Present candlestick Price analysis in a detrended way! HOW TO READ THIS INDICATOR Look for Overbought and Oversold levels. Of course, you will need to test the settings a lot to find the "correct" one for your approach.
FREE
Before installing the HeatMap indicator make sure you are using a broker that gives you access to the Depth of market (DOM) !! This indicator creates a heatmap on your chart allowing you to see the buy or sell limit orders easily and in real time. You have the possibility to change the setting and the colors of the HeatMap in order to adapt to all markets and all charts. Here is an example of a setting you can use with the NASDAQ100 on the AMPGlobal broker :  https://www.youtube.com/watch?v=x0
80 USD
XCalper HiLo Activator
Aecio de Feo Flora Neto
HiLo Activator v1.02 by xCalper The HiLo Activator is similar to moving average of previous highs and lows. It is a trend-following indicator used to display market’s direction of movement. The indicator is responsible for entry signals and also helps determine stop-loss levels. The HiLo Activator was first introduced by Robert Krausz in the Feb. 1998 issue of Stocks & Commodities Magazine.
30 USD
Setup Double 7s
Luigi Nunes Labigalini
Entry and exit signals from the Double 7's Strategy by Larry Connors in his book "Short Term Trading Strategies That Work". Larry claims this strategy predicted the market's direction over 80% of the time since 1995. Picking up the gains and being exposed in the market less than 25% of the time. Good for swing trading on Daily charts of SPY, Nasdaq, China's FXI, Brazil's EWZ and the majority of the equity ETFs and World Indices. How does it work? The indicator activates the buy signal when
99 USD
CoioteChart
Alexandre Moraes De Souza Lima
O Indicador CoioteChart foi construído pra facilitar desde a leitura de contexto de mercado até a micro estrutura do candle, facilitando ajustes operacionais e tomadas e decisão com alta eficácia. Possui um controle para habilitar e desabilitar a visualização das pocs, vwap, zonas de máxima e mínima negociação, pode ser utilizado data sources de tempos gráficos para cálculos ou utilizado os ticks de agressão do time and trades, funciona com volume real e volume de ticks. As colorações são at
60 USD
Session Control session indicator. Depending on from which continent the trading activity takes place in a certain period, the entire daily routine is divided into several trading sessions. Due to the fact that at each separate time interval exchange and banking platforms from different parts of the world are connected to the trading process, and the Forex market operates around the clock. There are 4 main trading sessions: Pacific. European. American. Asian. This indicator allows you t
49 USD
Thunder Scalper
Mr Fares Mohammad Alabdali
Alış ve Satış Hedefleri Göstergesi       Üç satırdan oluşur: ilk yeşil renk satın alma hedeflerini, ikinci kırmızı renk satış hedeflerini ve üçüncü mavi renk ortalama fiyatı belirtir.       Girmenin iki yolu vardır -       Yöntem 1: Ortalama fiyatın alttan uzun bir mumla kırıldığı ve yeşil bir mumla mavi çizginin üzerinde kaldığında giriş noktası satın alma olarak kabul edilir.       Ortalama fiyat kırmızı bir mumla tepeyi aştığında, satış olarak kabul edilir.       İkinci yöntem: Hedeflere ul
30 000 USD
Do you use volume in your reading of the market? Certainly many traders use it, and do not imagine operating without it. The Color Histogram Volume Set indicator allows the user to choose the value that he considers interesting to monitor. When you pass this you will have visual confirmation and if you want you will also have the audible alert that is given by the indicator. Of course, there are other ways to try to find a high volume, such as assessing whether the volume
30 USD
Sinal IFR
Aurenice Barros De Abreu Carvalho
Sinal com base no indicador RSI, que indica compra marcando com uma seta verde quando o preco sai da região de sobrevendido, e sinaliza venda quando o preco sai da regiao de sobrecomprado. A sinalizacão é  feita com uma seta verde para compra e seta rosa para venda. Permite configurar o nível de sobrecompra e de sobrevenda, além do período do RSI. Funciona em qualquer período gráfico.
65 USD
Bu ürünün alıcıları ayrıca şunları satın alıyor
Offer 249 down from 350 for the next 3 copies. then back to 350 $ Are you tired of using outdated indicators that leave you guessing where to set your profit targets? Look no further than the AK CAP Opening Range Breakout Indicator. This powerful tool is backed by a US patent and has already helped countless traders pass funded challenges like FTMO. We use it daily on our prop traders and internal funds, and now it's available to you as well. The calculation behind the indicator is incredibly
249 USD
Introduction to X3 Chart Pattern Scanner X3 Cherart Pattern Scanner is the non-repainting and non-lagging indicator detecting X3 chart patterns including Harmonic pattern, Elliott Wave pattern, X3 patterns, and Japanese Candlestick patterns. Historical patterns match with signal patterns. Hence, you can readily develop the solid trading strategy in your chart. More importantly, this superb pattern scanner can detect the optimal pattern of its kind. In addition, you can switch on and off individu
250 USD
Relative Cyclicality
Cristian Mihail Pauna
The Relative Cyclicality indicator defines the cycles of any price evolution. This indicator is computed by applying the "Cyclicality" mathematical transformation to the classic Relative Strength Index indicator made by J. Welles Wilder. The Relative Cyclicality defines very good entry and exit trading signals near the minimal and maximal points. It is better than RSI itself due to the unicity of the minimal and maximal points on a specific time interval. The Relative Cyclicality indicator can b
300 USD
The Price Cyclicality indicator defines the cycles of any price evolution. It shows clearly the ascending and descending intervals with asymptotic evolution near the minimal and maximal price values. The Price Cyclicality indicator can be used to generate automated entry signals near the minimal price values. Also, the Price Cyclicality indicator can be used to define limit conditions to generate automated exit signals near the maximal price values. The efficiency of this indicator was proved du
300 USD
Forex BUY and SELL signals from the best Heiken Ashi Smoothed indicator. Draw bullish/bearish bars on the chart. Accurate trend detector. Heiken Ashi Smoothed is a simple MT5 indicator that draws bullish and bearish bars in the chart to reflect the direction of the trend. The indicator consists of orange bearish bars and green bullish bars. When the trend changes its direction, the indicator changes its color. The indicator is a modernization of the traditional Heiken Ashi indicator. Moving Aver
900 USD
Rubdfx Fiyat Takibi Fiyat fiyat bağlılığını göstermek için kullanılır, fiyat neredeyse hiç kanal dışına çıkmaz ve çoğu zaman fiyat kanal limitlerine dokunduğunda tepki verir. Satış yapabileceğiniz en yüksek ve en düşük fiyatları belirler. ve sırasıyla satın al Scalping & swing ticareti için uygun Bir mum kapandıktan sonra görünen okları çizer. Oklar, sırasıyla düşüş ve yükseliş eğilimi için yükseliş veya düşüş baskısını gösterir. Bir ok gördüğünüzde, mumun bir okla kapanıp kapanmayacağını g
259 USD
Weis Wave with Alert MT5
Panagiotis Diamantopoulos
4.92 (13)
20% Off from 499$ to 399$, offer end 31/3/2023    https://youtu.be/RjSSW0byp-I ** NEW PLUTUS SIGNALS and ALL IN ONE ** Wychoff's UpThrust + Spring, Fake Breaks and Plutus  trading signals added (for more info visit    http://www.tradethevolumewaves.com  ) (for more info visit    http://www.tradethevolumewaves.com )   Different Wave Types,  choose what your cumulative Histogram diplays: Volume, Pips, Progressive Volume Rate, Time or Emphasized Volume Waves  ** IF YOU PURCHASE DO NOT FORGET TO CO
399 USD
• Non Repaint • DelayNo Lag •Pop Up notification • 98% Verified Accuracy • Real time arrows to catch spikes at least 4-8 bars We forward guide video how milk spikes  We also add in telegram group for better quality help  +see live trading results  https://youtu.be/DCG4CAWlg4I you will see an arrow signal and open trade for spike stop-loss of trade will be 8 or 10 candles if no spike exit you just need to follow spike arrow signals and for more good results follow inst
200 USD
[ MT4 Version ] Order Block Indicator MT5 Order Block Indicator MT5 is currently the most accurate and customizable indicator in the market. It has been developed to facilitate the analysis of operations based on Order Blocks and Supply and Demand Zones. These zones are possible reversal points of a movement. Order Blocks indicate a possible accumulation of orders in one area. The price usually gets to reach and react strongly to those areas. The most relevant levels for this reaction are the c
224 USD
Introduction Excessive Momentum Indicator is the momentum indicator to measure the excessive momentum directly from raw price series. Hence, this is an extended price action and pattern trading. Excessive Momentum Indicator was originally developed by Young Ho Seo. This indicator demonstrates the concept of Equilibrium Fractal Wave and Practical Application at the same time. Excessive Momentum detects the market anomaly. Excessive momentum will give us a lot of clue about potential reversal and
200 USD
MT4 Version   Kill Zones   SMT Divergences Order Blocks ICT Multi TF The Order Blocks ICT Multi TF indicator is a cutting-edge tool designed to help traders make better trading decisions based on order block analysis. Order blocks are key levels on a price chart where large institutional traders placed their orders. These levels tend to act as strong support or resistance zones and often signal a potential reversal or continuation of a trend. By identifying these order blocks, traders can gain
224 USD
Introduction to EFW Analytics EFW Analytics was designed to accomplish the statement "We trade because there are regularities in the financial market". EFW Analytics is a set of tools designed to maximize your trading performance by capturing the repeating fractal geometry, known as the fifth regularity in the financial market. The functionality of EFW Analytics consists of three parts. Firstly, Equilibrium Fractal Wave Index is an exploratory tool to support your trading logic to choose which r
200 USD
VTrende Pro
Andrey Dyachenko
VTrende Pro - MTF indicator for trend trading with a display panel for MT5 *** Videos can be translated into any language using subtitles (video language - Russian) Although the signals of the VTrende Pro indicator can be used as signals of a full-fledged trading system, it is recommended to use them in conjunction with the Bill Williams TS. VTrende Pro is an extended version of the VTrende indicator. Difference between Pro version and VTrende: - Time zones - Signal V - signal 1-2 waves
697 USD
This is my own modified version of the RMI indicator. Its one of the best indicators i've found to take small profits from the market and i've been able to make it slightly better by modifying and fine tuning some parts Default settings works best for M1 timeframe The Relative Momentum Index calculates a ratio of upwards changes to downwards changes in prices over N-period bars. The RMI values range between 0 and 100. 30 and 70 are the two levels of oversold and overbought market conditions re
500 USD
Fibonacci Suavizado
Cesar Juan Flores Navarro
Indicador en MQL5, que obtiene el promedio de 10 EMAS, que son alineadas según Fibonacci, obteniendo un promedio, que sera suavizado.  Se puede ingresar un numero desde 2 a N, que multiplica a los EMA-Fibonacci. Funciona en cualquier criptomoneda, etc. etc... pudiendo calcular el futuro segun la tendencia de las EMAS. Funciona excelentemente en tramos largos, determinando exactamente el mejor inicio/salida. El precio inicial por apertura sera por un periodo de tiempo, luego aumentará.
1 000 USD
Elliott Wave Trend was designed for the scientific wave counting. This tool focuses to get rid of the vagueness of the classic Elliott Wave Counting using the guideline from the template and pattern approach. In doing so, firstly Elliott Wave Trend offers the template for your wave counting. Secondly, it offers Wave Structural Score to assist to identify accurate wave formation. It offers both impulse wave Structural Score and corrective wave Structure Score. Structural Score is the rating to sh
200 USD
Robos
Namu Makwembo
5 (2)
Big promotion on the Robos, Get yours now Robos Indicator The   ROBOS   indicator is a multi timeframe oscillator that targets the   overbought   and   oversold  regions of a price chart, a signal is indicated by the two lines crossing, compatible with all tradable instruments Latest Release The latest release is the version 4.0 #What's new in version 4.0 ? Features Extreme oversold and overbought levels ROBOS version  4.0  comes with cool new feature , the ability to target only
249 USD
MT4 Version SMT Divergences MT5 SMT Divergences is one of the most innovative indicators in the market. It offers the possibility of analyzing price divergences between 2 pairs. These divergences highlight and help to foresee what banks and institutions are planning to do. SMT divergences also provides you with a kill zones indicator and the possibility of filtering divergences occurring during these kill zones.  This indicator is specially powerful if applied in 2 highly correlated pairs. A pr
224 USD
Description Very precise patterns to detect: entry signals as well as breakout, support and resistance reversal patterns. It points out zones in which, with a high probability, institutional orders with the potential to change the price’s direction and keep moving towards it, have been placed. Support:   We create great tools for the entire trading community. Most of them are free. If you believe in what we do  Support Us Here.   KEY LINKS:   Indicator Manual  -  All Products  How is this ind
280 USD
All in One package includes the  Oscillator Predictor ,  MACD Predictor ,  Thrust Scanner  and  Advanced Fibonacci  indicators which are mandatory for applying  Dinapoli  trade plans.  Please visit below links for detailed explanations of indicators. Advanced Fibonacci Indicator =>  https://www.mql5.com/en/market/product/52835 Thrust Scanner Indicator =>  https://www.mql5.com/en/market/product/52829 Overbought /Oversold Predictor indicator => https://www.mql5.com/en/market/product/52628 Mac
240 USD
Outside The Box
Innovicient Limited
The Outside The Box (OTB) is a complete trading system that provides the user with immense trading ability by highlighting on the chart areas where the trader should prepare to Re-enter the trend after pullbacks (Pullback trading strategy) Take partial/complete profit(Profit taking strategy), and Trade breakouts (Stock breakout strategy) - We have updated the indicator to show/hide Micro breakout areas around the major breakouts (Micro Breakouts).  The above is supported by an alert system to no
250 USD
Elliot Waves Analyzer Pro
Viktor Weidenthal
3.67 (3)
Elliot Waves Analyzer Pro calculates Elliot Waves to Help Identify Trend direction and Entry Levels. Mainly for Swing Trading Strategies. Usually one would open a Position in trend direction for Wave 3 or a Correction for Wave C . This Indicator draws Target Levels for the current and next wave. Most important Rules for Elliot Wave Analysis are verified by the Indicator.  The Pro version analyzes Multiple Timeframes and shows the Subwaves and Target-Levels.   For an Overview  " Elliot Waves Anal
220 USD
Smooth price for Monarch
Konstantin Gruzdev
5 (1)
The Smooth Price technical indicator is used for plotting a smoothed line as close to the price of the financial instrument as possible, and serves to eliminate its noise components. The indicator is part of the Monarch trading system, but here it is presented as an independent technical analysis tool. The indicator is based on the cluster digital filter , which, unlike the ClusterSMA , is applied directly to the price time series. Smooth Price does not redraw (except the very last, zero bar) an
999 USD
Adaptive Cyclicality
Cristian Mihail Pauna
5 (1)
The Adaptive Cyclicality indicator defines the cycles of any price evolution. This indicator is computed by applying the "Cyclicality" mathematical transformation to the Adaptive Moving Average function introduced by Perry J. Kaufmann. The Adaptive Cyclicality defines very good entry and exit trading signals near the minimal and maximal points. It is a very accurate indicator that can be used on any market and any timeframe. The Adaptive Cyclicality indicator can be used to generate automated en
300 USD
Incinerat8
Paulos Ngwenya
5 (1)
This algorithm uses real time data to generate signals with an accuracy rate of 80%. It shows entries and where you should place both the stoploss and the take profit for each trade. It determines trend! It can even help you to become a signal provider! And it can generate up to 8 signals a day! You get access to a free forex trading community  Operates on any broker compatible to synthetic indices and forex   if you need any assistance whatsapp +2774 35 35 744 or telegram link @pipsempire01
400 USD
Prices move for many reasons and these can vary from one operator to another: software, private and institutional traders simultaneously contribute to the formation of the price, making predictive art very difficult. However, there are measurable factors that bind the price to an underlying trend in line with the physical reality that the financial asset represents: these are the macroeconomic indicators. Large investors use this information wisely to set their strategies. Understanding these m
249 USD
Boom and Crash Ultra
Munyaradzi Isaac Butau
This is an indicator meant to catch trends as they are coming from a retracement .it can be used for any symbol . We can use this indicator to catch spikes or sculp for Boom , Crash ,Range Break . it offers a sell signal and buy signal and an exit signal which can also be used to enter price reversal if you see fit the indicator has a higher time frame filter system which can go up to 2 levels of time filtering which will give you more accurate signals based on the trend ,this feature can be tur
200 USD
How to use Pair Trading Station Pair Trading Station is recommended for H1 time frame and you can use it for any currency pairs. To generate buy and sell signal, follow few steps below to apply Pair Trading Station to your MetaTrader terminal. When you load Pair Trading Station on your chart, Pair Trading station will assess available historical data in your MetaTrader platforms for each currency pair. On your chart, the amount of historical data available will be displayed for each currency pai
280 USD
The Price Prediction Line is a very accurate indicator predicting the next price movement of any market in any timeframe. There is no repaint of the indicator when a new interval arrives, and the indicator can be used by anyone to automate with iCustom function. The Price Prediction Line shows clearly the ascending and descending intervals and, most important, comparatively with other signal lines from the market, the Price Prediction Line signal arrives much earlier giving us a better profit e
200 USD
Seconds Charts
Aleksandr Goryachev
Micro  ******************* Секундные графики MT5 ********************** Более точного инструмента для входа в сделку вы не найдёте. Входные параметры: Timeframe, sek - период построения графика, секунды Displayed bars - отображаемые бары Step of price levels, pp, 0-off - шаг отрисовки ценовых уровней, пункты Scale points per bar, 0-off - масштаб в пунктах на бар Show lines - отображение текущих уровней Show comment - отображение комментария Standard color scheme - стандартная цветовая сх
1 500 USD
Yazarın diğer ürünleri
VSA Smart Money
Eduardo Da Costa Custodio Santos
The VSA Smart Money indicator tracks the movement of professional traders, institutional trades and all compound man movements. The VSA Smart money Indicator reads bar by bar, being an excellent tool for those who use VSA, Wyckoff, PVA and Any other analysis that uses price and volume. There are 10 indications that you will find in your Chart: *On Demand *Climax *UT Thrust *Top Reversal bar *Stop Volume *No Supply *Spring *Reversal Bottom *Shakeout *Bag Holding Using this indicator you will be o
30 USD
Jac Trend
Eduardo Da Costa Custodio Santos
MT5 için JAC Trend Göstergesi, piyasa trendinin kolay ve çevik bir şekilde tanımlanmasını kolaylaştırmak için oluşturulmuştur. # JAC Trend göstergesi yeşil olduğunda, yükseliş trendi için bir ön trendimiz var. #JAC Trend göstergesi Kırmızı olduğunda, düşüş trendi piyasası için bir ön trendimiz var. # JAC Trend göstergesi gri olduğunda, gücü olmayan bir yan pazarımız var. Bu şekilde, Piyasanın açık ve objektif bir şekilde gidebileceği tüm taraflara sahip olursunuz.
30 USD
Weis Wave Double Side
Eduardo Da Costa Custodio Santos
MT5 için Weis Wave Bouble Yan Göstergesi, araç setinin bir parçasıdır (Wyckoff Academy Wave Market) MT5 için Weis Wave Bouble yan Göstergesi, David Weis tarafından oluşturulan halihazırda kurulmuş Weis Wave'e dayalı olarak oluşturulmuştur. Weis Wave Çift Taraflı göstergesi, piyasayı olduğu gibi dalgalar halinde okur 1900 yılında R. Wyckoff tarafından. Çaba x sonuç, neden ve sonuç ve arz ve talebi belirlemeye yardımcı olur. Diferansiyeli, sıfır ekseninin altında kullanılabilmesi ve daha da iyileş
30 USD
Segmented Volume MT5
Eduardo Da Costa Custodio Santos
MT5 Segmentli Hacim göstergesi , fiyat ve hacim analizi, VSA, VPA, Wyckoff Metodu ve Akıllı Para Sistemini kullanarak işlem yapanlara kolaylık sağlamak için oluşturulmuştur. Bölümlere ayrılmış hacim, herhangi bir Piyasada (Kripto, CFD, Forex, Vadeli İşlemler, Hisse Senetleri...) ve herhangi bir Grafik zamanında çalışır. Yorumunuzun ne kadar kolay olduğunu görün: #Yeşil: Hacim piyasa ortalamasının çok üzerinde #Koyu pembe: Ortalama hacimden daha büyük #Mavi: Pozitif normal hacim #Kırmızı: Negatif
30 USD
JAC Trend Color Candle
Eduardo Da Costa Custodio Santos
The indicator "JAC Trend Color Candle" for Meta Trader 5, was created to visually facilitate the trend for the trader. It is based on three parameters, which identifies the uptrend, downtrend and non-trending market. The colors are trader-configurable, and the average trader-configurable as well. trend parameters cannot be configured as they are the indicator's differential.
30 USD
HLC bar MT5 Wyckoff
Eduardo Da Costa Custodio Santos
MT5 için "HLC_bar_MT5 Wyckoff" göstergesi, işlem sırasında analizi kolaylaştırmak için oluşturulmuştur. HLC Çubuğu Richard Wyckoff tarafından kullanılmıştır ve şu anda "VSA" operasyonlarında yaygın olarak kullanılmaktadır. Wyckoff, Yüksek, Düşük ve Yakın kullanmanın grafiği çok daha temiz ve analiz etmeyi kolaylaştırdığını buldu. "HLC_bar_MT5 Wyckoff" Göstergesi şunları sağlar: # Çubuk genişliğini değiştirin; # Çubuğu aynı renkte bırakın; # Ve aynı fiyattan açılan ve kapanan çubuğu vurgulayın. R
30 USD
Volume Zone Fractal
Eduardo Da Costa Custodio Santos
VZO Plus is an indicator that shows overbought and oversold regions based on traded volume. #When the indicator line is between -40 and -60 it is oversold #When the indicator line is between 40 and 60 it is overbought. Outside these regions, the market is following its natural path by inertia. Above the green line, it means that the market is positive, Another way to analyze the indicator is through divergence regions. When we have the bottom higher than the other in a downtrend or One botto
30 USD
Z Score Plus MT5
Eduardo Da Costa Custodio Santos
Finansta Z Puanları, bir gözlemin değişkenliğinin ölçüleridir ve tüccarlar tarafından piyasa oynaklığının belirlenmesine yardımcı olmak için kullanılabilir. Z puanları, Traders'a bir puanın belirli bir veri kümesi için tipik mi yoksa atipik mi olduğunu söyler. Z puanları aynı zamanda analistlerin birden fazla veri kümesinden alınan puanları uyarlayarak birbirleriyle daha doğru bir şekilde karşılaştırılabilecek puanlar oluşturmasını sağlar. # Pratikte, sıfır noktalı ZScore'umuz ve ultra yüksek no
30 USD
Trend Everest
Eduardo Da Costa Custodio Santos
Trend Everest MT5 göstergesi, karar vermeye yardımcı olan bir trend takip göstergesidir. Yardımcı olan ATR'nin ve ortalama gövdenin hesaplanmasına dayanır. Önemli bir konu, Trend Everest MT5 adayının yeniden boyamamasıdır, böylece daha fazla güvenle geriye dönük test yapabilirsiniz. Yeşil Yüksek Trend olduğunda Kırmızı düşüş trendi olduğunda. Piyasa fraktal olduğundan değil, bu nedenle grafik süresi ne kadar uzun olursa, iddialılık derecesi o kadar yüksek olur.
30 USD
WAPV adh Supply and Demand
Eduardo Da Costa Custodio Santos
WAPV ADH Arz ve Talep göstergesi, (Wyckoff Academy Wave Market) adı verilen bir dizi göstergenin parçasıdır. WAPV ADH Arz ve Talep Göstergesi MT5 için alıcılar ve satıcılar arasında kazanan tarafı belirlemeyi amaçlamaktadır. Okuması çok basittir, yeşil çizgi kırmızı çizginin üzerinde olduğunda talep komuta altındadır, kırmızı çizgi yeşil çizginin üzerinde olduğunda arz komuta altındadır. Yeşil ve kırmızı çizgiler ne kadar pozitifse, hacim girişi o kadar yüksek, sıfıra veya negatife o kadar yakın
40 USD
WAPV adh Supply and Demand Forex
Eduardo Da Costa Custodio Santos
WAPV ADH Arz ve Talep Forex Göstergesi, (Wyckoff Academy Wave Market) adlı bir dizi Göstergenin parçasıdır. WAPV ADH Forex Arz ve Talep Göstergesi MT5 için alıcılar ve satıcılar arasında kazanan tarafı belirlemeyi amaçlamaktadır. Okuması çok basittir, yeşil çizgi kırmızı çizginin üzerinde olduğunda talep komuta altındadır, kırmızı çizgi yeşil çizginin üzerinde olduğunda arz komuta altındadır. Yeşil ve kırmızı çizgiler ne kadar pozitifse, hacim girişi o kadar yüksek, sıfıra veya negatife o kadar
40 USD
WAPV Box Effort x Result
Eduardo Da Costa Custodio Santos
MT5 için WA_PV_BOX_EFFORT X SONUÇ WAPV Box Effort x Result Indicator, Paket Göstergeleri grubunun (Wyckoff Academy Wave Market) bir parçasıdır. MT5 için WAPV Box Effort x Result Indicator , fiyat ve hacmi okumanıza yardımcı olur. Okuması, çaba x sonucunun tanımlanmasına yardımcı olmaktan ibarettir. grafik tarafından oluşturulan dalgalarda. Kutu yeşil olduğunda MT5 için WAPV Kutusu Eforu x Sonuç Göstergesi, hacmin talebin lehine olduğu ve kutunun kırmızı olduğu anlamına gelir hacim arzdan yana. K
40 USD
Wapv Price and volume
Eduardo Da Costa Custodio Santos
MT5 için WAPV Fiyat ve Hacim Göstergesi, (Wyckoff Academy Wave Market) ve (Wyckoff Academy Fiyat ve Hacim) araç setinin bir parçasıdır. MT5 için WAPV Fiyat ve Hacim Göstergesi, grafikteki hacim hareketini sezgisel bir şekilde görselleştirmeyi kolaylaştırmak için oluşturuldu. Bununla, piyasanın profesyonel bir ilgisinin olmadığı en yüksek hacim anlarını ve anları gözlemleyebilirsiniz. Piyasanın "akıllı para" hareketiyle değil, ataletle hareket ettiği anları belirleyin. Kullanıcı tarafından değişt
40 USD
Weis Wave Double Side Alert
Eduardo Da Costa Custodio Santos
MT5 için Weis Wave Bouble Yan Göstergesi, araç setinin bir parçasıdır (Wyckoff Academy Wave Market) MT5 için Weis Wave Bouble yan Göstergesi, David Weis tarafından oluşturulan halihazırda kurulmuş Weis Wave'e dayalı olarak oluşturulmuştur. Weis Wave Çift Taraflı göstergesi, R. Wyckoff'un 1900'de yaptığı gibi piyasayı dalgalar halinde okur. Çaba x sonuç, neden ve sonuç ve arz ve talebi belirlemeye yardımcı olur. Diferansiyeli, sıfır ekseninin altında kullanılabilmesi ve şunu gösteren bir koparma
60 USD
VSA Candle Signal
Eduardo Da Costa Custodio Santos
MT5 için VSA Candle Signal, araç setinin (Wyckoff Academy Fiyat ve Hacim) bir parçasıdır. İşlevi, mum oluşumunda Fiyat ve Hacim ilişkisini belirlemektir. Oluşturulması, Fiyat ve Hacim analizinde bir öncü olan R.Wyckoff'un öncüllerine dayanmaktadır. MT5 için VSA Candle Signal, karar vermede yardımcı olur ve okumanızı bırakır daha net ve akıcı. Aşağıdaki resimlere bakın.
40 USD
Force and Weakness Trading
Eduardo Da Costa Custodio Santos
The Force and Weakness Indicator for MT5 Forex is part of the (Wyckoff Academy Price and Volume) Toolkit The Force and Weakness Indicator for MT5 Forex was developed to identify the Strength and Weakness of volume in an accumulated way. Enabling the vision of a panorama between price and volume. The Indicator can be used as an oscillator and as a histogram. As usual it has all the premises of R. Wyckoff's three laws when put together with the price: Cause and Effect, Effort x Result and Supply a
40 USD
WAPV Force and Weakness MT5
Eduardo Da Costa Custodio Santos
MT5 Real Volume için Kuvvet ve Zayıflık Göstergesi, (Wyckoff Academy Fiyat ve Hacim) araç setinin bir parçasıdır MT5 Real Volume için Kuvvet ve Zayıflık Göstergesi, hacmin Gücünü ve Zayıflığını toplu bir şekilde belirlemek için geliştirilmiştir. Fiyat ve hacim arasında bir panorama vizyonunun etkinleştirilmesi. Gösterge, bir osilatör ve bir histogram olarak kullanılabilir. Bir fantezi olarak, fiyatla bir araya getirildiğinde R. Wyckoff'un üç yasasının tüm önermelerine sahiptir: Sebep ve Etki, Ça
40 USD
WAPV Weis Wave Chart Forex
Eduardo Da Costa Custodio Santos
MT5 için Weis Wave Chart Forex bir Fiyat ve Hacim göstergesidir. Fiyat ve Hacim okuması, Richard Demille Wyckoff tarafından oluşturulan üç yasaya dayalı olarak geniş çapta dağıtıldı: Arz ve Talep, Neden ve Etki ve Çabaya Karşı Sonuç. 1900'de R.Wyckoff, analizlerinde dalga grafiğini zaten kullanmıştı. Yıllar sonra, 1990 civarında, David Weis Otomatikleştirilmiş R. Wyckoff'un dalga grafiği ve bugün size David Weis'in dalga grafiğinin evrimini sunuyoruz. Varlıkta üretilen dalga ile ilgili Hacim mik
100 USD
WAPV Weis Wave Chart MT5
Eduardo Da Costa Custodio Santos
MT5 için Weis Dalga Tablosu bir Fiyat ve Hacim göstergesidir. Fiyat ve Hacim okuması, Richard Demille Wyckoff tarafından oluşturulan üç yasaya dayalı olarak geniş çapta dağıtıldı: Arz ve Talep, Neden ve Etki ve Çabaya Karşı Sonuç. 1900'de R.Wyckoff, analizlerinde dalga grafiğini zaten kullanmıştı. Yıllar sonra, 1990 civarında, David Weis Otomatikleştirilmiş R. Wyckoff'un dalga grafiği ve bugün size David Weis'in dalga grafiğinin evrimini sunuyoruz. Varlıkta üretilen dalga ile ilgili Hacim miktar
100 USD
WA Order Block FVG bos MT5
Eduardo Da Costa Custodio Santos
O  WA Order Block FVG bos MT5  é um indicador com base no estudo de SMC (Smart Money Concepts) criado pelo ICT Inner Circle Trader, eleplota no seu gráfico as informações de Order Blocks em 3 tempos gráficos diferentes, fair Value Gaps e Regiões de Liquidez além do BOS ( Break os Structures), tudo em um só indicador. Dessa forma você não precisa colocar essas informações de forma manual. Agora você tem tudo isso de forma automática em seu gráfico.
55 USD
Filtre:
İnceleme yok
İncelemeye yanıt
Sürüm 1.5 2023.03.12
Alert implementation in JAC and FW
Sürüm 1.4 2023.02.01
Atualização com acréscimo da MIDAS ( VWAP Custom) e VWAP diária, Semanal e Mensal
Sürüm 1.3 2023.01.10
Atualização de bug
Sürüm 1.2 2023.01.06
Melhoria do WAPV
Sürüm 1.1 2023.01.04
correção de bug