• Información general
  • Comentarios
  • Discusión (3)
  • Novedades

WAPV Full MT5


## Si no puede usar la versión de demostración, contáctenos por mensaje.

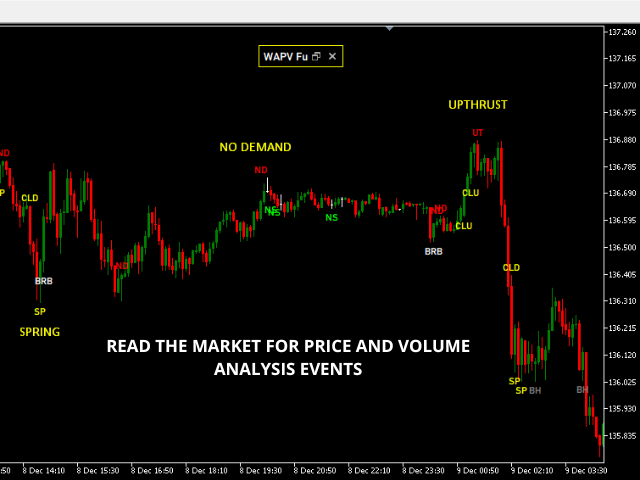
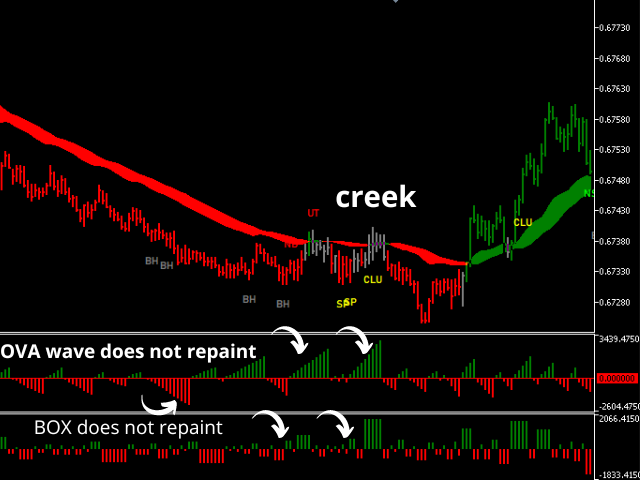
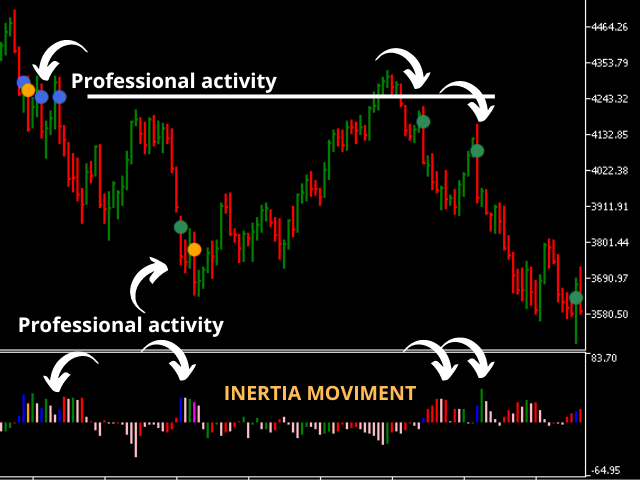
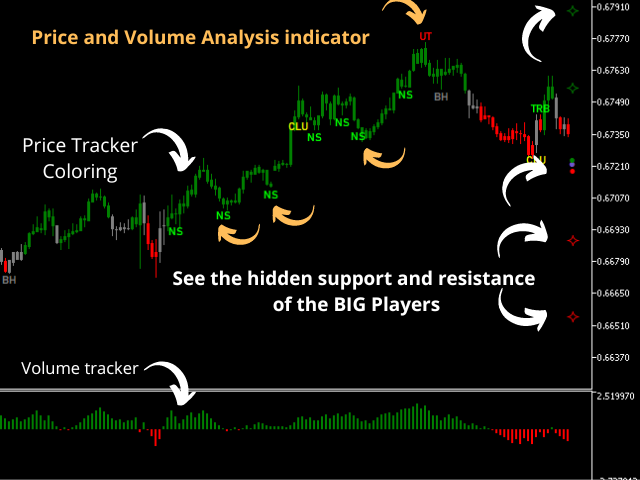
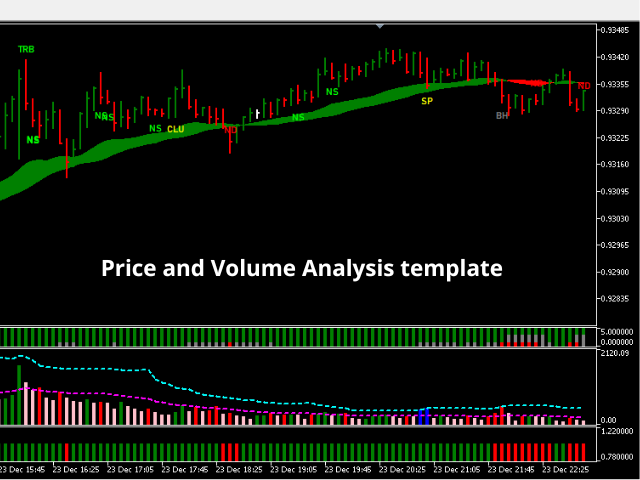
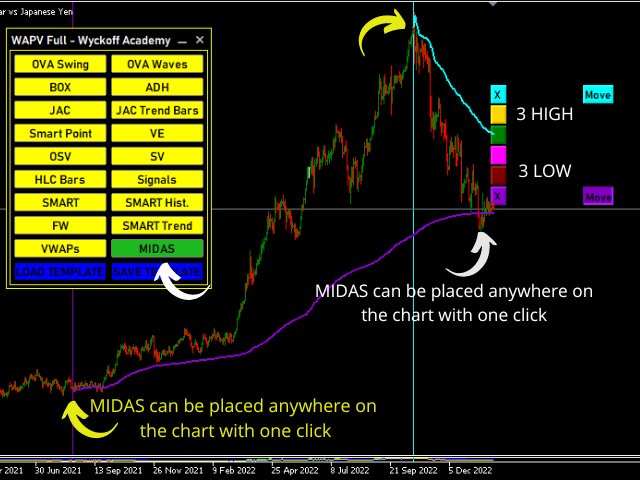
## Opere profesionalmente usando WAPV Full y sea capaz de rastrear ¿Dónde está el dinero de los grandes jugadores?

Imagina que tienes en tus manos una herramienta que solo hace la lectura de los principales jugadores del mercado, mostrando las mejores regiones comerciales basado en el análisis de Precio y Volumen. WAPV Full es una herramienta completa, 100% enfocada a la operativa de R. Wyckoff Además de mapear los movimientos del mercado en las ondas comerciales, también mapea el Mercado leyendo Precio y Volumen. El Mercado Profesional opera en base a las 3 leyes de R. Wyckoff

# Causa y efecto # Oferta y demanda # Esfuerzo x Resultado


Funciona en cualquier Mercado que tenga Precio y Volumen, FUTUROS, FOREX, CRYPTOS, STOCKS, CFDS...


Todo esto se entrega en WAPV Full, le brinda 16 herramientas fundamentales para que analices el mercado profesionalmente y en consecuencia mejorar sus resultados. Mira las imágenes y el video para entender de lo que estoy hablando.


Productos recomendados
This z-score indicator shows the correct z-score of an asset, as it uses the normalized price data for calculation, which is the only correct way. Z-score is only applicable for normal distributed data, therefore not the actual price is considered, but the normalised returns, which were assumed to follow a normal distribution. Returns are mean reverting and assumed to follow a normal distribution, therefore z-score calculation of returns is more reliable than z-score on price, as price is NOT m
¡Presentamos RSIScalperPro - un revolucionario indicador basado en RSI para MetaTrader 5, diseñado específicamente para el scalping en gráficos de un minuto! Con RSIScalperPro, tendrás una herramienta poderosa para señales precisas de entrada y salida, lo que mejorará tu eficiencia de trading. RSIScalperPro utiliza dos diferentes indicadores de RSI que proporcionan señales claras para los niveles de sobrecompra y sobreventa. Puedes ajustar los periodos de tiempo y los valores límite de los dos
Este indicador se basa en la transformada discreta de Hartley. El uso de esta transformación le permite aplicar diferentes enfoques al procesar series temporales financieras. Una característica distintiva de este indicador es que sus lecturas no se refieren a un punto del gráfico, sino a todos los puntos del período del indicador. Al procesar una serie temporal, el indicador le permite seleccionar varios elementos de la serie temporal. La primera posibilidad de filtrado se basa en este enfoque:
Value Chart Candlesticks
Flavio Javier Jarabeck
4.67 (9)
The idea of a Value Chart indicator was presented in the very good book I read back in 2020 , " Dynamic Trading Indicators: Winning with Value Charts and Price Action Profile ", from the authors Mark Helweg and David Stendahl. The idea is simple and the result is pure genius: Present candlestick Price analysis in a detrended way! HOW TO READ THIS INDICATOR Look for Overbought and Oversold levels. Of course, you will need to test the settings a lot to find the "correct" one for your approach.
FREE
Candle EA MT5
Mansour Babasafary
4.3 (40)
This expert is based on patterns The main patterns of this specialist are candlestick patterns Detects trends with candlestick patterns It has a profit limit and a loss limit, so it has a low risk The best time frame to use this expert is M30 time frame The best currency pairs to use with this expert is the EURUSD, GBPUSD, AUDUSD, USDCAD currency pairs The price will increase by 100$ after every 10 purchases! Final price 2450$ Get a 50% bonus by buying (or even renting) any of our product
Blahtech Supply Demand MT5
Blahtech Limited
4.57 (14)
Was: $299  Now: $99   Supply Demand uses previous price action to identify potential imbalances between buyers and sellers. The key is to identify the better odds zones, not just the untouched ones. Blahtech Supply Demand indicator delivers functionality previously unavailable on any trading platform. This 4-in-1 indicator not only highlights the higher probability zones using a multi-criteria strength engine, but also combines it with multi-timeframe trend analysis, previously confirmed swings
Auto Zig HTF Vwap Midas
Ricardo Almeida Branco
5 (1)
The best Vwap Midas coding for Metatrader 5 you can find in White Trader indicators. The indicator has been optimized not to recalculate (improving performance) and has several visual settings for you to adapt in your own way. TRY IT FOR FREE by clicking the free demo button Where and why to use Vwap Midas (and Auto Zig Vwap Midas) can be used on a variety of indices, currencies, forex, cryptocurrencies, stocks, indices and commodities. Many successful traders use price and volume to ge
Was: $249  Now: $99   Market Profile defines a number of day types that can help the trader to determine market behaviour. A key feature is the Value Area, representing the range of price action where 70% of trading took place. Understanding the Value Area can give traders valuable insight into market direction and establish the higher odds trade. It is an excellent addition to any system you may be using. Inspired by Jim Dalton’s book “Mind Over Markets”, this indicator is designed to suit the
Este producto le ayudará a comprar con beneficio y usar dos productos más populares para el análisis de los volúmenes de las peticiones y operaciones en los mercados de equidad: Actual Depth of Market Chart Actual Tick Footprint Volume Chart Este producto ha integrado toda la potencia de cada uno de los indicadores y se ofrece como un archivo único. Las rebajas anticrisis. ¡Hoy el precio del producto está rebajado! ¡Dese prisa! Las capacidades funcionales del producto Actual COMBO Depth of Mark
TPO Profile MT5
Kyra Nickaline Watson-gordon
Definition : TPO is a Time Price Opportunity. Instead of using bars or candles with an Open, High, Low, and Close price, each "bar" in a Market Profile is represented by horizontal bars against the price It is called Market Profile terminology. In other words time-price-opportunity (TPO) profiles are histograms of how much time was spent at each price within the span of the profile. By using a TPO chart, you are able to analyze the amount of trading activity, based on time, for each price leve
The Effort and Result indicator is based on the work of Karthik Marar; a volume spread analysis trader. It compares a price change (Result) to the volume size (Effort) for a certain period.  By comparing the effort and result, we can get more information about the future price movement. Both values are normalized and converted to a scale of 0 - 100 % based on a selectable look-back period. This indicator is also known as the Effort Index. The law of effort and result The law of effort vs. r
El indicador construye cotizaciones actuales, que se pueden comparar con las históricas y, sobre esta base, hacer un pronóstico de movimiento de precios. El indicador tiene un campo de texto para una navegación rápida a la fecha deseada. Opciones: Símbolo - selección del símbolo que mostrará el indicador; SymbolPeriod - selección del período del cual el indicador tomará datos; IndicatorColor - color del indicador; HorisontalShift: cambio de cotizaciones dibujadas por el indicador
Visual Depth of Market
Fernando Lahude Ritter
3.2 (5)
Level 2 Book Visualization Indicator Our innovative indicator seamlessly integrates Level 2 order book data onto your trading chart, offering a real-time view of market depth and the dynamics of supply and demand. With its two key features, you can enhance your market analysis and make more informed trading decisions: Biggest Volume Highlight: This input allows traders to instantly identify the price levels with the largest order lots. By highlighting the heaviest concentration of buy or sell or
FREE
Market Profile Heat indicator  — is a classic Market Profile implementation that can show the price density over time, outlining the most important price levels, value area, and control value of a given trading session. This indicator can be attached to timeframes between M1 and D1 and will show the Market Profile for daily, weekly, monthly, or even intraday sessions. Lower timeframes offer higher precision. Higher timeframes are recommended for better visibility. It is also possible to use a f
XCalper HiLo Activator
Aecio de Feo Flora Neto
HiLo Activator v1.02 by xCalper The HiLo Activator is similar to moving average of previous highs and lows. It is a trend-following indicator used to display market’s direction of movement. The indicator is responsible for entry signals and also helps determine stop-loss levels. The HiLo Activator was first introduced by Robert Krausz in the Feb. 1998 issue of Stocks & Commodities Magazine.
Market Marker MT5
Evgeny Shevtsov
3.8 (5)
The indicator displays peak levels of activity formed by the maximum volume, tracks the correlation of the candles on all timeframes (from the highest to the lowest one). Each volume level is a kind of key trading activity. The most important cluster is inside a month, week, day, hour, etc. Indicator operation features A volume level receives Demand status if the nearest volume level located to the left and above has been broken upwards. A volume level receives Supply status if the nearest vol
Based on the trading model/strategy/system of gold double-position hedging and arbitrage launched by Goodtrade Brokers, problems encountered in daily operations: 1. Account B immediately places an order immediately following account A. 2: After account A places an order, account B will automatically copy the stop loss and take profit. 3: Account A closes the position of Account B and closes the position at the same time. 4: When account B closes the position, account A also closes the position.
The Volume by Price Indicator for MetaTrader 5 features Volume Profile and Market Profile TPO (Time Price Opportunity). Get valuable insights out of currencies, equities and commodities data. Gain an edge trading financial markets. Volume and TPO histogram bar and line charts. Volume Footprint charts. TPO letter and block marker charts including split structures. Versatile segmentation and compositing methods. Static, dynamic and flexible ranges with relative and/or absolute visualizations. Lay
Gecko EA MT5
Profalgo Limited
5 (1)
NEW PROMO: Only a few copies copies available at 349$ Next price: 449$ Make sure to check out our " Ultimate EA combo package " in our   promo blog ! Gecko runs a simple, yet very effective, proven strategy.  It looks for important recent support and resistance levels and will trade the breakouts.  This is a "real" trading system, which means it will use a SL to protect the account.  It also means it will not use any dangerous techniques like martingale, grid or averaging down. The EA shows its
Market Profile Pro MT5
Sant Clear Ali Costa
4 (1)
Features Value area lines (POC, VAH and VAL) of the present and the past separately customizable, making it easier for the trader to read on the most important levels. Value areas and volume profile work in any time period and in any market such as: stocks, futures, forex. commodities, etc. Customizable volume profiles color in single color or gradient. The gradient offers the view of how the volume behaved over time. Customizable performance setup. Allowed to set the number of sessions in whic
Multifunctional universal trading system . Suitable for all Forex and Crypto markets. ----   Frankenstein.ex5 [GUI VERSION], provides with graphical interface for TS_DayTrader Trading System. Features an extensive array of tools for manual and automated trading. For optimization capabilities, see Frank.ex5 [VERSION FOR OPTIMIZATION] - version for the MT5 Tester. Both Frankenstein.ex5 and Frank.ex5 have automatic trading capabilities. Parameters(.set files) for Frank.ex5 and Frankenst
A Market Profile (time price opportunity) implementation with an option to mark a point of control (POC) based on   volume   . Config: Hide default candles. Select a session time using exchange timezone. Experiment with tick multiplier value to achieve desired level of detail. Choose the symbols of your choice, e.g. squares or A-Z chars. For multiple sessions you will have to add additional instances of this script with a different time configuration. Limitations: TradingView has a hard
VP hidden
Emr Aljnaby
5 (4)
The indicator works to convert normal volume into levels and determine financial liquidity control points. It is very similar in function to Fixed Volume Profile. But it is considered more accurate and easier to use than the one found on Trading View because it calculates the full trading volumes in each candle and in all the brokers present in MetaTrade, unlike what is found in Trading View, as it only measures the broker’s displayed prices. To follow us on social media platforms: tel
FREE
FabFlowInPrice
Fabiano Luiz Roberto
Tape Reading, flow monitoring. FabFlowInPrice   is a powerful indicator for those who like Tape Reading (Times & Trades). It presents the volumes traded at each price level, considering the purchase, sale and direct aggressions for each level. Excellent tool for market flow analysis. Thought of flow so monitor who is attacking the most, buyers, sellers or direct exchanges, thought FabFlowInPrice. The indicator displays information in 4 distinct and fixed periods, on any timeframe: @Day - All
The Rainbow Multiple Moving Average (MMA) is a technical analysis tool used to identify trends and potential reversal points in financial markets. It is based on a system of moving averages that are designed to be used together, with each moving average having a different time frame. The Rainbow MMA consists of multiple exponential moving averages (EMAs) of different lengths, with each EMA plotted in a different color. Typically, the Rainbow MMA includes EMAs of 2, 3, 4, 5, 6, 7, 8, 9, 10, 11, a
Automatic Vwap Midas
Ricardo Almeida Branco
5 (1)
The 3 Automatic Vwap (Midas) Indicator can be used for Price and Volume studyers to map the movement of market drivers. It automatically plots 3 Vwaps, two of which are dynamic and will be updated throughout the day if new highs or new lows emerge. The third Vwap is daily and can help if the trend is up or down. Also, an auxiliary indicator that plots (also dynamic) points of interest with OHLC prices (Open, High and Low of the current day and Close of the previous day) was inserted. Success and
Wapv Price and volume
Eduardo Da Costa Custodio Santos
El indicador de precio y volumen WAPV para MT5 es parte del conjunto de herramientas (Wyckoff Academy Wave Market) y (Wyckoff Academy Price and Volume). El indicador de precio y volumen WAPV para MT5 se creó para facilitar la visualización del movimiento del volumen en el gráfico de forma intuitiva. Con ella podrás observar los momentos de pico de volumen y momentos en los que el mercado no tiene interés profesional Identificar momentos en los que el mercado se mueve por inercia y no por movimie
This product is designed for the MT5 platform and offers two key features: VWAP (Volume Weighted Average Price) calculation and Volume Profile analysis. Advantages: VWAP Calculation: The product calculates the VWAP, which is a popular indicator used by traders to determine the average price of a security based on its trading volume. It helps identify potential buying or selling opportunities by comparing the current price to the average price weighted by volume. Volume Profile Analysis: The prod
Reverse side scalper is the manual trading system, that works on choppy(anti-trend) market. As a rule markets are on 80% choppy and only 20% is trend phase. System is based on custom step Moving and RSI and reverse pattern. System defines up movement, down movement, trend / choppy phases. Indicator plots Buy signal arrow when current direction is down and phase is trend, Sell signal arrow is plotted when currently is up movement and phase is trend. As a rule it allows to "catch" local maximum/mi
Aggression Volume
Flavio Javier Jarabeck
3.8 (20)
Aggression Volume Indicator is the kind of indicator that is rarely found in the MQL5 community because it is not based on the standard Volume data provided by the Metatrader 5 platform. It requires the scrutiny of all traffic Ticks requested on the platform... That said, Aggression Volume indicator requests all Tick Data from your Broker and processes it to build a very special version of a Volume Indicator, where Buyers and Sellers aggressions are plotted in a form of Histogram. Additionally,
FREE
Los compradores de este producto también adquieren
Atomic Analyst MT5
Issam Kassas
5 (12)
En primer lugar, vale la pena enfatizar que este Indicador de Trading no repinta, no redibuja y no se retrasa, lo que lo hace ideal tanto para el trading manual como para el automatizado. El Analista Atómico es un Indicador de Acción del Precio PA que utiliza la fuerza y el impulso del precio para encontrar una mejor ventaja en el mercado. Equipado con filtros avanzados que ayudan a eliminar ruidos y señales falsas, y aumentan el potencial de trading. Utilizando múltiples capas de indicadores
Primero que todo, vale la pena enfatizar que este Sistema de Trading es un Indicador No Repintado, No Redibujado y No Retrasado, lo que lo hace ideal tanto para el trading manual como para el automatizado. El "Sistema de Trading Inteligente MT5" es una solución completa de trading diseñada para traders nuevos y experimentados. Combina más de 10 indicadores premium y presenta más de 7 estrategias de trading robustas, lo que lo convierte en una opción versátil para diversas condiciones del merca
FX Volume MT5
Daniel Stein
4.94 (17)
Obtenga su actualización diaria del mercado con detalles y capturas de pantalla a través de nuestro Morning Briefing aquí en mql5 y en Telegram ! FX Volume es el PRIMER y ÚNICO indicador de volumen que proporciona una visión REAL del sentimiento del mercado desde el punto de vista de un bróker. Proporciona una visión impresionante de cómo los participantes institucionales del mercado, como los brokers, están posicionados en el mercado Forex, mucho más rápido que los informes COT. Ver esta info
Quantum Trend Sniper
Bogdan Ion Puscasu
5 (38)
Introduciendo       Indicador Quantum Trend Sniper   , el innovador indicador MQL5 que está transformando la forma en que identificas y negocias los cambios de tendencia. Desarrollado por un equipo de comerciantes experimentados con experiencia comercial de más de 13 años,       Indicador de francotirador de tendencia cuántica       está diseñado para impulsar su viaje comercial a nuevas alturas con su forma innovadora de identificar cambios de tendencia con una precisión extremadamente alta.
Introduciendo       Quantum Breakout PRO   , el innovador indicador MQL5 que está transformando la forma en que comercia con Breakout Zones. Desarrollado por un equipo de comerciantes experimentados con experiencia comercial de más de 13 años,       Desglose cuántico PRO       está diseñado para impulsar su viaje comercial a nuevas alturas con su innovadora y dinámica estrategia de zona de ruptura. El indicador de ruptura cuántica le dará flechas de señal en las zonas de ruptura con 5 zonas
A key element in trading is zones or levels from which decisions to buy or sell a trading instrument are made. Despite attempts by major players to conceal their presence in the market, they inevitably leave traces. Our task was to learn how to identify these traces and interpret them correctly. Reversal First Impulse levels (RFI)   -  Version MT4                  INSTRUCTIONS                 RUS                 ENG                         R ecommended to use with an indicator   -  TREND PRO  
TPSpro TRENDPRO  - is a trend indicator that automatically analyzes the market and provides information about the trend and each of its changes, as well as giving signals for entering trades without redrawing! The indicator uses each candle, analyzing them separately. referring to different impulses - up or down impulse. Exact entry points into transactions for currencies, crypto, metals, stocks, indices!  -  Version MT4                  DETAILED DESCRIPTION        /       TRADING SETUPS       
MetaForecast M5
Vahidreza Heidar Gholami
5 (2)
MetaForecast predice y visualiza el futuro de cualquier mercado basándose en las armonías de los datos de precios. Aunque el mercado no siempre es predecible, si existe un patrón en el precio, MetaForecast puede predecir el futuro con la mayor precisión posible. En comparación con otros productos similares, MetaForecast puede generar resultados más precisos al analizar las tendencias del mercado. Parámetros de entrada Past size (Tamaño del pasado) Especifica el número de barras que MetaForecas
Advanced Supply Demand MT5
Bernhard Schweigert
4.53 (15)
¡Actualmente con 33% de descuento! ¡La mejor solución para cualquier tráder principiante o experto! Este indicador es una herramienta comercial única, de alta calidad y asequible, porque incorpora una serie de características patentadas y una nueva fórmula. Con esta actualización, podrá mostrar zonas de doble marco temporal. No solo podrá mostrar un marco temporal más alto, sino también mostrar ambos, el marco temporal del gráfico MÁS el marco temporal más alto: MOSTRANDO ZONAS ANIDADAS. A todos
FX Power MT5 NG
Daniel Stein
5 (5)
Obtenga su actualización diaria del mercado con detalles y capturas de pantalla a través de nuestro Morning Briefing aquí en mql5 y en Telegram ! FX Power MT5 NG es la nueva generación de nuestro popular medidor de fuerza de divisas, FX Power. ¿Y qué ofrece este medidor de fuerza de nueva generación? Todo lo que le encantaba del FX Power original PLUS Análisis de fuerza de ORO/XAU Resultados de cálculo aún más precisos Períodos de análisis configurables individualmente Límite de cálculo persona
Este es posiblemente el indicador de reconocimiento automático de formación de precios más completo que puede encontrar para la plataforma MetaTrader. Detecta 19 patrones diferentes, toma las proyecciones de Fibonacci tan en serio como usted, muestra la zona de reversión potencial (PRZ) y encuentra niveles adecuados de stop-loss y take-profit. [ Guía de instalación | Guía de actualización | Solución de problemas | FAQ | Todos los productos ] Detecta 19 formaciones de precios armónicos difer
Gartley Hunter Multi
Siarhei Vashchylka
5 (6)
Gartley Hunter Multi - An indicator for searching for harmonic patterns simultaneously on dozens of trading instruments and on all classic timeframes: (m1, m5, m15, m30, H1, H4, D1, Wk, Mn). Manual (Be sure to read before purchasing) | Version for MT4 Advantages 1. Patterns: Gartley, Butterfly, Shark, Crab. Bat, Alternate Bat, Deep Crab, Cypher 2. Simultaneous search for patterns on dozens of trading instruments and on all classic timeframes 3. Search for patterns of all possible sizes. Fr
Noize Absorption Index - is the manual trading system that measures the difference of pressure between bears forces and bulls forces. Green line - is a noize free index that showing curent situation. Zero value of index shows totally choppy/flat market.Values above zero level shows how powerfull bullish wave is and values below zero measures bearish forces.Up arrow appears on bearish market when it's ready to reverse, dn arrow appears on weak bullish market, as a result of reverse expectation.
RelicusRoad Pro MT5
Relicus LLC
4.82 (22)
Ahora $ 147 (aumentando a $ 499 después de algunas actualizaciones) - Cuentas ilimitadas (PC o Mac) Manual de usuario de RelicusRoad + Videos de capacitación + Acceso al grupo privado de Discord + Estado VIP UNA NUEVA MANERA DE VER EL MERCADO RelicusRoad es el indicador comercial más poderoso del mundo para divisas, futuros, criptomonedas, acciones e índices, y brinda a los comerciantes toda la información y las herramientas que necesitan para mantenerse rentables. Brindamos análisis téc
Este es un genial indicador para MT5 que ofrece señales precisas para entrar en una transacción sin redibujar. Se puede aplicar a cualquier activo financiero: fórex, criptomonedas, metales, acciones, índices. Nos dará valoraciones bastante precisas y nos dirá cuándo es mejor abrir y cerra una transacción. Eche un vistazo  al vídeo  (6:22), ¡contiene un ejemplo de procesamiento de una sola señal que ha amortizado el indicador! La mayoría de los tráders mejoran sus resultados comerciales durante l
Golden Gate Algo MT5
James David Lane
4 (6)
¡40% DE DESCUENTO PARA NAVIDAD! ¡AUMENTO DE PRECIO A $250 EL 1 DE ENERO! Presentamos GoldenGate Entries: ¡Una Solución de Trading de Vanguardia! Descubre un enfoque revolucionario para el trading con GoldenGate Entries (GGE), un indicador avanzado diseñado para elevar tu experiencia de trading. GGE proporciona un conjunto completo de características para capacitar a los usuarios con precisión y confianza en sus decisiones comerciales. Pares: Cualquiera (FX - Materias primas - Acciones - A
Good day! I present to you a trading technical indicator for Deriv broker synthetic indices. This indicator ONLY works with the following indices: Boom 300 Index Boom 500 Index Boom 1000 Index Crash 300 Index Crash 500 Index Crash 1000 Index The indicator was created to give signals to open medium-term trades in the direction of Spikes. But you can open trades in the opposite direction to Spikes, at your own risk. Trade only on M1. Other TFs do not guarantee the correct operation of the indic
Este indicador es una herramienta de transacción única, de alta calidad y asequible porque hemos incorporado una serie de características propias y una fórmula secreta.   Con solo un gráfico, da Alertas para los 28 pares de divisas.   ¡Imagina cómo mejorarás porque puedes identificar el punto de activación exacto de una nueva tendencia u oportunidad de crecimiento! Basado en   nuevos algoritmos subyacentes , hace que sea aún más fácil identificar y confirmar   operaciones potenciales . Esto se d
XQ Indicator MetaTrader 5
Marzena Maria Szmit
5 (1)
Step into the realm of Forex trading with confidence and precision using XQ, a cutting-edge Forex indicator designed to elevate your trading game to unprecedented heights. Whether you're a seasoned trader or just stepping into the world of currency exchange, XQ Forex Indicator empowers you with the insights and signals needed to make informed trading decisions. The signal conditions are a combination of three indicators, and XQ Forex Indicator only display  medium and long-term trends . The ind
Тем, кто изучил книги Билла Вильямса "Новые измерения в биржевой торговле" и "Торговый Хаос (второе издание)" и пробовал торговать по этим методикам, становится ясно, что стандартного набора индикаторов недостаточно для полноценной работы. Индикатор  Trading Chaos Map  рисует "карту рынка", позволяя вам видеть графики так же, как автор трилогии. В параметрах предусмотрены опции включения и отключения каждого сигнала. Вы можете использовать ту или иную методику, либо использовать их вместе. Может
Royal Scalping Indicator M5
Vahidreza Heidar Gholami
5 (8)
My products are currently 50% off. Explore them and build your own strategy. Royal Scalping Indicator is an advanced price adaptive indicator designed to generate high-quality trading signals. Built-in multi-timeframe and multi-currency capabilities make it even more powerful to have configurations based on different symbols and timeframes. This indicator is perfect for scalp trades as well as swing trades. Royal Scalping is not just an indicator, but a trading strategy itself. Features Price A
Golden Spikes Detector
Batsirayi L Marango
5 (1)
Golden Spikes Detector Este indicador se basa en una estrategia avanzada principalmente para negociar picos en índices de auge y caída. Se implementaron algoritmos complejos para detectar únicamente entradas de alta probabilidad. Alerta sobre posibles entradas de Compra y Venta. Para negociar picos en el corredor Deriv o Binary, solo acepte las alertas Buy Boom y Sell Cash. Se optimizó para cargarse en un período de tiempo de 5 minutos, aunque se realiza un análisis de múltiples períodos de tiem
Royal Wave Pro M5
Vahidreza Heidar Gholami
3.5 (4)
Royal Wave is a Trend-Power oscillator which has been programmed to locate and signal low-risk entry and exit zones. Its core algorithm statistically analyzes the market and generates trading signals for overbought, oversold and low volatile areas. By using a well-designed alerting system, this indicator makes it easier to make proper decisions regarding where to enter and where to exit trades. Features Trend-Power Algorithm Low risk Entry Zones and Exit Zones Predictions for Overbought and Over
Eng Gold
Ely Alkrar Xshkaky
ENG-GOLD Scalper It is an auxiliary indicator that identifies potential targets and determines the place of entry with a stop loss that works on Heiken Ashi candles  The green lines are usually the targets, the red lines are the stop loss, and the yellow lines are the entry location.  This file is recognized on small and medium frames, usually less than the watch frame I highly recommend using XAUUSD US100 US30 USOIL 
Bill Williams Advanced
Siarhei Vashchylka
5 (5)
Bill Williams Advanced is designed for automatic chart analysis using Bill Williams' "Profitunity" system. The indicator analyzes four timeframes at once. Manual (Be sure to read before purchasing) Advantages 1. Automatically analyzes the chart using the "Profitunity" system of Bill Williams. The found signals are placed in a table in the corner of the screen. 2. Equipped with a trend filter based on the Alligator indicator. Most of the system signals are recommended to be used only accordi
TrendMaestro5
Stefano Frisetti
note: this indicator is for METATRADER4, if you want the version for METATRADER5 this is the link:  https://www.mql5.com/it/market/product/108106 TRENDMAESTRO ver 2.4 TRENDMAESTRO recognizes a new TREND in the bud, he never makes mistakes. The certainty of identifying a new TREND is priceless. DESCRIPTION TRENDMAESTRO identifies a new TREND in the bud, this indicator examines the volatility, volumes and momentum to identify the moment in which there is an explosion of one or more of these data a
Stargogs Spike Catcher
Lorenzo Edward Beukes
4.5 (8)
Stargogs Spike Catcher V3.12 This Indicator is Developed To milk the BOOM and CRASH indices . Send me Message if you need any help with the indicator.  CHECK OUT THE STARGOGS SPIKE CATCHER EA/ROBOT V3: CLICK HERE ALSO CHECK OUT SECOND TO NONEFX SPIKE CATCHER:   CLICK HERE STARGOGS SPIKE CATCHER V3.12 WHATS NEW! Brand New Strategy. This is the Indicator you need for 2023. The Indicator Gives you an Entry at a time when conditions are met enter on every arrow and exit when it gives an X. New Tren
TPA True Price Action indicator reveals the true price action of the market makers through 100% non-repainting signals strictly at the close of a candle! TPA shows entries and re-entries, every time the bulls are definitely stronger than the bears and vice versa. Not to confuse with red/green candles. The shift of power gets confirmed at the earliest stage and is ONE exit strategy of several. There are available now two free parts of the TPA User Guide for our customers. The first "The Basics"
Introduction to Sideways Market Analyzer Notable period of Low volatility and non-trending movements in the financial market is considered as Sideways Market. Sooner or later, the low volatility will increase and the price will pick up a trend after Sideways Market. In terms of trading point of view, Sideways Market can serve as the very good entry timing for traders. Sideways Market is also quite often the representation of accumulation of large orders from big investors. Therefore, knowing the
Ace Supply Demand Zone Indicator The concept of supply demand relies on the quantity mismatching between buying and selling volumes in the financial market. Supply and demand zone can provide the good entry and exit. A zone is easier to trade than a line. The supply demand zone can provide the detailed trading plan and the risk management. Its ability to predict market direction is high. There are two distinctive points about Ace Supply Demand Zone Indicator. Ace Supply Demand Zone indicator was
Otros productos de este autor
HLC bar MT5 Wyckoff
Eduardo Da Costa Custodio Santos
El indicador "HLC_bar_MT5 Wyckoff" para MT5 se creó para facilitar el análisis en el momento de la negociación. La barra HLC fue utilizada por Richard Wyckoff y actualmente se usa ampliamente en operaciones "VSA" . Wyckoff descubrió que el uso de High, Low y Close hacía que el gráfico fuera mucho más limpio y fácil de analizar. El indicador " HLC_bar_MT5 Wyckoff " permite: # Cambiar el ancho de la barra; # Deja la barra del mismo color; # Y resalte la barra que abrió y cerró al mismo precio. Los
VSA Smart Money
Eduardo Da Costa Custodio Santos
El indicador VSA Smart Money rastrea el movimiento de los comerciantes profesionales, los intercambios institucionales y todos los movimientos de hombres compuestos. El VSA Smart Money Indicator lee barra por barra, siendo una excelente herramienta para quienes utilizan VSA, Wyckoff, PVA y cualquier otro análisis que utilice precio y volumen. Hay 10 indicaciones que encontrará en su gráfico: *No Demand *Climax *UT Thrust *Top Reversal bar *Stop Volume *No Supply *Spring *Bottom Reversal *Shakeou
Segmented Volume MT5
Eduardo Da Costa Custodio Santos
El indicador de volumen segmentado MT5 se creó para facilitar a quienes operan utilizando análisis de precios y volumen, VSA, VPA, método Wyckoff y Smart Money System. El volumen segmentado funciona en cualquier mercado (Crypto, CFD, Forex, futuros, acciones ...) y funciona en cualquier momento del gráfico. Vea lo fácil que es su interpretación: #Verde: Volumen mucho más alto que el promedio del mercado #Rosa oscuro: volumen más grande que el promedio #Azul: Volumen normal positivo #Red: Volumen
Volume Zone Fractal
Eduardo Da Costa Custodio Santos
VZO Plus es un indicador que muestra las regiones de sobrecompra y sobreventa en función del volumen negociado. # Cuando la línea del indicador está entre -40 y -60 está sobrevendida #Cuando la línea del indicador está entre 40 y 60, hay sobrecompra. Fuera de estas regiones, el mercado sigue su camino natural por inercia. Por encima de la línea verde, significa que el mercado es positivo, Otra forma de analizar el indicador es a través de regiones de divergencia. Cuando tenemos la parte inferior
Jac Trend
Eduardo Da Costa Custodio Santos
El indicador de tendencia JAC para MT5 fue creado para facilitar la identificación de la tendencia del mercado de una manera fácil y ágil. # Cuando el indicador JAC Trend es verde , tenemos una pre-tendencia al mercado de tendencia alcista. # Cuando el indicador JAC Trend es rojo , tenemos una pre-tendencia al mercado de tendencia bajista. # Cuando el indicador JAC Trend está gris , tenemos un mercado lateral sin fuerza. De esa forma tienes todos los lados a los que el Mercado puede dirigirse de
Z Score Plus MT5
Eduardo Da Costa Custodio Santos
En finanzas, las puntuaciones Z son medidas de la variabilidad de una observación y los comerciantes pueden utilizarlas para ayudar a determinar la volatilidad del mercado. Los puntajes Z le dicen a los comerciantes si un puntaje es típico para un conjunto de datos específico o es atípico. Los puntajes Z también permiten a los analistas adaptar puntajes de múltiples conjuntos de datos para hacer puntajes que puedan compararse con mayor precisión entre sí. # En la práctica, tenemos el ZScore con
Trend Everest
Eduardo Da Costa Custodio Santos
Trend Everest MT5 indicator is a trend following indicator that aids in decision making. It is based on the calculation of ATR that assist and the average hull. A key issue is that the Trend Everest MT5 nominee does not repaint, so you can backtest with greater confidence. When it is Green, UpTrend When it is a Red downtrend. Not that the Market is fractal, so the longer the graphic time, the greater its degree of assertiveness.
JAC Trend Color Candle
Eduardo Da Costa Custodio Santos
El indicador "JAC Trend Color Candle" para Meta Trader 5, fue creado para facilitar visualmente la tendencia al comerciante. Se basa en tres parámetros, que identifican el mercado con tendencia alcista, bajista y sin tendencia. Los colores son configurables por el comerciante, y el comerciante promedio también lo es. Los parámetros de tendencia no se pueden configurar ya que son el diferencial del indicador.
WAPV adh Supply and Demand
Eduardo Da Costa Custodio Santos
El indicador de oferta y demanda de WAPV ADH es parte de un conjunto de indicadores llamado (Wyckoff Academy Wave Market) El indicador de oferta y demanda WAPV ADH para MT5 tiene como objetivo identificar el lado ganador entre compradores y vendedores . Su lectura es muy sencilla, cuando la línea verde está por encima de la línea roja manda la demanda , cuando la línea roja está por encima de la línea verde manda la oferta. Cuanto más positivas sean las líneas verde y roja, mayor será la entrada
WAPV adh Supply and Demand Forex
Eduardo Da Costa Custodio Santos
El indicador de Forex de oferta y demanda WAPV ADH es parte de un conjunto de indicadores llamado (Wyckoff Academy Wave Market) El indicador de oferta y demanda de divisas WAPV ADH para MT5 tiene como objetivo identificar el lado ganador entre compradores y vendedores. Su lectura es muy sencilla, cuando la línea verde está por encima de la línea roja manda la demanda , cuando la línea roja está por encima de la línea verde manda la oferta . Cuanto más positivas sean las líneas verde y roja, mayo
WAPV Box Effort x Result
Eduardo Da Costa Custodio Santos
WA_PV_BOX_EFFORT X RESULTADO para MT5 El indicador WAPV Box Effort x Result es parte del grupo de indicadores de paquetes (Wyckoff Academy Wave Market). El indicador WAPV Box Effort x Result para MT5 lo ayuda a leer el precio y el volumen. Su lectura consiste en auxiliar en la identificación esfuerzo x resultado en ondas creadas por el gráfico. El indicador de esfuerzo x resultado de la caja WAPV para MT5 cuando la caja es verde significa que el volumen está a favor de la demanda y cuando la caj
Wapv Price and volume
Eduardo Da Costa Custodio Santos
El indicador de precio y volumen WAPV para MT5 es parte del conjunto de herramientas (Wyckoff Academy Wave Market) y (Wyckoff Academy Price and Volume). El indicador de precio y volumen WAPV para MT5 se creó para facilitar la visualización del movimiento del volumen en el gráfico de forma intuitiva. Con ella podrás observar los momentos de pico de volumen y momentos en los que el mercado no tiene interés profesional Identificar momentos en los que el mercado se mueve por inercia y no por movimie
Weis Wave Double Side
Eduardo Da Costa Custodio Santos
El indicador lateral Weis Wave Bouble para MT5 es parte del conjunto de herramientas (Wyckoff Academy Wave Market) El indicador lateral Weis Wave Bouble para MT5 se creó en base al ya establecido Weis Wave creado por David Weis. El indicador Weis Wave Double Side lee el mercado en ondas como se hizo por R. Wyckoff en 1900. Ayuda a identificar esfuerzo x resultado, causa y efecto, oferta y demanda. Su diferencial es que se puede utilizar por debajo del eje cero, mejorando aún más más lectura del
Weis Wave Double Side Alert
Eduardo Da Costa Custodio Santos
El indicador lateral Weis Wave Bouble para MT5 es parte del conjunto de herramientas (Wyckoff Academy Wave Market) El indicador lateral Weis Wave Bouble para MT5 se creó en base al ya establecido Weis Wave creado por David Weis. El indicador Weis Wave Double Side lee el mercado en ondas como lo hizo R. Wyckoff en 1900. Ayuda a identificar esfuerzo x resultado, causa y efecto, oferta y demanda. Su diferencial es que se puede usar debajo del eje cero y tiene una alerta de ruptura que muestra Quien
VSA Candle Signal
Eduardo Da Costa Custodio Santos
VSA Candle Signal para MT5 es parte del conjunto de herramientas (Wyckoff Academy Price and Volume). Su función es identificar la correlación de Precio y Volumen en la formación de la vela. Su creación se basa en las premisas de R.Wyckoff , precursor en el análisis de Precio y Volumen. VSA Candle Signal para MT5 asiste en la toma de decisiones, dejando su lectura más clara y fluida. Vea las imágenes a continuación.
Force and Weakness Trading
Eduardo Da Costa Custodio Santos
El indicador de fuerza y ​​debilidad para MT5 Forex es parte del kit de herramientas (Wyckoff Academy Price and Volume) El indicador de fuerza y ​​debilidad para MT5 Forex fue desarrollado para identificar la fuerza y ​​la debilidad del volumen de forma acumulada. Habilitando la visión de un panorama entre precio y volumen. El indicador se puede utilizar como oscilador y como histograma. Como de costumbre, tiene todas las premisas de las tres leyes de R. Wyckoff cuando se juntan con el precio: C
WAPV Force and Weakness MT5
Eduardo Da Costa Custodio Santos
El indicador de fuerza y ​​debilidad para el volumen real de MT5 es parte del conjunto de herramientas (Wyckoff Academy Price and Volume) El indicador de fuerza y ​​debilidad para el volumen real de MT5 se desarrolló para identificar la fuerza y ​​la debilidad del volumen de forma acumulada. Habilitando la visión de un panorama entre precio y volumen. El indicador se puede utilizar como oscilador y como histograma. Como fantasía tiene todas las premisas de las tres leyes de R. Wyckoff cuando se
WAPV Weis Wave Chart Forex
Eduardo Da Costa Custodio Santos
El Weis Wave Chart Forex para MT5 es un indicador de precio y volumen. La lectura de Precio y Volumen fue ampliamente difundida a través de Richard Demille Wyckoff en base a las tres leyes creadas por él: Oferta y Demanda, Causa y Efecto y Esfuerzo vs. Resultado. En 1900, R.Wyckoff ya utilizaba el gráfico de ondas en sus análisis. Muchos años después, alrededor de 1990, David Weis Automatizó el gráfico de ondas de R. Wyckoff y hoy os traemos la evolución del gráfico de ondas de David Weis. Muest
WAPV Weis Wave Chart MT5
Eduardo Da Costa Custodio Santos
El gráfico Weis Wave para MT5 es un indicador de precio y volumen. La lectura de Precio y Volumen fue ampliamente difundida a través de Richard Demille Wyckoff en base a las tres leyes creadas por él: Oferta y Demanda, Causa y Efecto y Esfuerzo vs. Resultado. En 1900, R.Wyckoff ya utilizaba el gráfico de ondas en sus análisis. Muchos años después, alrededor de 1990, David Weis Automatizó el gráfico de ondas de R. Wyckoff y hoy os traemos la evolución del gráfico de ondas de David Weis. Muestra l
WA Order Block FVG bos MT5
Eduardo Da Costa Custodio Santos
O  WA Order Block FVG bos MT5  é um indicador com base no estudo de SMC (Smart Money Concepts) criado pelo ICT Inner Circle Trader, eleplota no seu gráfico as informações de Order Blocks em 3 tempos gráficos diferentes, fair Value Gaps e Regiões de Liquidez além do BOS ( Break os Structures), tudo em um só indicador. Dessa forma você não precisa colocar essas informações de forma manual. Agora você tem tudo isso de forma automática em seu gráfico.
Filtro:
No hay comentarios
Respuesta al comentario
Versión 2.1 2024.01.21
Many updates
Versión 2.0 2023.06.15
Melhorias
Versión 1.8 2023.05.06
Novas atualizações com WACD e Suporte e Resistência automático.
Versión 1.5 2023.03.12
Alert implementation in JAC and FW
Versión 1.4 2023.02.01
Atualização com acréscimo da MIDAS ( VWAP Custom) e VWAP diária, Semanal e Mensal
Versión 1.3 2023.01.10
Atualização de bug
Versión 1.2 2023.01.06
Melhoria do WAPV
Versión 1.1 2023.01.04
correção de bug