Scalping One Plus A1
- Indicadores
- Versão: 1.0
- Ativações: 5

Trading is a trade war
So traders are warriors.
A warrior needs a weapon.
The Scalping One Plus A1 is a powerful weapon. Extremely accurate
This tool can be customized as you like.
Who deserves such an accurate weapon?
1. People who want profits From binary options trading
2. Those who want to trade short, profit fast
3. People who want long-term can do it.
4. Beginners can use it.
5. Old hand works very well.
How it works It works very easy.
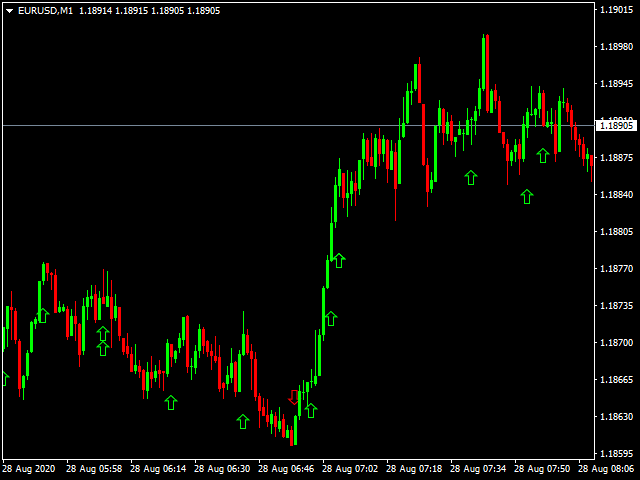
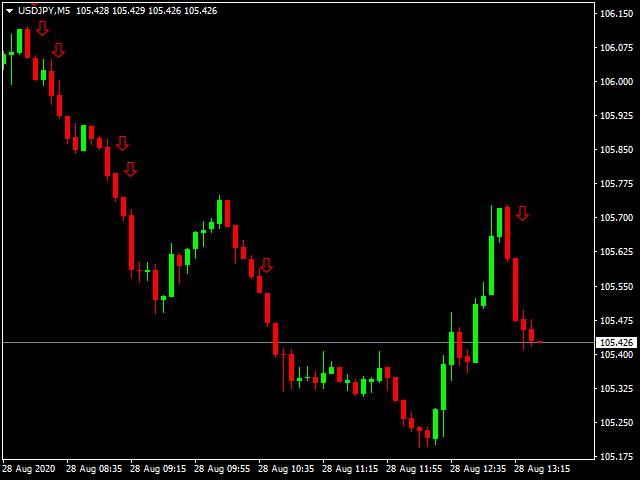
For binary options
Time frame M1 or M5 and expires 5-15 minutes.
1. Up arrow to entry order Call or Higher
2. Down arrow to entry order Put or Lower.
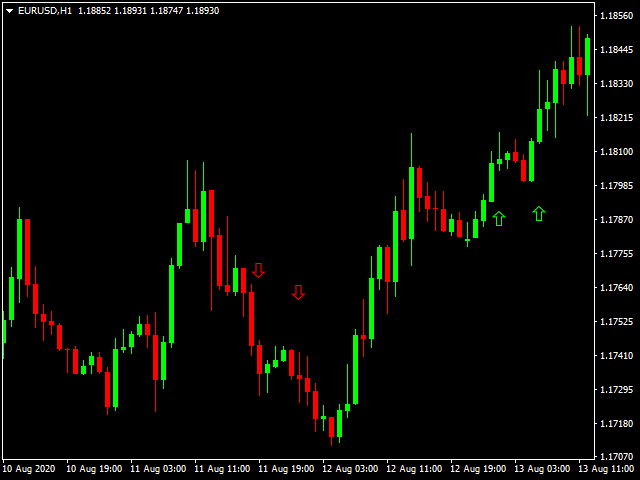
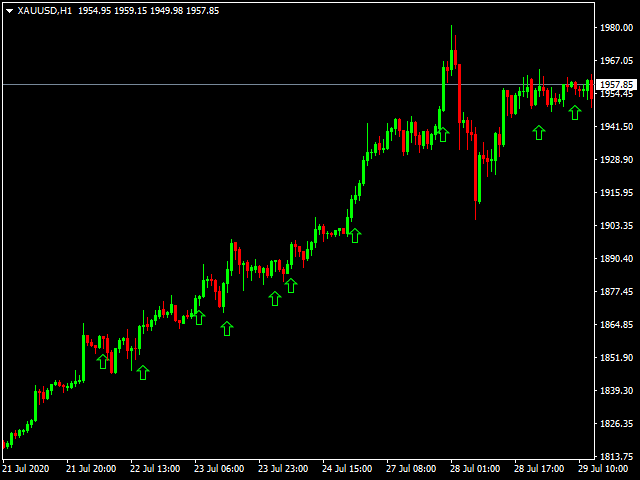
For Forex
1. Up arrow to place an order and close the order when the red arrow appears.
2. Down arrow to place a sell order and close a buy order when the green arrow appears.