Dinapoli Package MT5
- Indicadores
- Versão: 1.1
- Atualizado: 13 maio 2023
- Ativações: 15

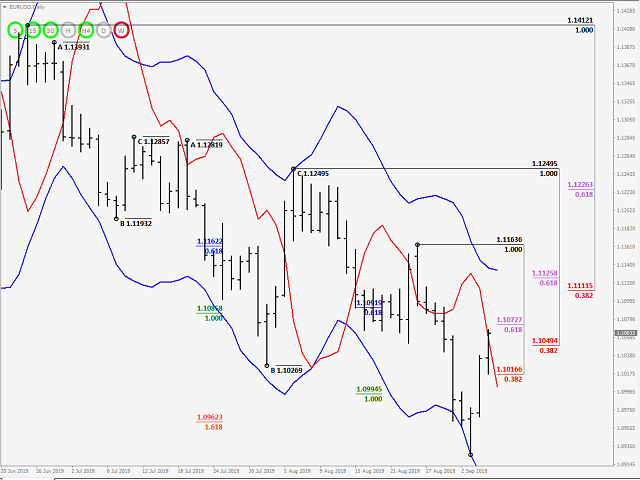
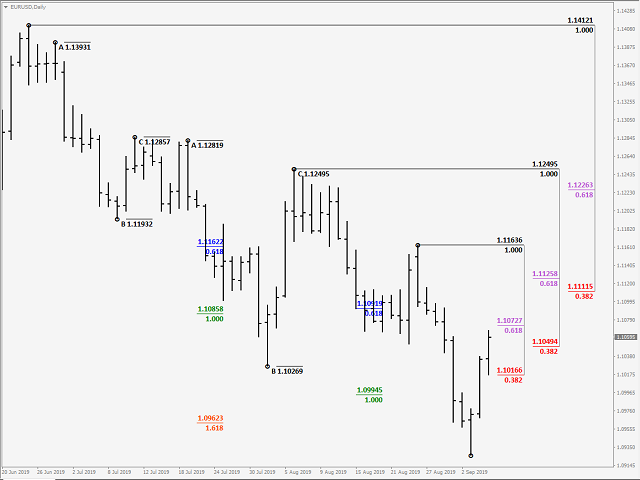
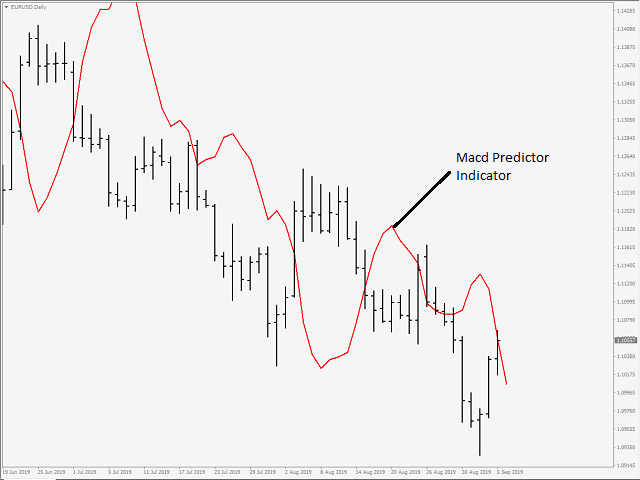
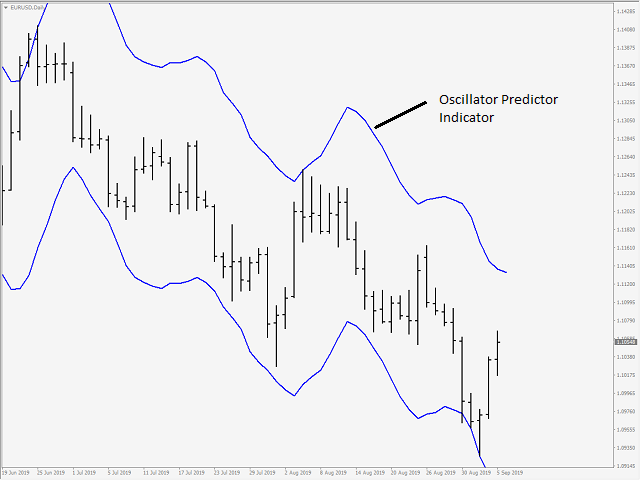
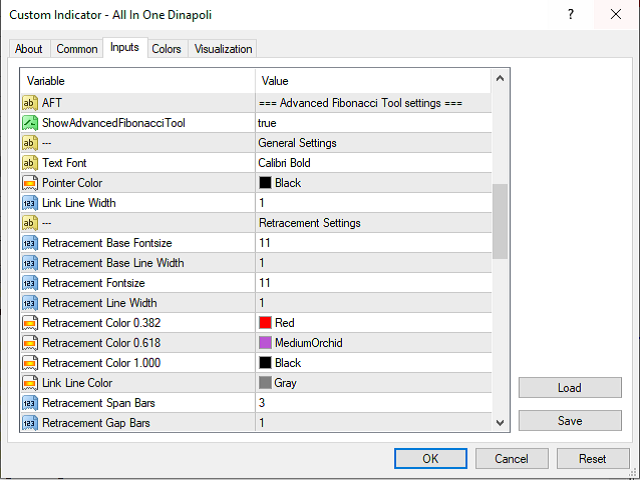
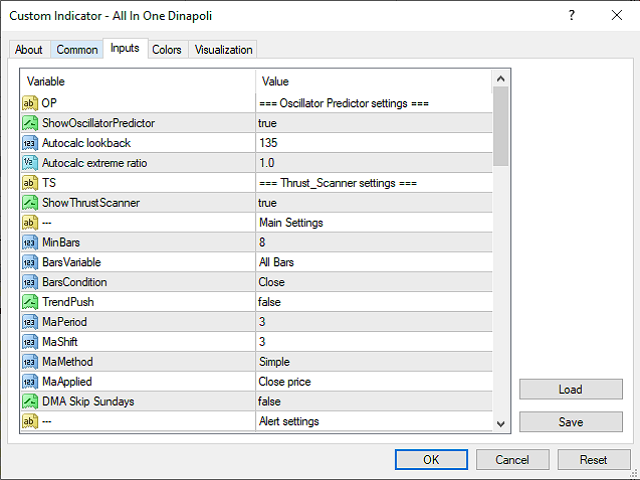
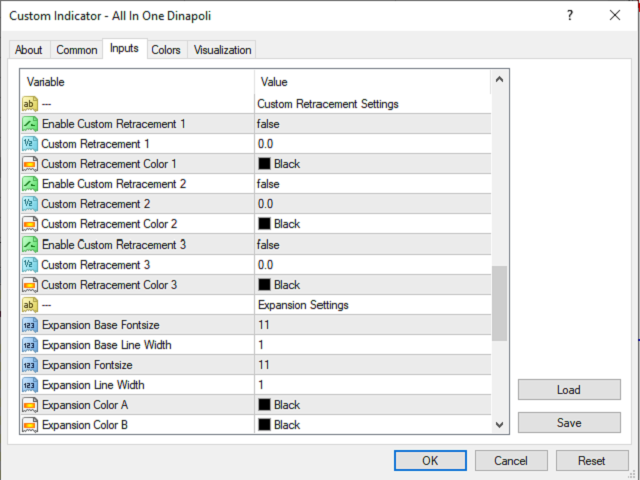
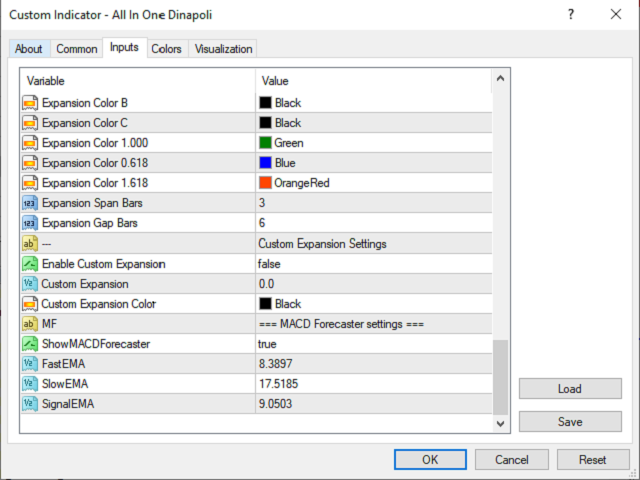
All in One package includes the Oscillator Predictor, MACD Predictor, Thrust Scanner and Advanced Fibonacci indicators which are mandatory for applying Dinapoli trade plans.
Please visit below links for detailed explanations of indicators.
Advanced Fibonacci Indicator => https://www.mql5.com/en/market/product/107933
Thrust Scanner Indicator => https://www.mql5.com/en/market/product/52829
Overbought /Oversold Predictor indicator => https://www.mql5.com/en/market/product/52628
Macd Predictor => https://www.mql5.com/en/market/product/52623
For MT4 Version; please visit ► https://www.mql5.com/en/market/product/52630
For My Other Products; please visit ► https://www.mql5.com/en/users/samil34
I bought these indicators about a month ago and already made a billion dollars. Jokes aside, if you're trading Dinapoli style you know what this is. Def worth the money.