• Visão global
  • Comentários (2)
  • Discussão (1)

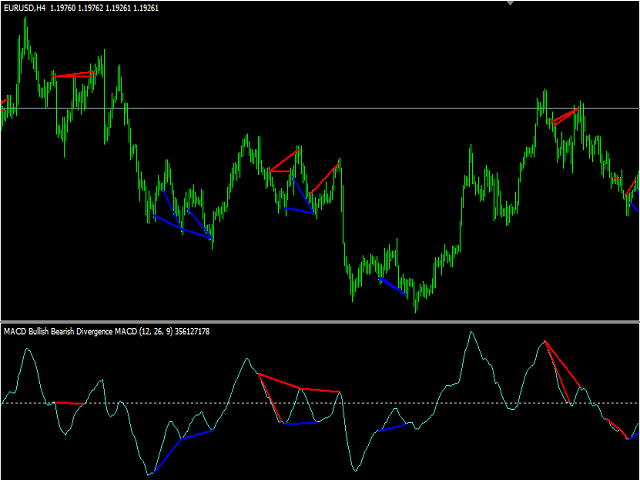
MACD Bullish Bearish Divergence

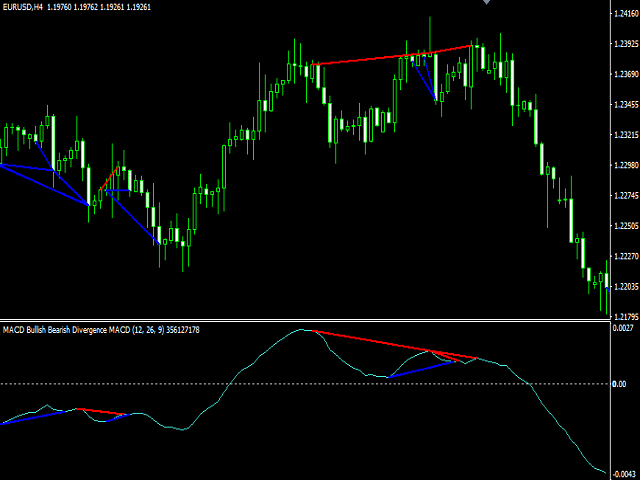
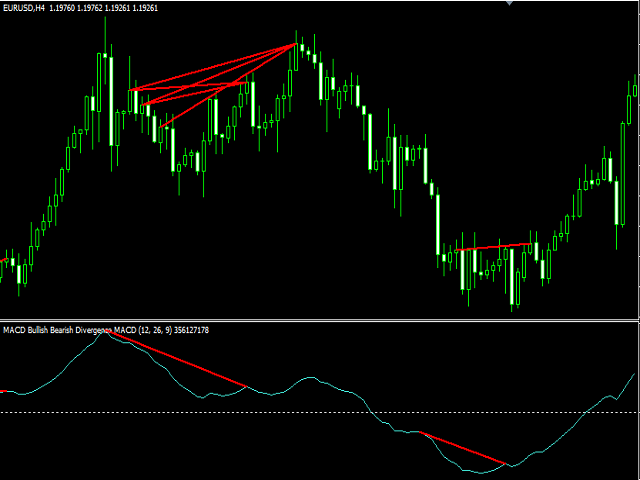
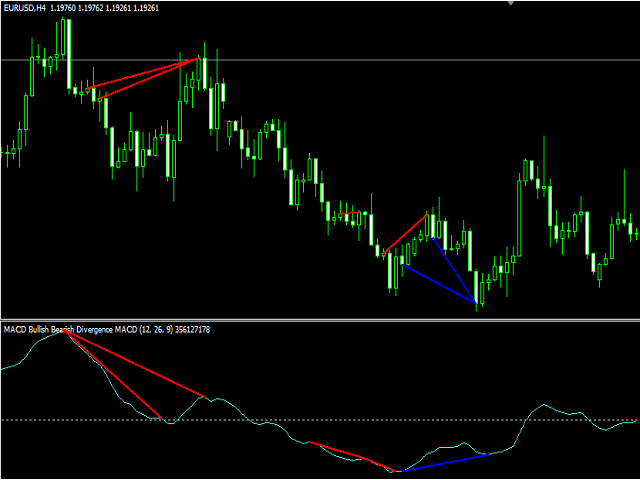
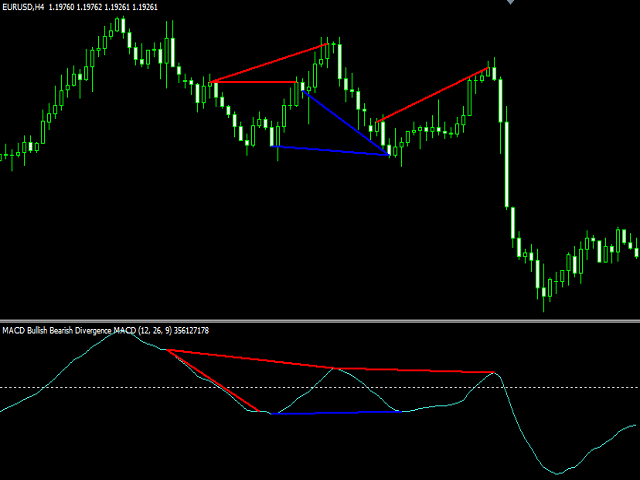
This indicator is designed to find the difference in MACD price and indicator.  This indicator shows the price and indicator difference on the screen. The user is alerted with the alert sending feature.


Parameters

  • divergenceDepth - Depth of 2nd ref. point search
  • Fast ema - Fast ema setting
  • Slow ema - slow ema setting
  • MACD sma - macd sma setting
  • indAppliedPrice - Applied price of indicator
  • indMAMethod - MA calculation method
  • findExtInterval - Price ext. to indicator ext.
  • marketAppliedPrice - Applied price of market
  • Alert - Alert on divergence?
  • Push - Notification on divergence?
  • showClassA - Show
  • bullsDivAColor - Color of bulls divergence line
  • bearsDivAColor - Color of bears divergence line
  • showClassB - Show
  • bullsDivBColor - Color of bulls divergence line
  • bearsDivBColor - Color of bears divergence line
  • showClassC - Show
  • bullsDivCColor - Color of bulls divergence line
  • bearsDivCColor - Color of bears divergence line
  • showHidden - Show
  • bullsDivHColor - Color of bulls divergence line
  • bearsDivHColor - Color of bears divergence line
  • indBarsCount - The number of bars to display


Produtos recomendados
TPM Cross (trend power moving cross) - is a trend following strategy based on custom signal points. Indicator consists from main custom moving chart line and trend power line. Indicator defines up and down movements by it's trend power and custom moving direction. When current market's trend looses it's power and opposite trend starts - power trend line  crosses moving and indicator plots an arrow.  Main indicator's adjustable inputs : movingPeriod - period of moving line  trendPeriod  - period
MACD Alerts MT4
KEENBASE SOFTWARE SOLUTIONS
KT MACD Alerts is a personal implementation of the standard MACD indicator available in Metatrader. It provides alerts and also draws vertical lines for the below two events: When MACD crosses above the zero line. When MACD crosses below the zero line. Features It comes with an inbuilt MTF scanner, which shows the MACD direction on every time frame.  A perfect choice for traders who speculate the MACD crossovers above/below the zero line. Along with the alerts, it also draws the vertical line
The indicator monitors the Dinapoli MACD trend in multiple timeframes for the all markets filtered and shows the results on Dashboard. Key Features Indicator can be used for all markets Monitors every timeframe, from 1 Min to Monthly Parameters UseMarketWatch: Set true to copy all symbols available in market watch MarketWatchCount : Set the number of symbols that you want to copy from the market watch list. CustomSymbols: Enter the custom symbols that you want to be available in dashboard.
The indicator monitors the MACD trend in multiple timeframes for a specific market. No more shifting in between charts to check the trend direction while trading. Key Features Indicator can be used for all markets Monitors every timeframe, from M1 to MN Able to move display label on chart by single click Indicator Usage The dashboard appears to the left and upper part of the chart when attached. The shell encapsulating a timeframe goes red on a down trend, green on an up trend. If the defaul
Trend Waves indicator is a trend indicator that uses Average True Range and Standard Deviation indications. It is aimed to find more healthy trends with this indicator. This indicator can be used alone as a trend indicator. Detailed review 4 different trend colors appear on this indicator.  The aqua color represents the rising trend. Dark aqua color means the train is getting weaker. pink color represents the downtrend trend. The dark pink color  means the trend is weaker. Parameters Stdeviati
This system never paints.   This system created by using Envolpes bands and reverse bar count.   This indicator is only working in M5 period.   This system is for long term and profitable.   Signals are shown as arrows. as an optional limit orders.   You can set a voice alarm or email notification.   You can fins our other products from link : https://www.mql5.com/en/users/drbastem/seller   Also, you can ask all your questins from email : haskayafx@gmail.com or mobile : +90 530 867 5076 or @Meh
Apresentando o Moving Average Crossover Scanner Pro, um multi-símbolo poderoso e versátil,       Período múltiplo       Indicador projetado para aprimorar suas decisões de negociação. Este indicador avançado incorpora cruzamentos de média móvel (MA) e oferece recursos adicionais para fornecer alertas rápidos e confiáveis. Com o Moving Average Crossover Scanner Pro, você pode se beneficiar das características únicas dos cruzamentos MA em vários pares de moedas e prazos. O painel abrangente do
Introducing the Consecutive Green/Red Candle Alert Indicator for MT4 - Your Trend Spotting Companion! Are you ready to take your trading to the next level? We present the Consecutive Green/Red Candle Alert Indicator, a powerful tool designed to help you spot trends and potential reversals with ease. Whether you're a new trader looking for clarity in the market or an experienced pro seeking additional confirmation, this indicator is your trusted companion. Key Features of the Consecutive Green/Re
FREE
" Valiant Strong Trend " - Your Ultimate MT4 Signal Indicator Are you ready to elevate your trading game to new heights? Look no further than the "Valiant Strong Trend" MT4 signal indicator, your indispensable tool for navigating the complex world of financial markets. Key Features: Precise Trend Identification : "Valiant Strong Trend" employs advanced algorithms to accurately identify market trends, whether they are bullish or bearish. Say goodbye to guesswork and hello to informed trading deci
Always Strong indicator, an indicator that uses MacD and Bollinger bands. It is a coded indicator to find trends. It finds these trends by its own algorithm. This indicator requires visual monitoring. It does not give any warning because it needs visual follow-up. The main trendline should turn down to find the down trend. The main trend line should go under the white line and then go under the yellow line. The main trendline should turn upward to find the upward trend. The main trend line shoul
This indicator is designed to find the difference in RSI price and indicator.  This indicator shows the price and indicator difference on the screen. The user is alerted with the alert sending feature. Our Popular Products Super Oscillator HC Cross Signal Super Cross Trend Strong Trend Super Signal Parameters divergenceDepth -   Depth of 2nd ref. point search RSI_Period -   Second calculation period indAppliedPrice -   Applied price of indicator indMAMethod -   MA calculation method findExtInt
FREE
Introducing the Austin Trend Scanner: Your Ultimate Tool for Timely Trend Identification. The Austin Trend Scanner is a groundbreaking MetaTrader 4 indicator meticulously engineered to provide traders with precise trend reversal signals across multiple timeframes. Built upon advanced algorithms and non-repainting technology, this indicator offers unparalleled accuracy in identifying profitable trading opportunities. Key Features: 1. Non-Repainting Signals: The Austin Trend Scanner delivers n
Stronger Trend is an indicator that generates trend signal. It generates trend signal with its own algorithm. These arrows give buying and selling signals. The indicator certainly does not repaint. Can be used in all pairs. Sends a signal to the user with the alert feature. Trade rules Enter the signal when the buy and sell signal arrives. Processing should only be initiated when signal warnings are received. It is absolutely necessary to close the operation when an opposite signal is received
MoveWave
Andriy Sydoruk
MoveWave - Moving waves are very handy indicators for determining pivot levels. Most Forex traders make decisions based on technical analysis. This type of analysis determines patterns and trends in the market. With the help of complex mathematical equations that are combined and made out in the form of this indicator, the trader will be able to more accurately determine the price reversal levels. Wave theory mathematically represents various behavioral models of the market. It is used as the ba
The Strong Volume Trend  MT4 indicator is a powerful tool designed to help traders identify and capitalize on significant volume trends in the financial markets. With its advanced algorithm, this indicator accurately detects the strength and direction of volume movements, allowing traders to make informed trading decisions. Features: Volume Strength Analysis: The indicator analyzes the volume data and identifies strong volume trends, helping traders spot potential market reversals, breakouts, or
PLEASE NOTE:   You can  customize the settings of all 3 EMA as per your requirement. The accuracy will change as per your settings. 100% Non repaint Pre-alert (get ready) signals Non-delay indications 24/7 signals 100% No lag No recalculating Lifetime license This is a EMA crossover indicator and its 100% non repaint indicator. The EMA_1 and the EMA_2 is based on which signal is generated. EMA_3 is a Higher EMA value which will remain below or above the candle (market) to identify the trend. M
Real Magic Trend
Muhammed Emin Ugur
This   Real Magic Trend   indicator is designed for signal trading. This indicator generates trend signals. It uses many algorithms and indicators to generate this signal. It tries to generate signals from the points with the highest trend potential. This indicator is a complete trading product. This indicator does not need any additional indicators. The indicator is never repainted. The point at which the signal is given does not change.      Features and Recommendations Time Frame
This indicator prepared by using 311,1298 days Haskaya Trend Bandse and Calculates the strand ADX.    This system can be used for 5M time frame.     This system is for Long term and profitable.    Signals are shown as arrows. as an optional,    you can set a voice alarm or email notification    You can fins our other products from link : https://www.mql5.com/en/users/drbastem/seller    Also, you can ask all your questins from email : haskayafx@gmail.com or mobile : +90 530 867 5076 or @Meh
Macd Rd MT4
Mubashir Mohamed Quraish Albarakat
This indicator is based on the MACD indicator Also, some candlestick patterns are used in it to identify better signals Can be used in all symbols Can be used in all time frames Easy to use method Adequate settings Settings: period: The number of candles used to calculate signals. pFast: Like the MACD indicator settings pSlow: Like the MACD indicator settings alarmShow: If you want to receive an alert in Metatrader after receiving the signal, enable this setting alarmShowNoti: If you
FREE
Real Trend Lines is an indicator that calculates trends using a set of channels and using a set of algorithms. This indicator helps to find trend return points. It generally represents an oscillator. This trend tracking system helps the investor to understand small or large trends and determines the direction according to it. Trending features Up trend Rule 1 - yellow trend line should be below zero level. Rule 2 - the yellow trend line should be in the green and orange channel. Rule 3 - the t
Introducing the Donchian Channels indicator for MQL4, a powerful technical analysis tool designed to boost your trading success. This indicator consists of four lines that represent the upper and lower boundaries of price movement over a specified period. With the Donchian Channels indicator, you can easily identify potential breakouts and reversals in the market. The upper line shows the highest high of the specified period, while the lower line represents the lowest low. The space between thes
M1Arrows is a MT4 trend arrows Indicator * Smart Scalper Setup (M1) :: Signal 5 Main 20 + Signal 20 Main 80 + Fibonacci ZigArcs 20 (Screenshot1) Add the indicator with first setting, then add it again to the same graph with other settings. You can add as many as you want, but 2 M1Arrows in just one graph is enought Never open orders againt the slow setting trend Do not open more than 3 orders per slow setting trend It will work better in Europe/USA markets, * M15 Day Trade Setup: Sig
FREE
This scanner shows the trend values of the well known indicator SuperTrend for up to 30 instruments and 8 time frames. You can get alerts via MT4, Email and Push-Notification as soon as the direction of the trend changes. This is the FREE version of the indicator: SuperTrend Scanner The free version works only on EURUSD and GBPUSD! Important Information How you can maximize the potential of the scanner, please read here: www.mql5.com/en/blogs/post/718074 With the following FREE indicator you
FREE
Th3 BarPlay Signals Mt4
Nnamdi Kennedy Ifeorah
Esta é uma estratégia baseada em ação de preço conhecida como 3Bar_Play e é baseada na formação do padrão de velas 3Bar. Indicadores adicionais são adicionados para filtro e confirmações antes de aparecer as setas de sinal de compra/venda. Pode ser negociado em um mercado de tendência de alta, tendência de baixa ou lateral. Os indicadores adicionados incluem: Estocástico - Momento Fisher - Tendência ATR - Volatilidade que também define claramente a colocação de Stop-Loss na base da seta de sina
Using the Arrow Effect forex indicator algorithm, you can quickly understand what kind of trend is currently developing in the market. The Elephant indicator accompanies long trends, can be used without restrictions on instruments or timeframes. With this indicator, you can try to predict future values. But the main use of the indicator is to generate buy and sell signals. The indicator tracks the market trend, ignoring sharp market fluctuations and noises around the average price. The indicator
VJ Pivot Levels
Vijayaratna Kumar Boda
4.4 (5)
Introduction: Whatever trading method you use, it is important to know the Pivot levels to take the key attention for your entries & exits. This indicator has been made using the standard classic formula for Auto drawing the Pivot levels. Also based on the previous day trading range, the probable expected today trading range has been highlighted in a different color for your reference. Output of the Indicator: This Indicator gives the Pivot level Different resistance Levels Different Support l
Super MA Trend
Harun Celik
5 (1)
Super MA Trend indicator is an indicator designed to find trends. It uses a moving average, a set of candle combinations and High/Low levels to find trends. This indicator is a complete trading system. You can trade with this indicator as you like. Features and Recommendations You can use this indicator on all pairs except for the volatile pairs. It is recommended to use it on M15 and over graphics. The most important element in this indicator are alerts. Do not open orders unless you receive
UPD1 Rsi Dots Dashboard
Vitaliy Kuznetsov
5 (1)
O indicador mostra sinais baseados no oscilador RSI terminal no gráfico. É possível filtrar sinais repetidos. Aqui, o oscilador é usado para procurar um sinal reverso. É recomendado como um ponto de entrada em estratégias de swing e negociação a partir de níveis. Um painel multi-moeda está disponível. Com ele, você pode alternar facilmente entre os gráficos. Nas discussões de produtos, você pode sugerir um algoritmo no qual pode incorporar um painel. Parametro. Configurações Principais.
FREE
MACD TrendMA
Dmitriy Moshnin
The MACD TrendMA indicator is a trading system developed on the basis of the MACD indicator popular among many traders, and which is based on measuring the inclination (trend) angle of the moving averages, while measuring the ratio (convergence/divergence) between them. The signal for entering/exiting the market is the frame of the bars colors and color of the MACD TrendMA histogram according to the trend, which can be customized in the properties window of the indicator - in case the inclinatio
DeM Candles AM
Andriy Matviyevs'kyy
The indicator identifies the strength of the trend based on the points where the DeMarker indicator exceeds the overbought and oversold levels. The indicator does not redraw. This indicator: Suitable for all markets;  Not redrawn; Intuitive and simple; It can be useful for both beginners and experienced traders; Allows you to identify market entry points where there is a high probability of a significant price movement sufficient for a successful transaction; Settings: Ind_Period (>1)   - peri
FREE
Os compradores deste produto também adquirem
Gann Made Easy
Oleg Rodin
4.96 (46)
Gann Made Easy é um sistema de negociação Forex profissional e fácil de usar, baseado nos melhores princípios de negociação usando a teoria do sr. W. D. Gann. O indicador fornece sinais precisos de COMPRA e VENDA, incluindo níveis de Stop Loss e Take Profit. Você pode negociar mesmo em movimento usando notificações PUSH. Entre em contato comigo após a compra! Vou compartilhar minhas dicas de negociação com você e ótimos indicadores de bônus de graça! Provavelmente você já ouviu muitas vezes sobr
Atomic Analyst
Issam Kassas
5 (1)
Primeiramente, vale ressaltar que este Indicador de Negociação não repinta, não redesenha e não apresenta atrasos, tornando-o ideal tanto para negociação manual quanto automatizada. O Analista Atômico é um Indicador de Ação de Preço PA que utiliza a força e o momentum do preço para encontrar uma vantagem melhor no mercado. Equipado com filtros avançados que ajudam a remover ruídos e sinais falsos, e aumentam o potencial de negociação. Utilizando múltiplas camadas de indicadores complexos, o A
Gold Stuff
Vasiliy Strukov
4.89 (250)
Gold Stuff-um indicador de tendência projetado especificamente para o ouro, também pode ser usado em qualquer instrumento financeiro. O indicador não é redesenhado ou atrasado. O timeframe recomendado é H1. O EA Gold Stuff Expert Advisor está escrito neste indicador, você pode encontrá-lo no meu perfil. Importante! Entre em contato comigo imediatamente após a compra para obter instruções e bônus! PARÂMETRO Draw Arrow-incl.desligado. desenhar setas no gráfico. Alertas-ligado.desligado.al
Scalper Vault
Oleg Rodin
5 (27)
Scalper Vault é um sistema profissional de escalpelamento que fornece tudo o que você precisa para um escalpelamento bem-sucedido. Este indicador é um sistema de negociação completo que pode ser usado por comerciantes de forex e opções binárias. O período de tempo recomendado é M5. O sistema fornece sinais de seta precisos na direção da tendência. Ele também fornece sinais superiores e inferiores e níveis de mercado Gann. Os indicadores fornecem todos os tipos de alertas, incluindo notificações
ACTUALMENTE COM 26% DE DESCONTO A melhor solução para qualquer novato ou comerciante especializado! Este Indicador é uma ferramenta comercial única, de alta qualidade e acessível, porque incorporámos uma série de características proprietárias e uma nova fórmula. Com apenas UM gráfico, pode ler a força da moeda para 28 pares de Forex! Imagine como a sua negociação irá melhorar porque é capaz de apontar o ponto exacto do gatilho de uma nova tendência ou oportunidade de escalada? Manual do u
Trend Screener
STE S.S.COMPANY
4.83 (86)
Indicador de tendência, solução única inovadora para negociação e filtragem de tendências com todos os recursos de tendências importantes construídos dentro de uma ferramenta! É um indicador multi-timeframe e multi-moedas 100% sem repintura que pode ser usado em todos os símbolos/instrumentos: forex, commodities, criptomoedas, índices e ações. O Trend Screener é um indicador eficiente que segue a tendência do indicador que fornece sinais de tendência de seta com pontos no gráfico. Os recursos qu
Actualmente 20% OFF ! A melhor solução para qualquer novato ou comerciante especializado! Este software de painel de instrumentos está a funcionar em 28 pares de moedas. É baseado em 2 dos nossos principais indicadores (Advanced Currency Strength 28 e Advanced Currency Impulse). Dá uma grande visão geral de todo o mercado Forex. Mostra valores avançados de força da moeda, velocidade de movimento da moeda e sinais para 28 pares de divisas em todos os (9) períodos de tempo. Imagine como a sua
Antes de tudo, vale ressaltar que esta Ferramenta de Negociação é um Indicador Não Repintante, Não Redesenhante e Não Atrasado, o que a torna ideal para negociação profissional. O Indicador de Conceitos de Ação de Preço Inteligente é uma ferramenta muito poderosa tanto para traders novos quanto experientes. Ele combina mais de 20 indicadores úteis em um único, combinando ideias avançadas de negociação como Análise do Trader do Círculo Interno e Estratégias de Negociação de Conceitos de Dinhei
TPSproTREND PrO
Roman Podpora
5 (15)
TPSpro TRENDPRO  - is a trend indicator that automatically analyzes the market and provides information about the trend and each of its changes, as well as giving signals for entering trades without redrawing! The indicator uses each candle, analyzing them separately. referring to different impulses - up or down impulse. Exact entry points into transactions for currencies, crypto, metals, stocks, indices!  -  Version MT5               DETAILED DESCRIPTION        /       TRADING SETUPS           
Scalper Inside PRO
Alexey Minkov
4.75 (55)
SALE NOW! Limited Time Offer! An exclusive indicator that utilizes an innovative algorithm to swiftly and accurately determine the market trend. The indicator automatically calculates opening, closing, and profit levels, providing detailed trading statistics. With these features, you can choose the most appropriate trading instrument for the current market conditions. Additionally, you can easily integrate your own arrow indicators into Scalper Inside Pro to quickly evaluate their statistics and
Apresentando       Quantum Trend Sniper Indicator   , o inovador Indicador MQL5 que está transformando a maneira como você identifica e negocia as reversões de tendência! Desenvolvido por uma equipe de traders experientes com experiência comercial de mais de 13 anos,       Indicador de Atirador de Tendência Quântica       foi projetado para impulsionar sua jornada de negociação a novos patamares com sua forma inovadora de identificar reversões de tendência com precisão extremamente alta. ***C
Torne-se um Negociador Breaker e lucre com as mudanças na estrutura do mercado à medida que o preço reverte. O indicador de quebra de bloco de pedidos identifica quando uma tendência ou movimento de preço está chegando à exaustão e pronto para reverter. Ele o alerta sobre mudanças na estrutura do mercado, que normalmente ocorrem quando uma reversão ou uma grande retração está prestes a ocorrer. O indicador usa um cálculo proprietário que identifica rupturas e momento do preço. Toda vez que
Descubra o segredo da negociação forex bem -sucedida com nosso indicador MT4 personalizado! Você já se perguntou como obter sucesso no mercado de Forex, obtendo lucros consistentemente e minimizando o risco? Aqui está a resposta que você está procurando! Permita -nos apresentar nosso indicador proprietário do MT4 que revolucionará sua abordagem à negociação. Versatilidade única Nosso indicador foi projetado especialmente para usuários que preferem as formações de vela Renko e Rangebar. En
Quantum Breakout Indicator PRO
Bogdan Ion Puscasu
4.96 (26)
Apresentando       Quantum Breakout PRO   , o inovador Indicador MQL5 que está transformando a maneira como você negocia Breakout Zones! Desenvolvido por uma equipe de traders experientes com experiência em negociação de mais de 13 anos,   o Quantum Breakout PRO   foi projetado para impulsionar sua jornada comercial a novos patamares com sua estratégia inovadora e dinâmica de zona de rompimento. O Quantum Breakout Indicator lhe dará setas de sinal em zonas de breakout com 5 zonas-alvo de luc
Advanced Supply Demand
Bernhard Schweigert
4.92 (310)
Atualmente com 33% de desconto! A melhor solução para qualquer Trader Novato ou especialista! Este indicador é uma ferramenta de negociação exclusiva, de alta qualidade e acessível porque incorporamos uma série de recursos proprietários e uma nova fórmula. Com esta atualização, você poderá mostrar fusos horários duplos. Você não só será capaz de mostrar um TF mais alto, mas também mostrar ambos, o TF do gráfico, MAIS o TF mais alto: MOSTRANDO ZONAS ANINHADAS. Todos os traders de Oferta e Demanda
ALERTA DE COMPRA E VENDA MULTICURRENCY e MULTITIMEFRAME. PARADA DE TRAILING AUTOMÁTICO E RECOMPENSA DE RISCO TAKEPROFIT! O INDICADOR VARREDURA E ANALIZA O MERCADO PARA VOCÊ NÃO TER NADA PARA FAZER! NEGOCIE TODAS AS SUAS MOEDAS EM 1 TABELA!   Após a compra deixe um comentário entre em contato comigo e eu lhe enviarei o assistente comercial EA. O indicador usa vários osciladores e filtros anexados para encontrar os melhores pontos de entrada CONFIRMADOS, então você não precisa se preocupar
TPSpro RFI Levels
Roman Podpora
5 (13)
A key element in trading is zones or levels from which decisions to buy or sell a trading instrument are made. Despite attempts by major players to conceal their presence in the market, they inevitably leave traces. Our task was to learn how to identify these traces and interpret them correctly. Reversal First Impulse levels (RFI)   -  Version MT5                INSTRUCTIONS                 RUS                 ENG                                       R ecommended to use with an indicator   -  
Apresentamos o Indicador Milagroso de Forex: Desencadeie o Poder da Negociação Precisa Você está cansado de procurar o melhor indicador de Forex que realmente ofereça resultados excepcionais em todos os períodos de tempo? Não procure mais! O Indicador Milagroso de Forex chegou para revolucionar sua experiência de negociação e impulsionar seus lucros a novas alturas. Construído com base em tecnologia de ponta e anos de desenvolvimento meticuloso, o Indicador Milagroso de Forex se destaca como o á
Entry Points Pro
Yury Orlov
4.7 (225)
Este é um indicador para MT4 que fornece sinais precisos para entrar em uma negociação sem redesenhar. Ele pode ser aplicado a qualquer ativo financeiro: forex, criptomoedas, metais, ações, índices. Ele fornecerá estimativas bastante precisas e informará quando é melhor abrir e fechar um negócio. Assista o vídeo (6:22) com um exemplo de processamento de apenas um sinal que compensou o indicador! A maioria dos traders melhora seus resultados de negociação durante a primeira semana de negociação c
Break and Retest
Mohamed Hassan
5 (2)
Break & Retest is unstoppable when combined with our other divergence indicator. After purchase, send us a message and you could get this  2nd indicator  for  FREE  as a  BONUS! ‍You can visually backtest Break & Retest to see how it behaved in the past!    Manual guide:   Click here $59  for the first 25 copies ( 7  left)! Next price is $120 .  After many months of hard work and dedication, we are extremely proud to present you our  Break and Retest price action indicator crea
TrendMaestro
Stefano Frisetti
5 (2)
note: this indicator is for METATRADER4, if you want the version for METATRADER5 this is the link: TRENDMAESTRO recognizes a new TREND in the bud, he never makes mistakes. The certainty of identifying a new TREND is priceless. DESCRIPTION TRENDMAESTRO identifies a new TREND in the bud, this indicator examines the volatility, volumes and momentum to identify the moment in which there is an explosion of one or more of these data and therefore the moment in which prices have strong probability of f
FX Power MT4 NG
Daniel Stein
5 (8)
Receba a sua atualização diária do mercado com detalhes e screenshots através do nosso Morning Briefing aqui no mql5 e no Telegram ! O FX Power MT4 NG é a próxima geração do nosso medidor de força de moeda muito popular de longa data, o FX Power. E o que é que este medidor de força da próxima geração oferece? Tudo o que adorou no FX Power original MAIS Análise de força GOLD/XAU Resultados de cálculo ainda mais precisos Períodos de análise configuráveis individualmente Limite de cálculo personal
Trend Forecasting
Mohamed Hassan
5 (15)
This indicator is unstoppable when combined with our other indicator called Katana. After purchase, send us a message and you could get Katana for FREE as a BONUS After purchase, send us a private message for your instructions.  MT5 version: click here 40 copies available at $55. There are 3 copies left before the next price of $105. Don't miss this great deal!  The Trend Forecasting indicator is a very unique & easy tool that is able to make prediction about future price movement
Price Action Entry Alerts
Stephen Sanjeeve Sahayam
5 (3)
Este indicador analisa cada barra de pressão de compra ou venda e identifica 4 tipos de padrões de velas com o maior volume. Essas velas são filtradas usando vários filtros lineares para mostrar sinais de compra ou venda. Os sinais funcionam melhor, em conjunto com a direção do período de tempo mais alto e quando negociados durante as horas de alto volume. Todos os filtros são personalizáveis ​​e funcionam de forma independente. Pode visualizar sinais de uma única direção com o clique de um bot
ACTUALMENTE 31% DE DESCONTO!! A melhor solução para qualquer novato ou comerciante especializado! Este indicador é uma ferramenta comercial única, de alta qualidade e acessível, porque incorporámos uma série de características proprietárias e uma fórmula secreta. Com apenas UM gráfico, dá alertas para todos os 28 pares de moedas. Imagine como a sua negociação irá melhorar porque é capaz de identificar o ponto exacto de desencadeamento de uma nova tendência ou oportunidade de escalada! Con
TrendDecoder Premium
Christophe, Pa Trouillas
5 (3)
Identifica os intervalos e os próximos movimentos prováveis   |  Obter os primeiros sinais e a força das tendências   |  Obter saídas claras antes da reversão   |  Detetar os níveis Fibo que o preço irá testar Indicador não repintável e não atrasado - ideal para trading manual e automatizado - adequado para todos os activos e todas as unidades de tempo Oferta por tiempo limitado >>   50% OFF Após a compra,   por favor contacte-me neste canal  para obter as definições recomendadas Versão   MT5 :
Currency Strength Wizard é um indicador muito poderoso que fornece uma solução completa para uma negociação bem-sucedida. O indicador calcula o poder deste ou daquele par forex usando os dados de todas as moedas em vários intervalos de tempo. Esses dados são representados em uma forma de índice de moeda fácil de usar e linhas de energia de moeda que você pode usar para ver o poder desta ou daquela moeda. Tudo o que você precisa é anexar o indicador ao gráfico que deseja negociar e o indicador mo
O Indicador de Reversão ADR mostra rapidamente onde o preço está sendo negociado atualmente em relação ao seu intervalo médio diário normal. Você receberá alertas instantâneos via pop-up, e-mail ou push quando o preço exceder seu intervalo médio e níveis acima dele de sua escolha, para que você possa saltar rapidamente para retrocessos e reversões. O indicador desenha linhas horizontais no gráfico nos extremos médios do intervalo diário e também extensões acima daqueles níveis que têm probabili
FX Volume
Daniel Stein
4.6 (35)
Receba a sua atualização diária do mercado com detalhes e screenshots através do nosso Morning Briefing aqui no mql5 e no Telegram ! O Volume FX é o PRIMEIRO e ÚNICO indicador de volume que fornece uma visão REAL do sentimento do mercado do ponto de vista de um corretor. Ele fornece uma visão incrível de como os participantes do mercado institucional, como corretores, estão posicionados no mercado Forex, muito mais rápido do que os relatórios COT. Ver essas informações diretamente no seu gráfi
Antes de mais nada, vale ressaltar que este Sistema de Negociação é um Indicador Não Repintado, Não Redesenhado e sem Atrasos, o que o torna ideal para negociações profissionais. O "Sistema de Negociação de Suporte e Resistência Inteligente" é um indicador avançado projetado para traders novos e experientes. Empodera os traders com precisão e confiança no mercado forex. Este sistema abrangente combina mais de 7 estratégias, 10 indicadores e vários métodos de negociação, incluindo estratégias
Mais do autor
Super Trend Bars is a trend finding indicator. It tries to find the trends that are most likely to trend. A set of indicators and a set of algorithms. Trend probability changes color when it finds a high trend. The red color represents the declining trend. The lime color represents the upward trend. Super Trend Bar changes color when it finds a trend. Features This indicator is a trend indicator by itself. It can operate without the need for additional indicators. When you see the first lime c
Multiple RSI
Harun Celik
4.5 (2)
Multiple RSI indicator works based on the standard RSI indicator. This indicator will display the RSI indicator from different timeframes on one screen. You will see the RSI indicator for all timeframes on one screen. This indicator saves you from constantly changing charts. At the same time you can analyze the operations of other graphs relative to each other. Features This indicator shows the RSI graph of the timeframe you are working on and the upper timeframe graphs. For example, if you ru
FREE
The High and Low Points indicator is designed to calculate potential order points. The main feature of this indicator is to specify the points that the price can not exceed for a long time. The market always wants to pass points that can not pass. It is necessary to place an order waiting for this point indicated by this indicator. Is an indicator that constitutes many EA strategies. Designed for manual trading. Transaction Strategies High point buy stop order Low point sell stop order For exa
HC Cross Signal
Harun Celik
5 (2)
This indicator uses Donchian channel and ATR indicators. This trend tracking system uses historical data to buy and sell. This indicator does not repaint. The point at which the signal is given does not change. You can use it in all graphics. You can use it in all pairs. This indicator shows the input and output signals as arrows and alert. Open long deals on blue arrows Open short deals on red arrows When sl_tp is set to true, the indicator will send you the close long and close short warnings.
Are you tired of channeling? This indicator is designed to draw channels. Triple graphics channels, automatically installs 3 different graphics channels. These channels are shown on a single graphic. These channels are calculated by a number of different algorithms. Automatically draws on the screen. You can select three time zones. Parameters Period1 - from here you can select the first period. It can be selected from 1 minute time period to monthly time period. Period1_Channel_Color - period
‌This indicator indicates potential entry points. Rsi indicator and console wax combination. In addition to the signals in the graphic arrows, text comments are also used. Features Works on any currency pairs. It works in all periods. Sensitivity setting. You can set the signal frequency. Use recommended standard settings. ‌The greatest feature of this display is the possibility of manual martingale. The signal intensity region tends to go in the direction of the signal. Works on all charts.
Pivot Trend
Harun Celik
5 (2)
Pivot trend indicator is a trend indicator that uses standard pivot calculation and some indicators. The purpose of the indicator is to calculate the possible trends using the pivot point. And to give the user an idea about trend direction. You can use this display as a trend indicator. Or with other indicators suitable for your strategy. Features The green bar represents the upward trend. The red bar represents the downward trend. The blue pivot point represents the upward trend. The yellow p
Strong trend indicator is a special indicator designed to capture healthy signals. There are lines showing the signal of the indicator and the power of buying and selling. The signal line is yellow. The green lines are Buy lines. The ones that are brown are Sell lines. The green line must close above the yellow line to perform the operation. The brown line must close above the yellow line to sell. The important line is the first one that closes above the yellow line. If the first line is green,
Trend Guess
Harun Celik
3 (2)
The ”Trend Guess” is a complex software that does not involve the MACD, RSI or moving averages. It adapts itself to current market conditions using complicated algorithms based on price action and out custom indicators. The indicator will gives you trading signals Buy or Sell stop loss levels indicated in the popup alert window and graphically. You have to do is to press buy or sell button whenever you get a signal Important Rules Identify a current long term trend. Example – if you trade on a
Box martingale system is an indicator designed to trade martingale. This indicator sends a signal from the highest point where the trend is likely to return. With these signals the user starts the trades. These signals appear in the form of a box. The user can see from which point the signal is given. The important thing in trading martingale is to find a good starting point. This indicator provides this starting point. Trade rules Start processing when the first trade signal arrives. The impo
HC candlestick pattern is a simple and convenient indicator able to define candle patterns.‌ Candlestick charts are a type of financial chart for tracking the movement of securities. They have their origins in the centuries-old Japanese rice trade and have made their way into modern day price charting. Some investors find them more visually appealing than the standard bar charts and the price action is easier to interpret. Hc candlestick pattern is a special indicator designed to find divergence
Face smiling trend indicator is an oscillator designed to search for turning points. Face smiling trend indicator represents an oscillator that uses in his work an average price for a certain period and is designed to determine the price reversal points. Face smiling trend indicator oscillates between 0.00 (oversold) and 105 (overbought) values depending upon market conditions. Red bars suggest bearish pressure and blue bars bullish pressure. Typically, a reversal of the trend occurs when achiev
The Stubborn Scalper indicator can run in any currency pair and at any time interval. The larger the time interval, the less false signals are obtained. Always choose a larger time interval for healthy signals. Trade rules Turn on the Buy action when the Stubborn Scalper indicator turns blue and the trend up warning is displayed. The Stop Loss is set to the level at the end of the green circle. Turn off the operation when the Stubborn Scalper indicator is green or red. Turn on the Sell action
Big Trend Signal   indicator is designed for trend and signal trading. This indicator generates trend signals.  It uses many algorithms and indicators to generate this signal. It tries to generate a signal from the points with the highest trend potential. This indicator is a complete trading product. This indicator does not need any additional indicators.  You can only trade with this indicator. The generated signals are displayed on the graphical screen.  Thanks to the alert features you can ge
This indicator is designed to find the difference in price and indicator. This indicator uses various indicators. These indicators RSI, Macd, Momentum, RVI, Stochastic, Standard deviation, Derivative, Williams, and custom. You can use these indicators by selecting the indicator type section. This indicator shows the price and indicator difference on the screen. Indicators are individually selectable. You can use the custom type to enter the desired parameters. The user is alerted with the alert
Undefeated trend indicator, an indicator that uses MacD and Bollinger bands. It is a coded indicator to find trends. It finds these trends by its own algorithm. This indicator requires visual monitoring. It does not give any warning because it needs visual follow-up. The main trendline should turn down to find the down trend. The main trend line should go under the white line and then go under the yellow line. The main trendline should turn upward to find the upward trend. The main trend line sh
Super signal series magic arrows is an indicator that generates trade arrows. It generates trade arrows with its own algorithm. These arrows give buying and selling signals. The indicator certainly does not repaint. Can be used in all pairs. Sends a signal to the user with the alert feature. Trade rules Enter the signal when the buy signal arrives. In order to exit from the transaction, an opposite signal must be received. It is absolutely necessary to close the operation when an opposite sign
This indicator is designed to filter trends. Using the RSI indicator we know. It is aimed to confirm trends with this indicator. Can be used alone. It can be used as an indicator to help other indicators. He is already a trend indicator. You can confirm the signals given by other indicators according to your strategy with this indicator. The RSI Trend Filtering indicator confirms trends using a number of complex algorithms. Red below trend zero represents the downward trend. If trend is blue abo
Colored trend indicator is a trend indicator that uses Average True Range and Standard Deviation indications. It is aimed to find more healthy trends with this indicator. This indicator can be used alone as a trend indicator. Detailed review 4 different trend colors appear on this indicator. The blue color represents the upward trend. The dark blue color has a tendency to decline after rising from the rising trend. The red color represents the declining trend. The dark red color has a tendency
Super signal series trend arrows is an indicator designed to generate trading signals. This indicator uses a number of different indicators and generates a signal using a number of historical data. It generally tries to calculate the trend return points. These trend returns may be sometimes very large, sometimes small. The investor should act with the belief that the signal may be small. Monthly median produces 5 to 10 signals. These signals vary according to market conditions. The signals do no
The EMA Trend indicator is a trend indicator using two moving averages. These two moving average is the main trend indicator with 89 EMA. 89 EMA is generally regarded as a trend in the Forex market. The second moving average is 49 EMA. A trend was created using two moving averages. You can use this display alone as a trend indicator. Or with other indicators suitable for your strategy. This indicator sends a warning every new trend starts. Features You can select and edit the periods. Time fra
Every successful trader knows what support and resistance spots are working. And always know that these points need to be kept in mind. They always trade according to this point. The support and resistance point indicator operates in two different modes. The first is the standard support and resistance points we know. The second is Fibonacci levels. This indicator automatically calculates and displays the support and resistance points on the screen. Features You can select the time frame you w
Real Trend Lines is an indicator that calculates trends using a set of channels and using a set of algorithms. This indicator helps to find trend return points. It generally represents an oscillator. This trend tracking system helps the investor to understand small or large trends and determines the direction according to it. Trending features Up trend Rule 1 - yellow trend line should be below zero level. Rule 2 - the yellow trend line should be in the green and orange channel. Rule 3 - the t
Super signal series mystery arrows is an indicator designed to generate trading signals. This indicator uses a number of different indicators and generates a signal using a number of historical data. Currency pairs:  Any Time interval:  M5, M15, M30. Suggested M5 Work with at least 20 pairs Parameters AlertsOn -  send alerts. If this feature is activated, it will be activated in other warning properties. AlertsMessage -  send a message AlertsSound -  sound alert setting AlertsEmail -  email al
Super oscillator indicator is an oscillator designed to calculate trend reversal points. A set of bar calculations and a set of algorithms to calculate trend reversals. Level probing system with high probability trends. All of these features combine to make it easier for investors to find trends. Suggestions and Features There are two levels on the super oscillator indicator. They are at levels of 0.5 and -0.5. The oscillator bar should be below -0.5 to find the upward trend. And a blue color
The super oscillator trading system is a trend finding tool. This system consists of a few indicators and a few algorithms. The aim of this indicator is to direct the investor to find healthy trends. Trade Rules This indicator has two channel lines. These channels are red lines below zero and above zero. There is a line in two places to process. These are blue lines. There is one trend line, the yellow line. Up trend rules Rule 1 - the yellow trend line should close below the red line below th
The trend beads indicator is software that does not include trend indicators such as moving average, Bollinger bands. This indicator works entirely with price and bar movements. The purpose of the indicator is to calculate the most likely trends. To assist the user in determining trend trends. The user determines the trend direction with the colors on the screen. You can use this indicator alone as a trend indicator. Or with other indicators suitable for your strategy. Trade Rules Rising trend
The I Return Signal indicator is a product designed for signal trading. This indicator works by using a number of factors such as a set of indicators, recent history data, bar combinations, price movements, custom filtering system and various algorithms. It uses all of these factors at the same time and generates turn signals. The signals are generated by calculating from the highest possible points of the signal. This indicator is easy to use and understandable. Thanks to the warning features,
The Super Cross Trend indicator is designed for trend and signal trading. This indicator generates trend signals. It uses many algorithms and indicators to generate this signal. It tries to generate a signal from the points with the highest trend potential. This indicator is a complete trading product. This indicator does not need any additional indicators. You can only trade with this indicator. The generated signals are displayed on the graphical screen. Thanks to the alert features you can ge
The Signal MACD product is an indicator that works with the standard MACD indicator. This indicator is designed to do signal trading using the objective MACD indicator and a set of algorithms. This indicator can be used both as an oscillator and as a signal producing product. So you can use this indicator in two goal. When the indicator finds a signal, it shows arrow marks on the oscillator. These arrows allow investors to trade. Trade Rules "Buy" action when you see a green arrow and receive
Filtro:
raiinzen
727
raiinzen 2019.04.07 10:44 
 

O usuário não deixou nenhum comentário para sua avaliação

sunnychow
8753
sunnychow 2018.12.01 11:08 
 

O usuário não deixou nenhum comentário para sua avaliação

Responder ao comentário