Smart Structure Regime Navigator
- Indicadores
-
Blessing Samuel Olasunkanmi
 Forex trader, MQL5 developer and founder of OlaDigital Nexus Framework, a registered Nigerian business focused on programming, trading and e-learning.
- Versão: 1.0
- Ativações: 10
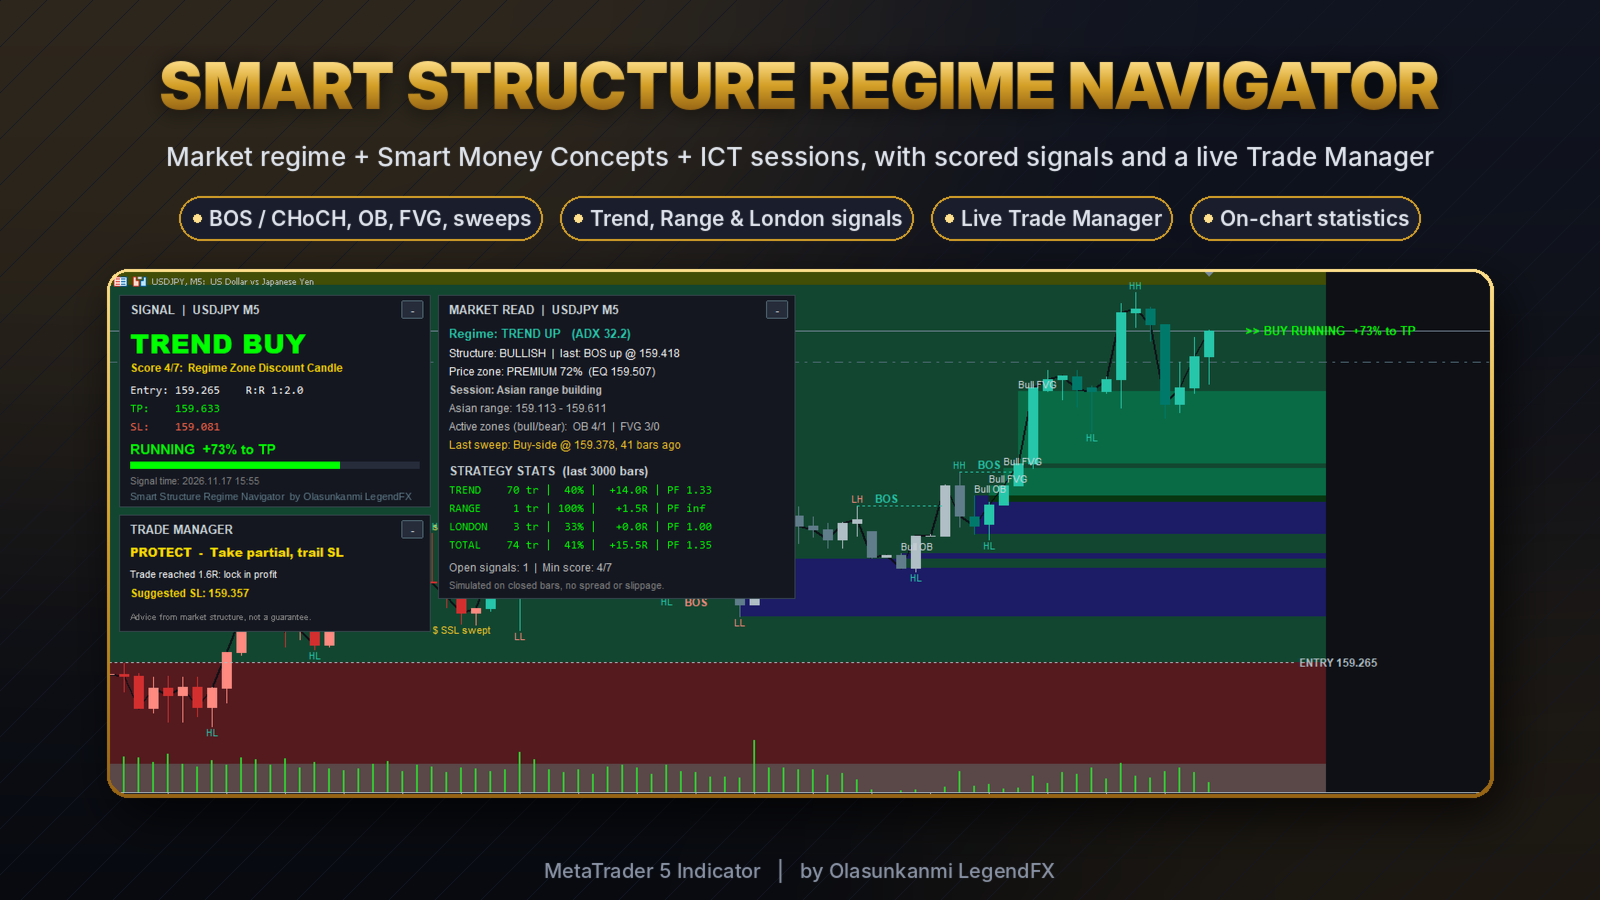
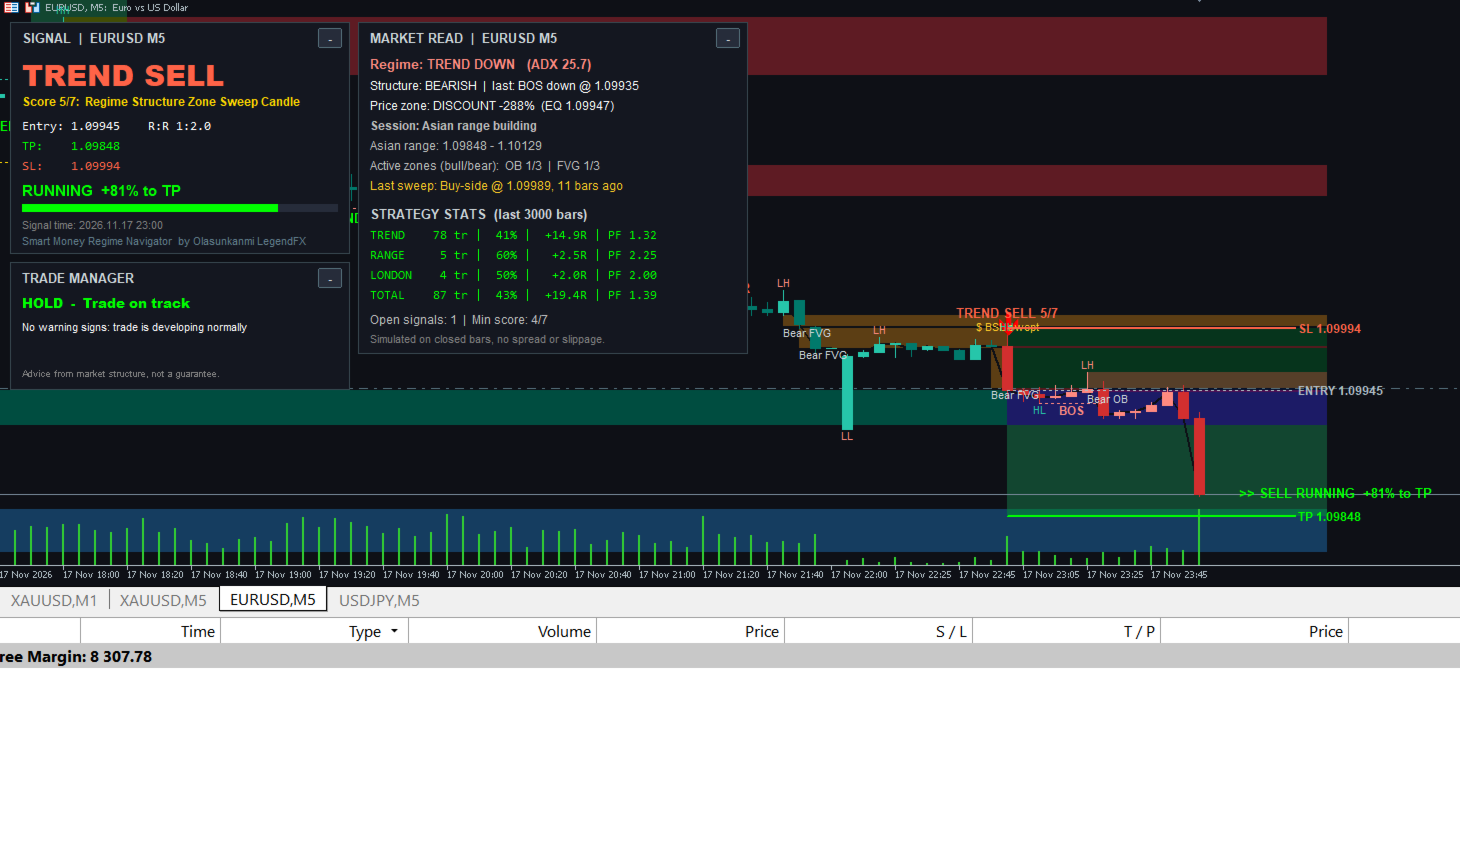
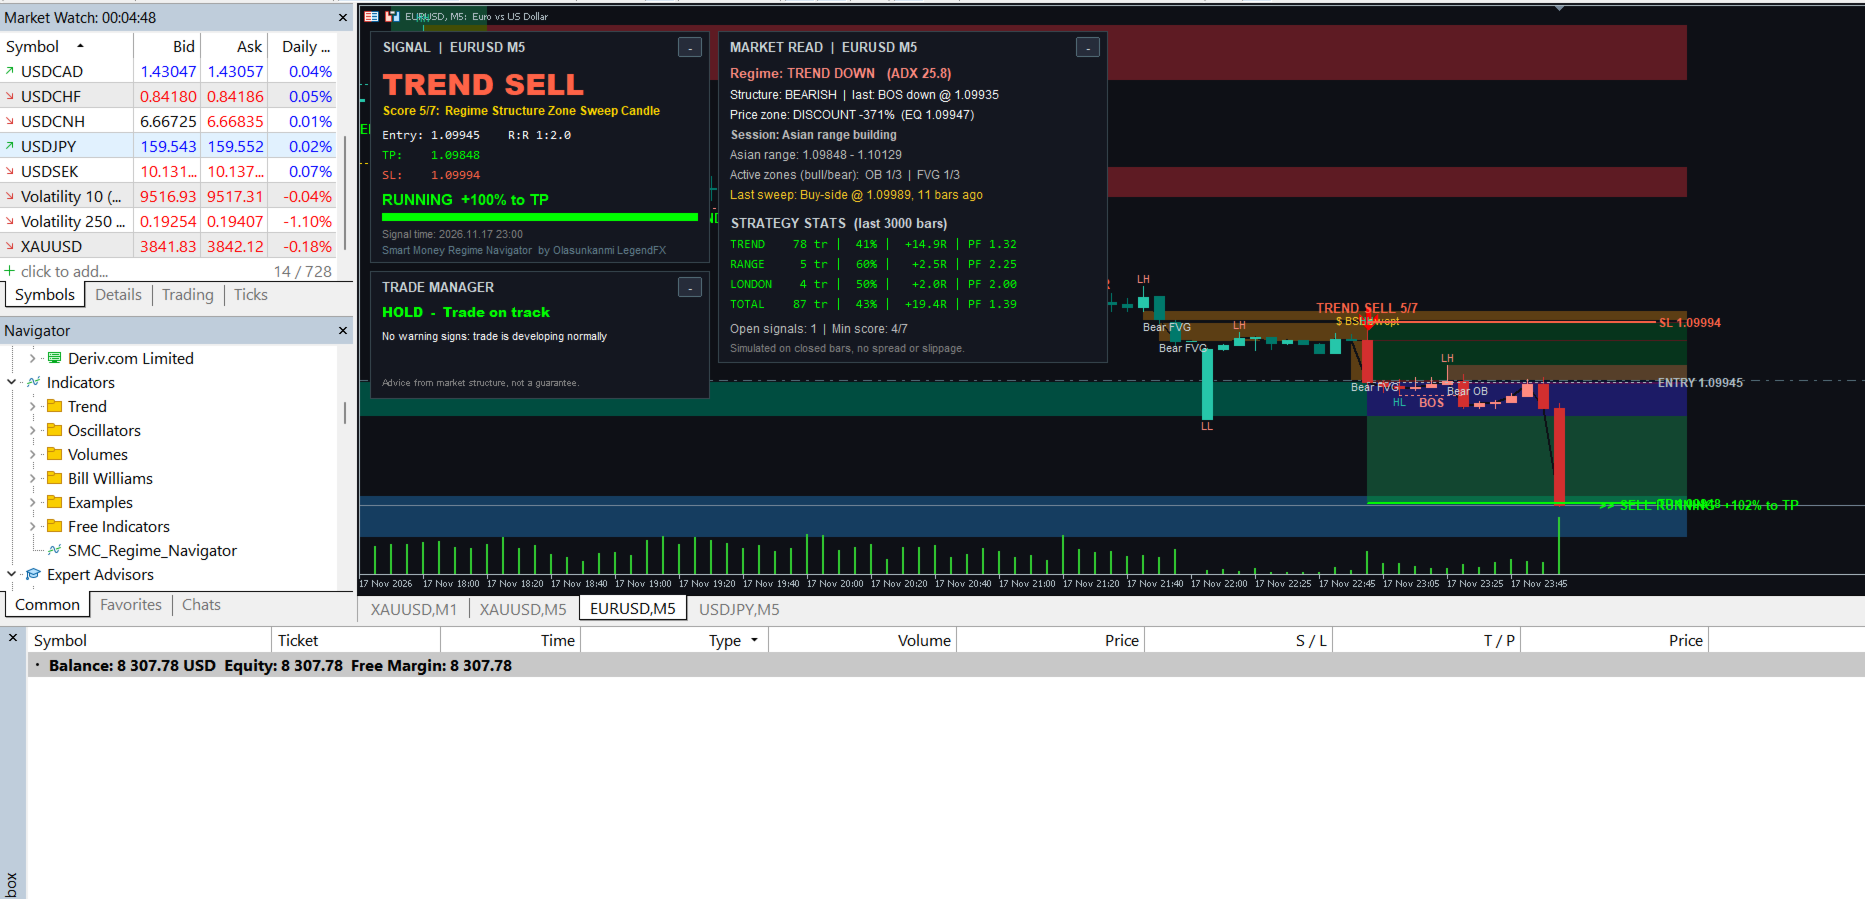
Smart Structure Regime Navigator is a complete chart-analysis indicator for MetaTrader 5. It reads the market regime, Smart Money Concepts structure and the ICT trading sessions, then turns them into clear, scored signals with Entry, Take Profit and Stop Loss, and a live Trade Manager that advises you while the signal is running.
Everything is drawn directly on your chart, in a clean dark layout, so you can see in a few seconds what the market is doing and what the indicator suggests.
WHAT MAKES IT DIFFERENT
- One tool instead of many: market regime, structure, order blocks, fair value gaps, liquidity sweeps, sessions, signals and trade management in a single indicator
- Signals are not random arrows: every signal receives a confluence score out of 7, and only signals that reach your minimum score are shown
- Live Trade Manager: tells you when to hold, protect (break-even, partial profit, tighter stop loss), reduce or exit, and explains why
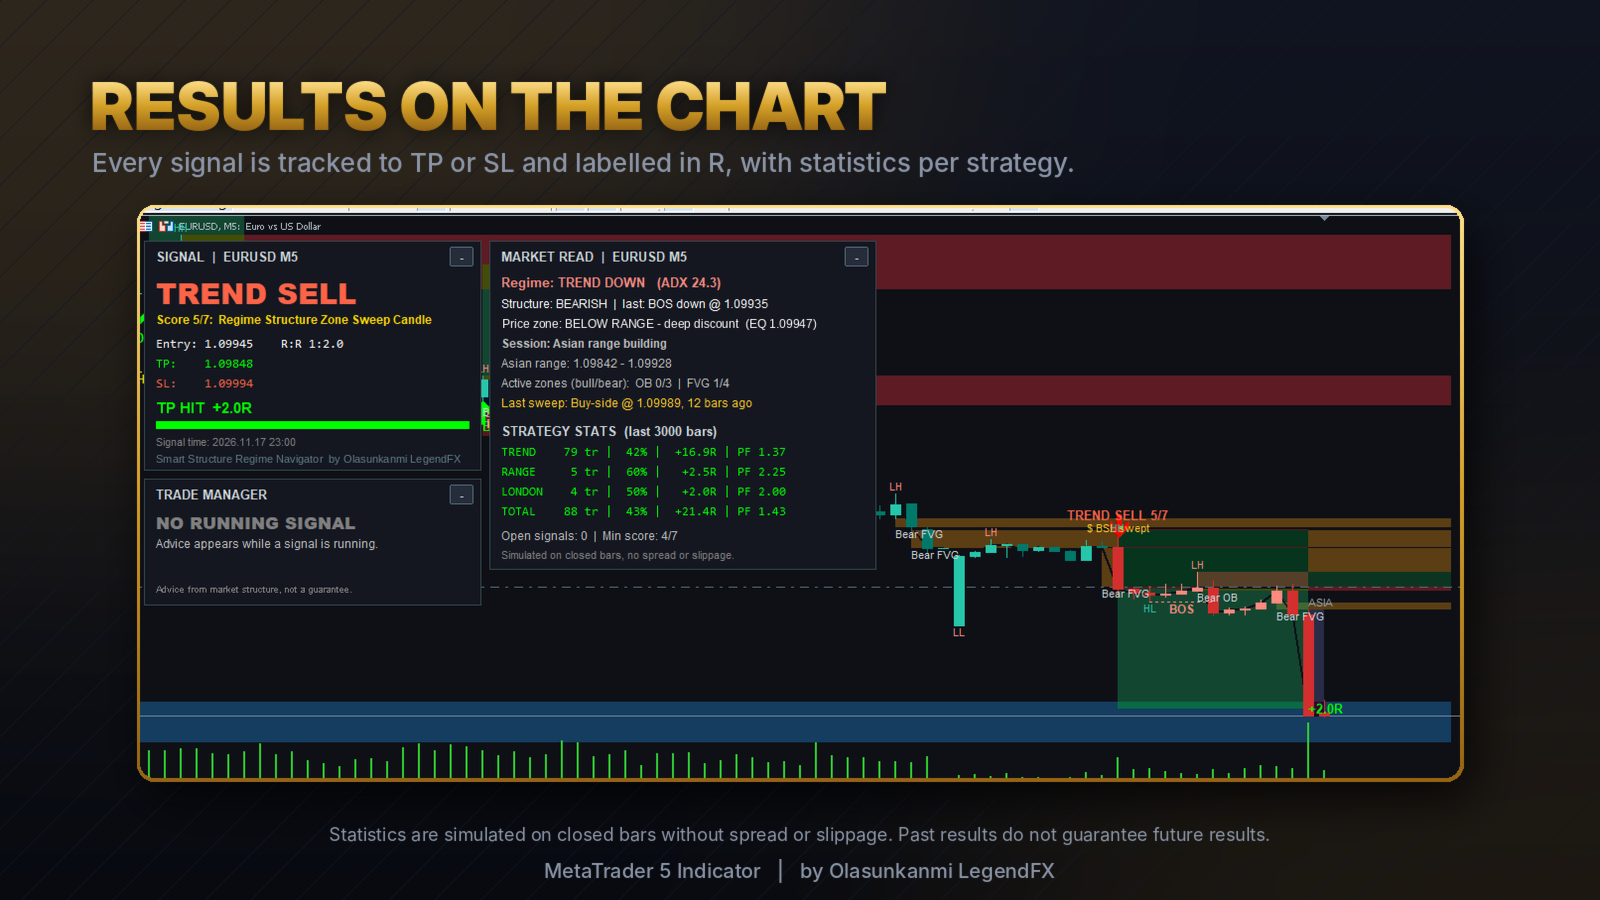
- Honest on-chart statistics: every signal is followed to its Take Profit or Stop Loss and labelled in R, with win rate, net R and profit factor per strategy
- Signals are calculated on closed candles and do not repaint
- Clean, readable design: candles colored by market regime, panels on the left so the newest candles stay visible, and panels that can be minimized with one click
MARKET REGIME
The indicator classifies every candle as trending up, trending down or ranging, using ADX for trend strength and two EMAs for direction. Candles are colored by regime, so you see the market condition at a glance:
- Teal candles: trending up
- Red candles: trending down
- Grey candles: ranging
SMART MONEY CONCEPTS STRUCTURE
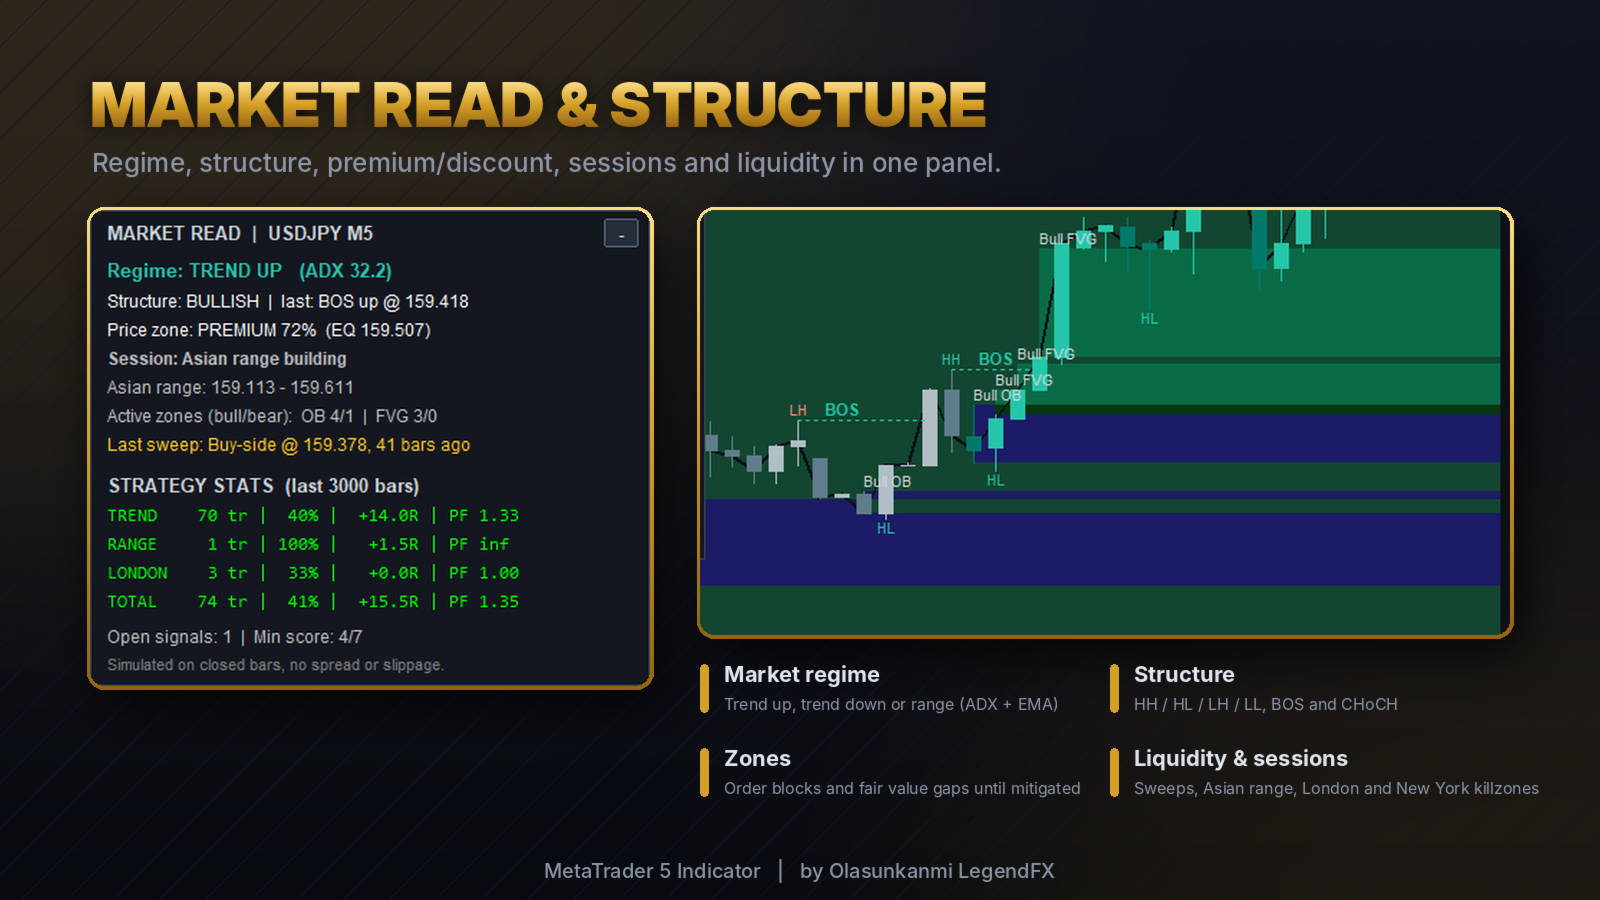
- Swing points labelled HH, HL, LH and LL
- Break of Structure (BOS) and Change of Character (CHoCH) lines with labels
- Order blocks: the last opposite candle before a structure break, shown as a zone until price mitigates it
- Fair value gaps (FVG): three-candle imbalances above a minimum size, shown until filled
- Liquidity sweeps: marked when price takes a swing high or low with a wick and closes back inside (buy-side and sell-side liquidity)
- Premium and discount: an equilibrium line at 50% of the current dealing range, with the price zone shown in the panel
Mitigated zones are removed automatically to keep the chart clean.
ICT SESSIONS
- Asian range box
- London killzone box
- New York killzone box
Session times are set in GMT and converted from your broker's server time automatically.
THREE SIGNAL STRATEGIES
1. Trend: in a trending market, price pulls back into an order block or fair value gap in the trend direction and a strong confirmation candle closes.
2. Range: in a ranging market, a liquidity sweep of a swing high or low is followed by an RSI extreme and a confirmation candle.
3. London: during the London killzone, price closes beyond the Asian range for the first time. A sweep of the opposite side first (Judas swing) adds to the score.
Each strategy has its own reward-to-risk setting and can be switched on or off.
7-POINT CONFLUENCE SCORE
Each signal is scored from these factors:
- Market regime fits the strategy
- Market structure in the same direction (RSI extreme for the Range strategy)
- Reaction from an order block or fair value gap
- Liquidity sweep or Judas swing in favour of the trade
- Price in discount for buys or premium for sells
- Inside the London or New York killzone
- Strong confirmation candle
The panel shows the score and exactly which factors were found.
SIGNALS ON THE CHART
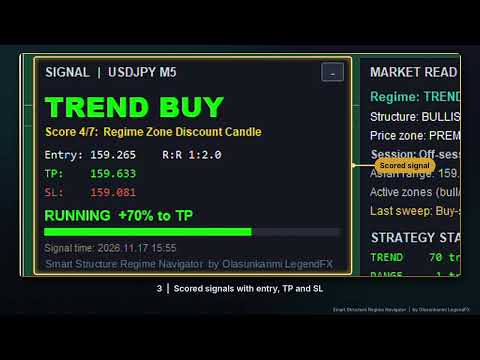
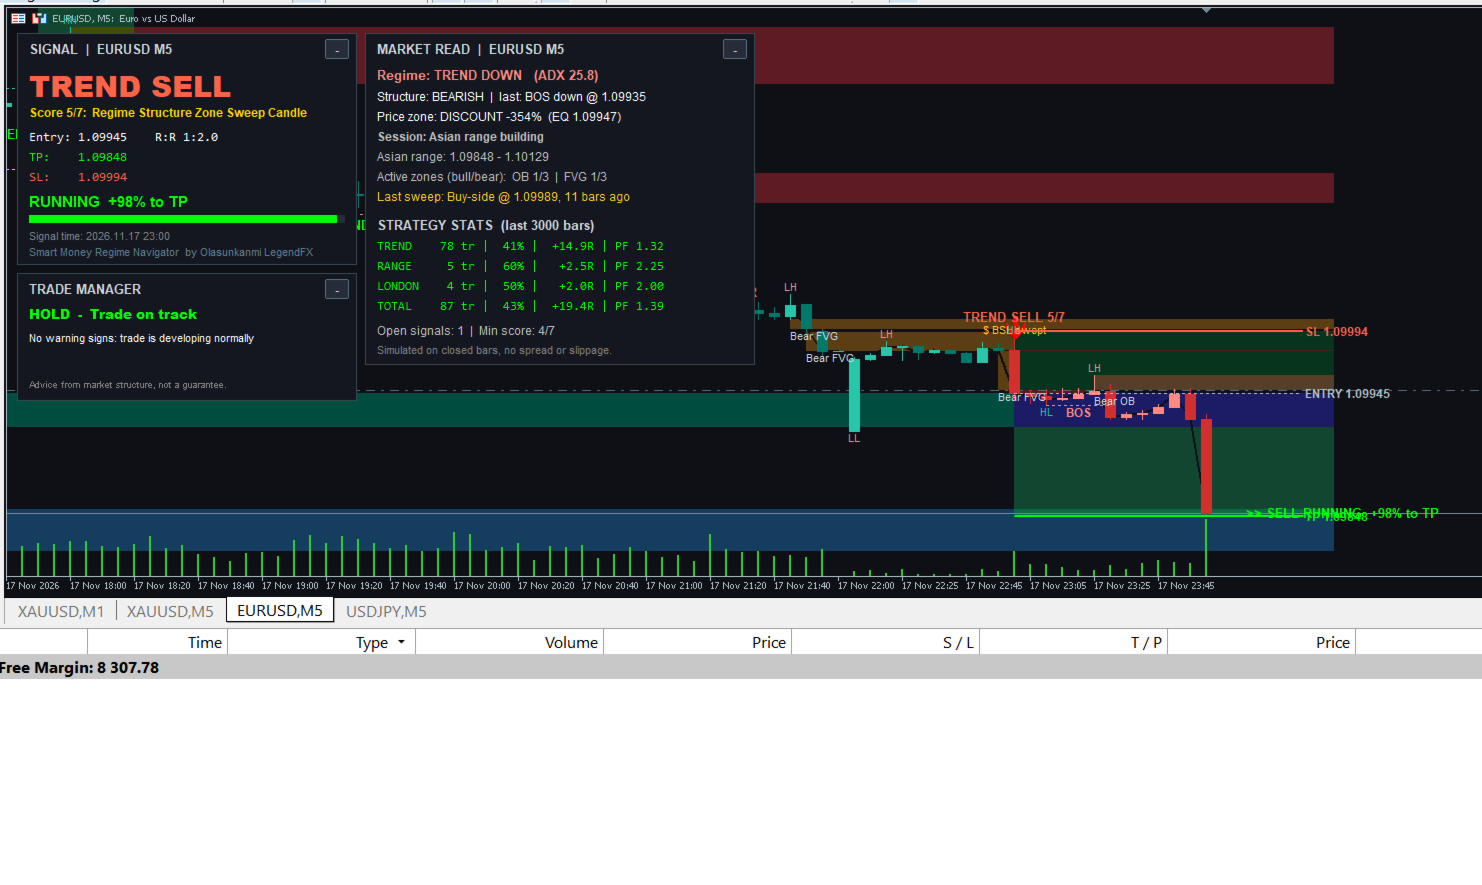
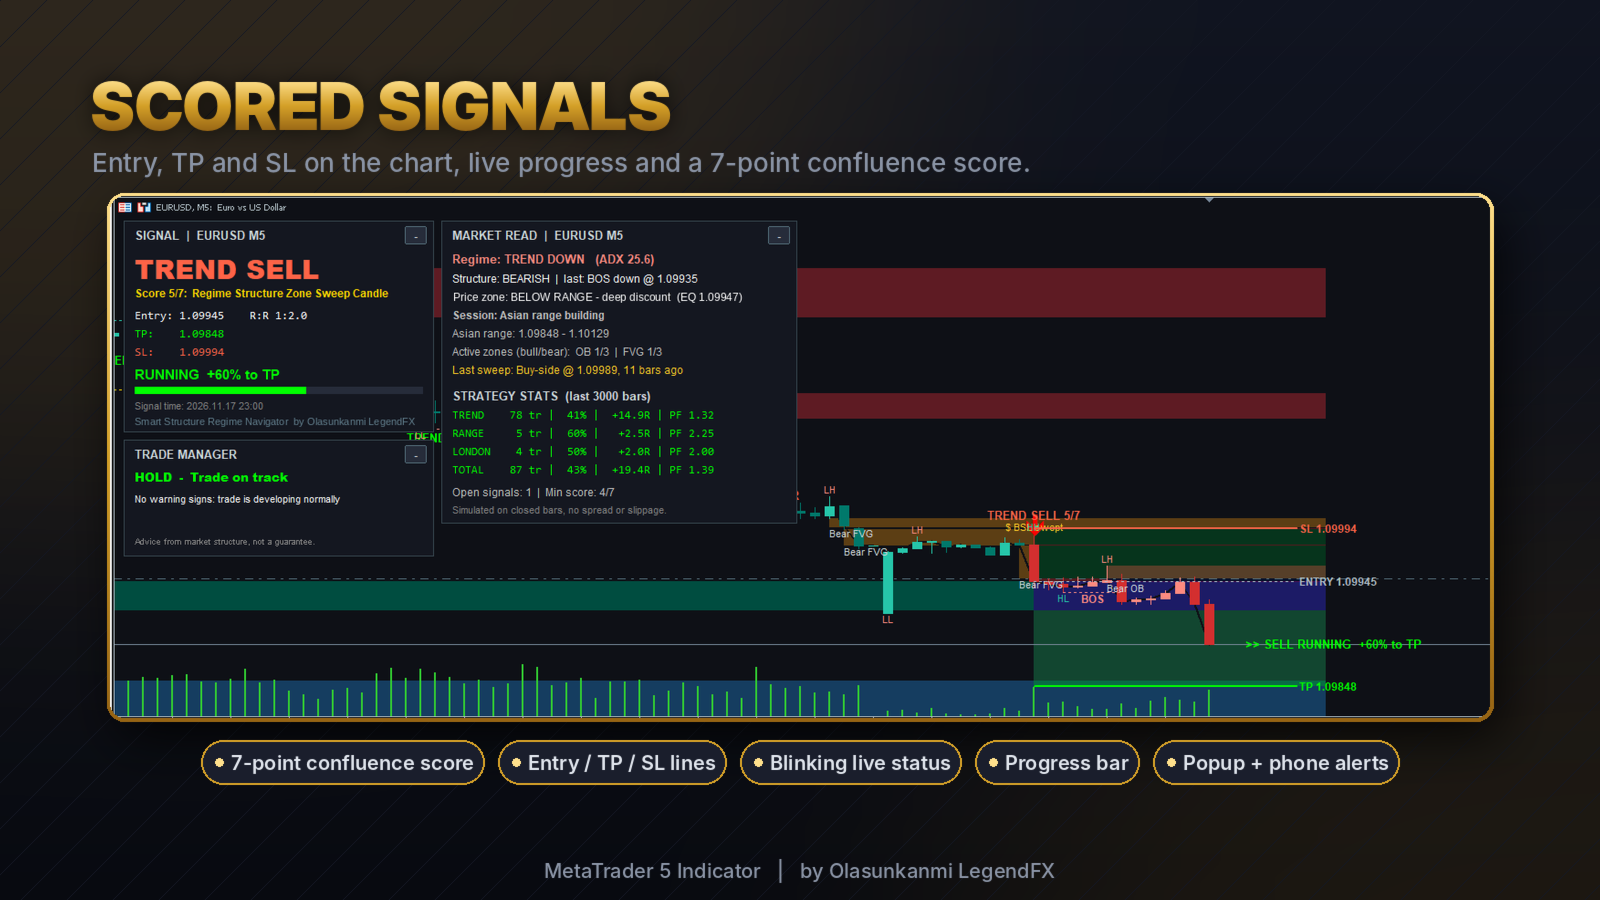
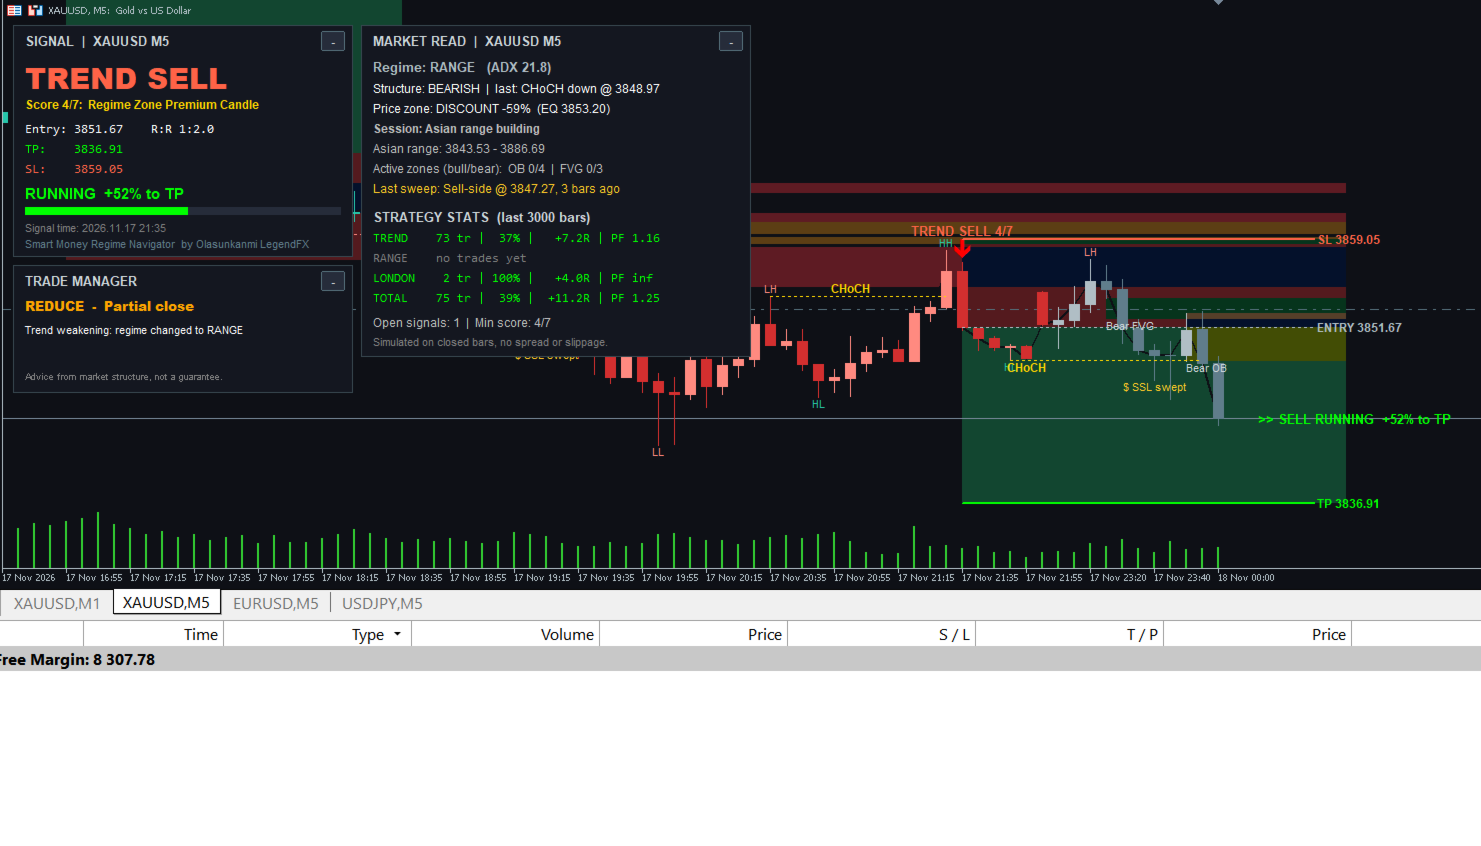
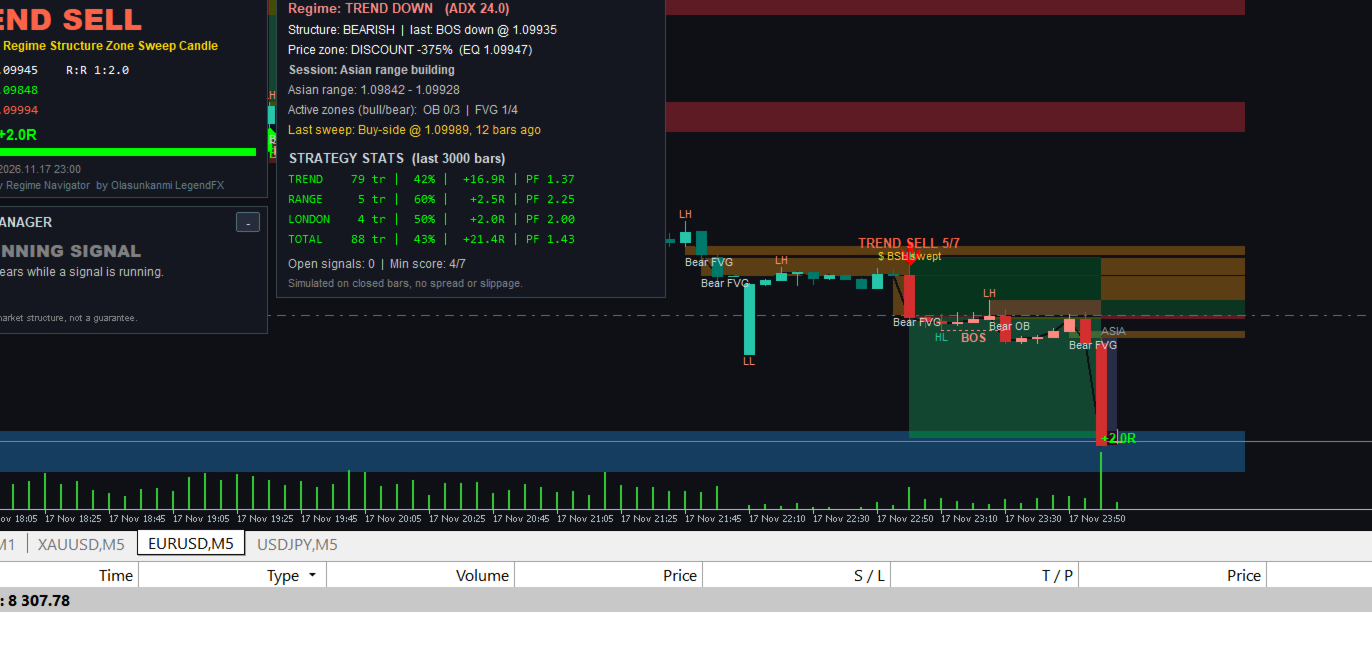
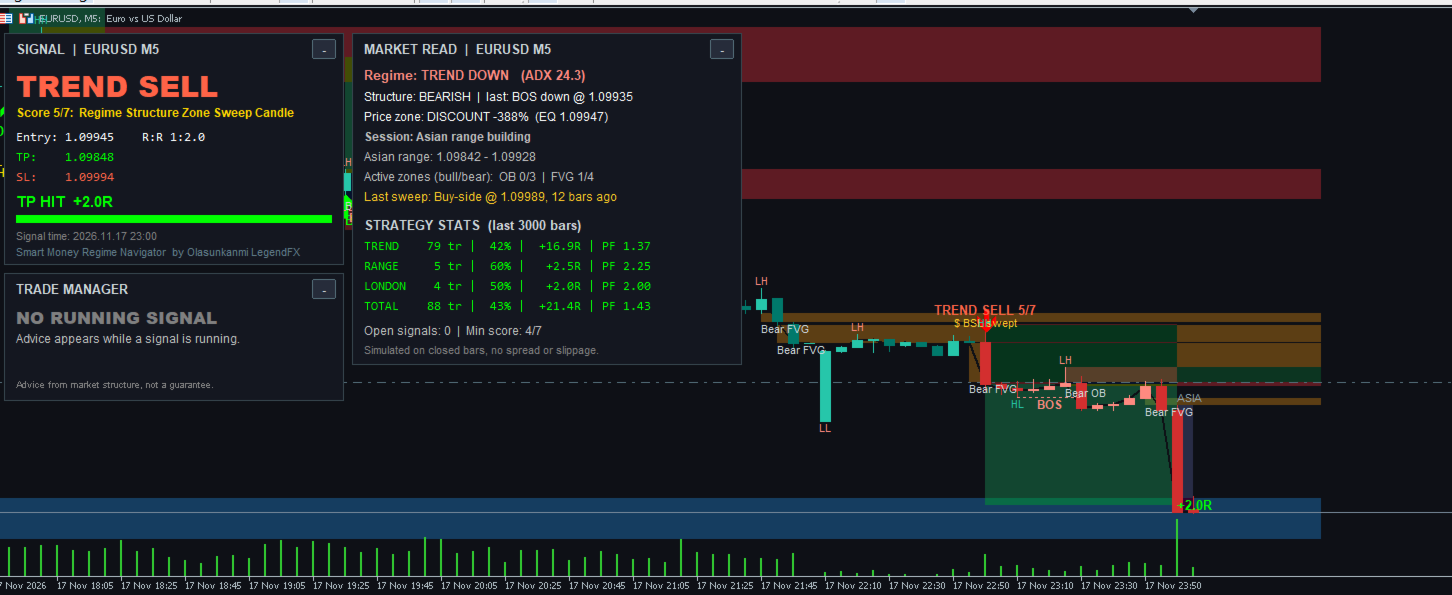
- Buy and sell arrows with a label such as "TREND SELL 5/7"
- Entry, Take Profit and Stop Loss lines that extend to the current candle, with prices
- A blinking live status next to price, for example "SELL RUNNING +60% to TP"
- Green Take Profit and red Stop Loss boxes
- The final result labelled in R when the signal ends, for example +2.0R or -1.0R
- Popup and phone push alerts for every new signal
TRADE MANAGER (LIVE ADVICE)
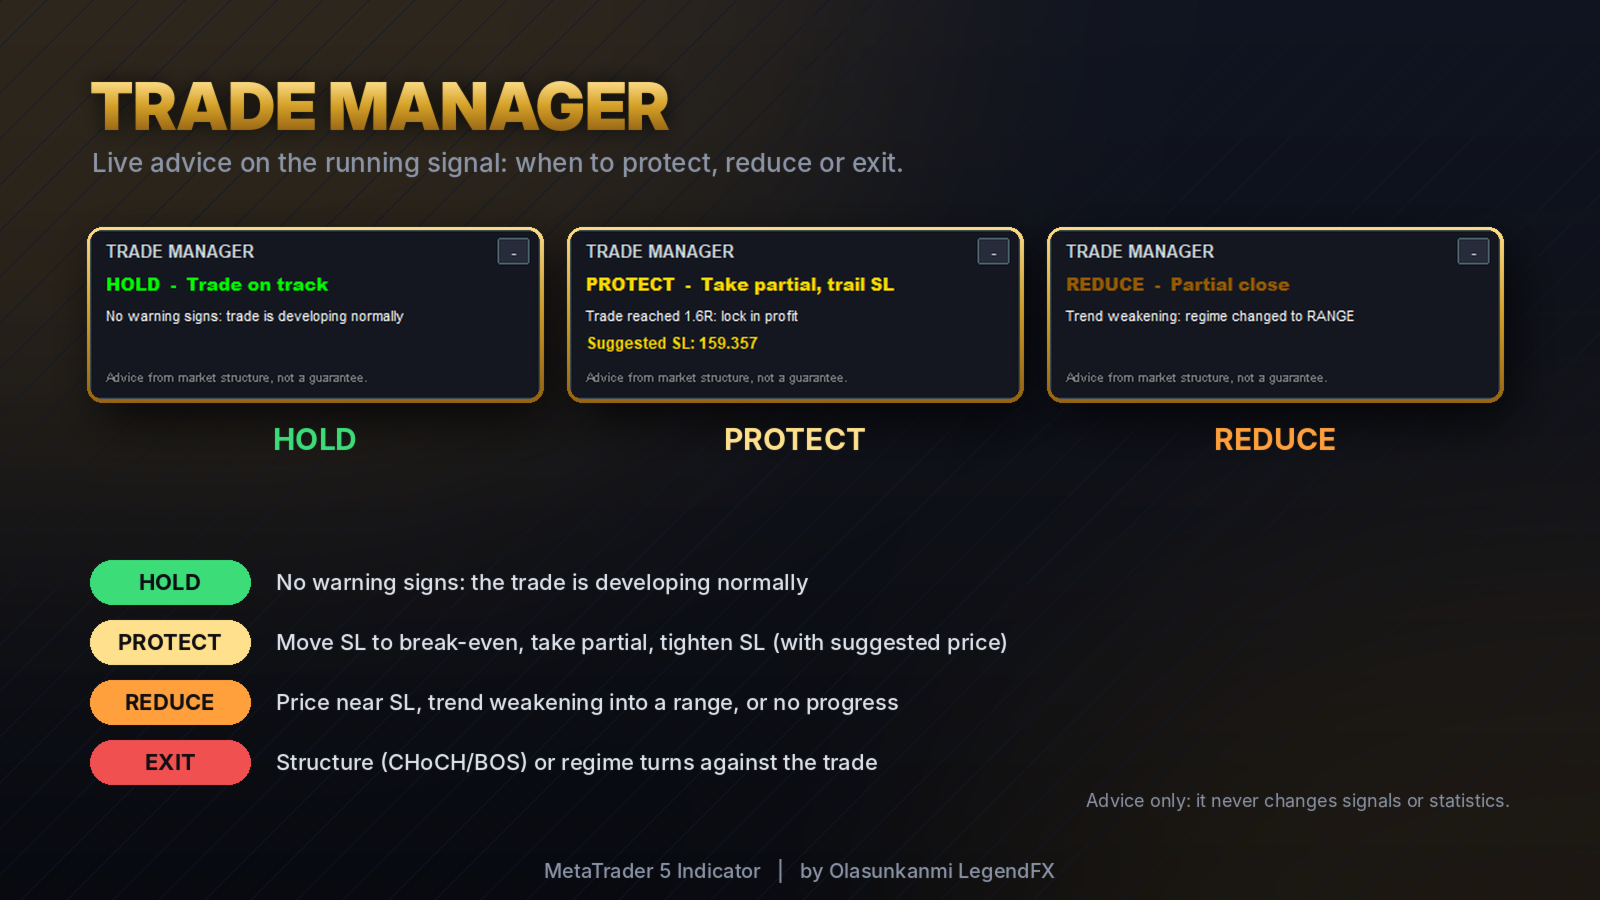
While a signal is running, the Trade Manager watches the market and shows the most important advice:
- HOLD: no warning signs, the trade is developing normally
- PROTECT: move the stop loss to break-even, take partial profit and trail the stop loss, or tighten the stop loss before an opposing zone or after a sweep against the trade. A suggested stop loss price is shown.
- REDUCE: price is close to the stop loss, the trend has weakened into a range, or there has been no progress for many candles
- EXIT: market structure (BOS or CHoCH) or the market regime has turned against the trade
Each piece of advice comes with a short reason. You can receive an alert whenever the advice becomes more serious. The Trade Manager only gives advice: it never changes the signals or the statistics.
PANELS
- Signal panel: strategy, direction, score and factors, Entry, TP, SL, reward-to-risk, live status and a progress bar
- Trade Manager panel: advice level, action, reason and suggested stop loss
- Market Read panel: regime with ADX, structure and the last BOS or CHoCH, premium or discount, active session, Asian range, active order blocks and fair value gaps, last liquidity sweep, and statistics for each strategy
All panels can be minimized with the [-] button and restored with [+].
STATISTICS
For the analysed history (3000 candles by default), the indicator shows for each strategy and in total: number of signals, win rate, net result in R and profit factor. Use them to see which strategies fit your symbol and timeframe, and switch off or adjust the others.
The statistics are simulated on closed candles without spread or slippage, so real results will differ.
RECOMMENDED USE
- Works on any symbol: forex, gold, indices and others
- Recommended timeframes: M5 to H1 (M1 is possible but noisier)
- For gold and major pairs, the London and New York killzones give the most active conditions
- Use "Chart Shift" in MetaTrader to leave space on the right for the live labels
- This is an indicator: it does not open or close trades automatically
ABOUT REPAINTING
Signals, arrows, Take Profit and Stop Loss levels and results are calculated on closed candles and do not repaint. Swing labels appear a few candles after the swing because a swing must be confirmed (this is set by "Swing strength"). Order blocks and fair value gaps disappear when they are mitigated, by design.
INPUT PARAMETERS
Market Regime
- ADX period: length of the ADX (default 14)
- ADX at/above this = trending: trend threshold (default 22)
- ADX below this = ranging: range threshold (default 18)
- Fast EMA / Slow EMA: trend direction (default 50 / 200)
- ATR period: volatility for zones, stops and filters (default 14)
- RSI period: used by the Range strategy (default 14)
Smart Money Concepts
- Swing strength (bars each side): how many candles confirm a swing (default 3)
- Show HH / HL / LH / LL labels
- Show BOS / CHoCH
- Show order blocks
- Show fair value gaps
- Minimum FVG size (x ATR): ignores very small gaps (default 0.15)
- Max active zones per type and side: keeps the chart clean (default 4)
- Show liquidity sweeps
- Show equilibrium (premium/discount) line
ICT Sessions (GMT hours)
- Detect server GMT offset automatically (live)
- Server GMT offset (manual / Strategy Tester): your broker's offset for backtesting (default 2)
- Asian range start / end (default 0 to 6)
- London killzone start / end (default 7 to 10)
- New York killzone start / end (default 12 to 15)
- Show session boxes
- Asian range must be at least / at most ATR x this: filters unusable ranges for the London strategy
Signals
- Strategy 1: Trend pullback into OB / FVG (on/off)
- Strategy 2: Range liquidity sweep reversal (on/off)
- Strategy 3: London Asian-range breakout (on/off)
- Minimum confluence score (out of 7): only stronger signals are shown when raised (default 4)
- Trend / Range / London reward:risk (default 2.0 / 1.5 / 2.0)
- Range: RSI level for buys (sells use 100 minus this) (default 35)
- A sweep counts for X bars (default 5)
- Minimum / Maximum SL distance (x ATR) (default 0.5 / 3.0)
- Close a simulated signal after X bars (default 150)
- Min bars between signals of the same strategy (default 3)
Trade Manager
- Show Trade Manager panel
- Alert when the advice level rises
- Advise break-even at this fraction of the way to TP (default 0.5)
- Advise partial close at this profit in R (default 1.0)
- Advise reducing when the loss reaches this in R (default 0.7)
- Advise closing after X bars without progress (default 30)
- Opposing zone counts when this close (x ATR) (default 0.5)
Display
- Bars analysed (history window) (default 3000)
- Dark chart theme (your original colors are restored when the indicator is removed)
- Show TP / SL boxes and results
- Max signals drawn on the chart (default 40)
- Show signal panel / Show market-read panel
Alerts
- Popup alert on new signal
- Push notification on new signal
IMPORTANT
This indicator is an analysis tool and does not guarantee profits. Signals, advice and statistics are based on historical and current market data, and past results do not guarantee future results. Test it on a demo account and in the Strategy Tester before using it with real money, and always use your own risk management.
For questions and support, please use the product comments or MQL5 private messages.