Position Sizing Indicator MT4

Position Sizing Indicator is a chart calculator for MetaTrader 5. It tells you how many lots to trade so that a stop loss costs exactly the amount you want to risk, and it shows the reward to risk ratio of the setup. It does not open, modify or close trades.

How it works
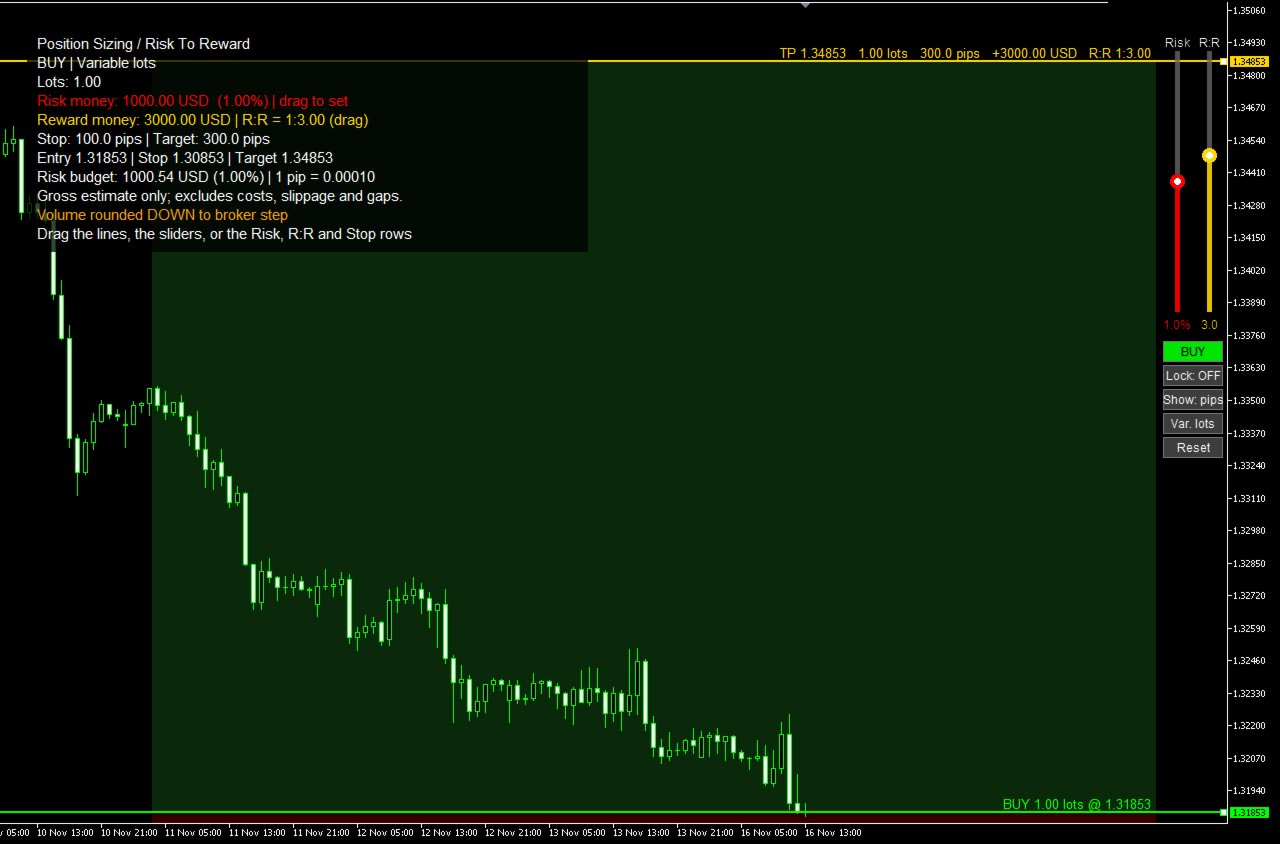
- Three lines appear on the chart: Entry, Stop and Target. Press and drag any of them with the mouse, no double-click needed.
- Dragging Entry moves the whole setup. Dragging Stop changes the stop distance. Dragging Target changes the reward multiple.
- The direction follows the lines: drag the Stop or the Target to the other side of the entry and the setup turns from buy to sell (or back); the other line moves across with it.
- Each line carries its numbers: direction and lots on the entry; price, lots, pips, money and percent on the stop; price, lots, pips, money and R:R on the target.
- Two sliders at the right edge set the risk (0.1 % to 10 % of the account) and the R:R (0.5 to 10) with one drag.
- Under the sliders, buttons switch Buy/Sell, Lock R:R, pips or money, fixed or variable lots, and reset the lines.
- Green and red zones show the reward and the risk on the chart.

Two size modes, switched with one button
- Variable lots: you set the risk as a percentage of the balance, the equity or a manual account size, and the lot size follows from the stop.
- Fixed lots: the size stays as it is (drag the Lots row to change it); the Risk slider then moves the stop, so the risk zone grows or shrinks, and the target keeps the R:R.

The panel
- Lots, risk money and its percentage of the account, reward money and the R:R ratio.
- Stop and target in pips or in account currency (Show button).
- Drag the Risk row up or down to set the risk in money, the R:R row to change the target, and the Stop row to change the stop distance in pips.
- Lock R:R button: when it is on, moving the stop also moves the target, so the ratio stays the same.
- Buy/Sell button turns the setup around (the stop and target are mirrored around the entry). Reset puts the three lines back at the current price.
- With the default transparent panel only the text of the panel reacts to the mouse, so the chart behind it stays fully usable.

Accuracy
- Lot sizes are rounded down to the broker's lot step and capped at the maximum lot, so the result never risks more than you set. If even the minimum lot would risk too much, the panel shows 0 lots and says why.
- Money values come from the broker's own symbol settings, so they work for forex, metals, indices and other symbols, in any account currency.
- The figures are gross estimates. They do not include commission, swap, slippage or price gaps.

Other details
- Optional ATR stop: the first stop distance can come from the ATR instead of a fixed number of pips. On symbols other than currency pairs (gold, indices, crypto), a fixed pip stop that is far smaller than the normal bar range is replaced by the ATR when the lines are first placed.
- The lines and panel settings are kept when you change inputs, switch timeframe or restart the terminal. After a symbol change the setup starts fresh.
- One copy per chart. Colours, fonts, line width, panel position and transparency are adjustable.

Inputs
- Calculation mode, account basis (balance, equity, manual), manual account size, risk percent, fixed lots.
- Initial direction, stop distance in pips, reward multiple, ATR stop and ATR period, Lock R:R, reset lines, pip size override.
- Colours of the lines, zones and panel; font, font size, line width, zone and panel transparency, panel position; sliders and buttons on or off and their position.
Mais do autor
Astro Composite – extended description Astro Composite builds a   composite cycle   by summing sine waves of selected planetary orbits. Each planet contributes a cyclic component (0 → 360), and an optional   phase shift   allows fine-alignment of the cycle start with market structure. The result is a smoother, more interpretable wave that highlights   dominant market phases   rather than short-term noise. Astro Composite focuses on planets with   historically observable market influence   and p
Reverse Engineered RSI   Introduction Reverse Engineered RSI transforms the way traders use the RSI indicator. Instead of displaying RSI in a separate oscillator window, this tool projects the key RSI levels — 30, 50, and 70 — directly onto the price chart . This allows traders to see where overbought, oversold, and equilibrium zones align with actual price levels — without switching charts or guessing momentum conditions. You get precise RSI-derived support and resistance levels right on the c
Trend Stop   Introduction Trend Stop is a simple yet powerful trend-following and stop-placement tool for MetaTrader 4. It calculates the highest high or lowest low of the last N periods and plots a dynamic line that reacts instantly to trend changes. The result is a clean, reliable trend filter and a practical guide for placing optimal stop levels — without unnecessary noise or lag. Whether you’re a trend trader, swing trader, or scalper, Trend Stop helps you stay on the right side of the marke
Fractal Pivot Lines — Indicator Overview  Fractal Pivot Lines is a custom trend-structure indicator for MetaTrader 4 . It automatically connects key fractal highs and lows with dynamic lines so you can see how price is respecting local structure, building channels, and preparing for potential reversals. Instead of staring at dozens of candles and guessing where the real pivots are, the indicator turns fractals into clear support/resistance paths and trend channels . What the Indicator Does C
Reverse Engineered RSI   Introduction Reverse Engineered RSI transforms the way traders use the RSI indicator. Instead of displaying RSI in a separate oscillator window, this tool projects the key RSI levels — 30, 50, and 70 — directly onto the price chart . This allows traders to see where overbought, oversold, and equilibrium zones align with actual price levels — without switching charts or guessing momentum conditions. You get precise RSI-derived support and resistance levels right on the c
Reversing MACD — Indicator Overview Reversing MACD is a forward-looking analytical tool that calculates the exact price the next bar would need to reach for the MACD line and the signal line to cross on the upcoming candle . Instead of waiting for a crossover to occur after the fact, the indicator answers a more powerful question: “At what price will the MACD cross on the very next bar ?” Core Idea Behind the Indicator Traditional MACD reacts to price changes after they occur . A trader only see
Projected Moving Average  A clean and practical moving-average tool designed for traders who want a clearer view of short-term and medium-term trend direction. The Projected Moving Average shifts a standard SMA forward by half of its period, creating a smooth projection zone that updates dynamically with each new candle. This makes it easier to visually anticipate where the moving average is heading without repainting past values. Key Features Forward-shifted SMA (Length/2) for clearer trend pro
Weinstein Stage Analysis (MTF) – Professional Market Structure Indicator This indicator implements   Stan Weinstein’s Stage Analysis   in a clean, modern, and fully   MTF-correct   way for MetaTrader 5. It automatically identifies the four classical market stages: Stage 1 – Base / Accumulation Stage 2 – Advancing Trend Stage 3 – Distribution Stage 4 – Declining Trend Unlike many simplified versions, this indicator: Calculates the trend   on a higher timeframe moving average Projects the correct
Bollinger Trend Lines – MT4 & MT5 Bollinger Trend Lines   is a professional volatility-based trend indicator designed to clearly identify trend direction and dynamic stop levels using Bollinger Bands. Fuses on one core principle: follow the trend, ignore noise, and let volatility define the stop. How it works The indicator builds   trailing trend lines   using Bollinger Bands: In an   uptrend , the   lower band trails price and can only rise In a   downtrend , the   upper band trails pri
Draw Gann Fans, Gann Boxes and Gann Grids with one mouse drag, and adjust them with two handles. Gann Toolbox is a mouse-driven drawing tool for MetaTrader. A small panel on the chart lets you pick a Gann Fan, a Gann Box or a Gann Grid, then you press on the chart, drag to the second point and release. It does not open, modify or close trades. Tools - Gann Fan: the standard fan from the first point, scaled so that the 1x1 line runs through the second point. - Gann Box: a box between the two po
Trend Stop  Introduction Trend Stop is a simple yet powerful trend-following and stop-placement tool for MetaTrader 5. It calculates the highest high or lowest low of the last N periods and plots a dynamic line that reacts instantly to trend changes. The result is a clean, reliable trend filter and a practical guide for placing optimal stop levels — without unnecessary noise or lag. Whether you’re a trend trader, swing trader, or scalper, Trend Stop helps you stay on the right side of the market
Fractal Pivot Lines — Indicator Overview   Fractal Pivot Lines is a custom trend-structure indicator for MetaTrader 5 . It automatically connects key fractal highs and lows with dynamic lines so you can see how price is respecting local structure, building channels, and preparing for potential reversals. Instead of staring at dozens of candles and guessing where the real pivots are, the indicator turns fractals into clear support/resistance paths and trend channels . What the Indicator Does
Reversing MACD — Indicator Overview Reversing MACD is a forward-looking analytical tool that calculates the exact price the next bar would need to reach for the MACD line and the signal line to cross on the upcoming candle . Instead of waiting for a crossover to occur after the fact, the indicator answers a more powerful question: “At what price will the MACD cross on the very next bar ?” Core Idea Behind the Indicator Traditional MACD reacts to price changes after they occur . A trader only see
Projected Moving Average  A clean and practical moving-average tool designed for traders who want a clearer view of short-term and medium-term trend direction. The   Projected Moving Average   shifts a standard SMA forward by half of its period, creating a smooth projection zone that updates dynamically with each new candle. This makes it easier to visually anticipate where the moving average is heading without repainting past values. Key Features Forward-shifted SMA (Length/2) for clearer trend
Weinstein Stage Analysis (MTF) – Professional Market Structure Indicator This indicator implements Stan Weinstein’s Stage Analysis in a clean, modern, and fully MTF-correct way for MetaTrader 5. It automatically identifies the four classical market stages: Stage 1 – Base / Accumulation Stage 2 – Advancing Trend Stage 3 – Distribution Stage 4 – Declining Trend Unlike many simplified versions, this indicator: Calculates the trend on a higher timeframe moving average Projects the correct stage onto
Bollinger Trend Lines – MT4 & MT5 Bollinger Trend Lines is a professional volatility-based trend indicator designed to clearly identify trend direction and dynamic stop levels using Bollinger Bands. Fuses on one core principle: follow the trend, ignore noise, and let volatility define the stop. How it works The indicator builds trailing trend lines using Bollinger Bands: In an uptrend , the lower band trails price and can only rise In a downtrend , the upper band trails price and can only
Astro Composite – extended description Astro Composite builds a composite cycle by summing sine waves of selected planetary orbits. Each planet contributes a cyclic component (0 → 360), and an optional phase shift allows fine-alignment of the cycle start with market structure. The result is a smoother, more interpretable wave that highlights dominant market phases rather than short-term noise. Astro Composite focuses on planets with historically observable market influence and practical cycle l
Position Sizing Indicator is a chart calculator for MetaTrader 5. It tells you how many lots to trade so that a stop loss costs exactly the amount you want to risk, and it shows the reward to risk ratio of the setup. It does not open, modify or close trades. How it works - Three lines appear on the chart: Entry, Stop and Target. Press and drag any of them with the mouse, no double-click needed. - Dragging Entry moves the whole setup. Dragging Stop changes the stop distance. Dragging Target cha
Draw Gann Fans, Gann Boxes and Gann Grids with one mouse drag, and adjust them with two handles. Gann Toolbox is a mouse-driven drawing tool for MetaTrader. A small panel on the chart lets you pick a Gann Fan, a Gann Box or a Gann Grid, then you press on the chart, drag to the second point and release. It does not open, modify or close trades. Tools - Gann Fan: the standard fan from the first point, scaled so that the 1x1 line runs through the second point. - Gann Box: a box between the two p
Filtro:
Sem comentários
Responder ao comentário