Session Liquidity Map
- Indicadores
- Versão: 1.0
- Ativações: 20

Session Liquidity Map
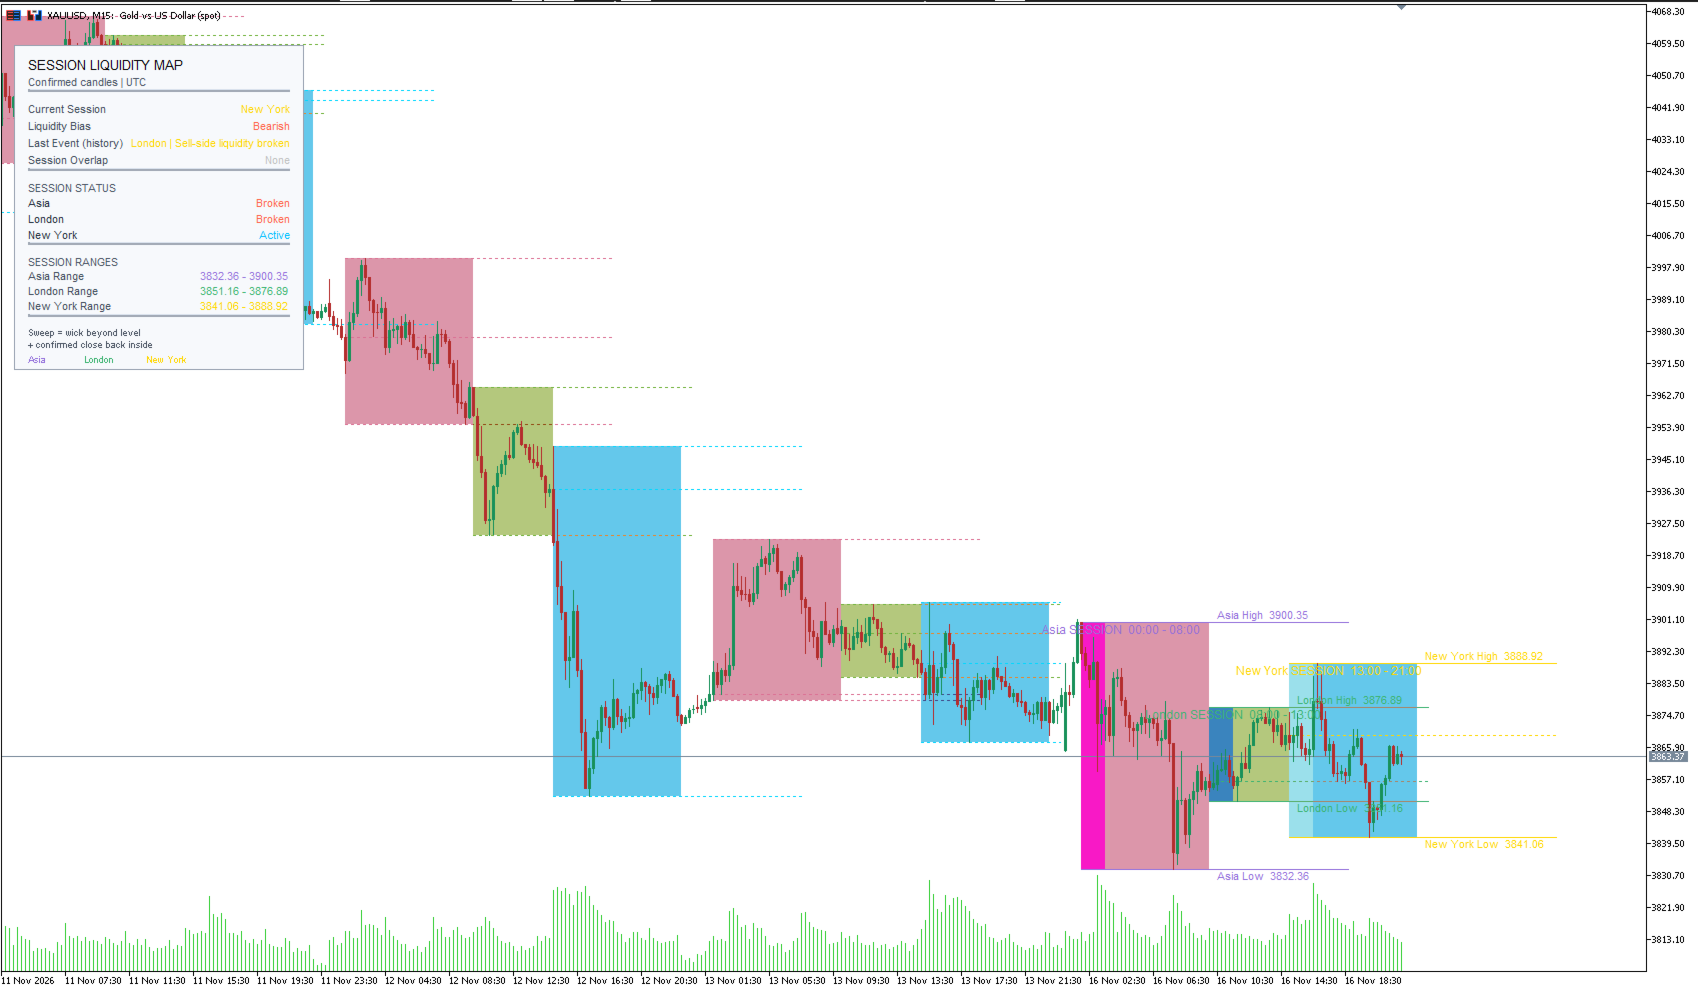
Session Liquidity Map is a MetaTrader 5 chart indicator for visualizing configurable market sessions and analyzing how price interacts with each session’s range.
It marks session highs, lows, and opens, then identifies confirmed liquidity tests, sweeps, and breaks using closed candles. A compact dashboard summarizes session status, recent liquidity events, current session, overlap, and directional context.
Key Features
Configurable UTC Sessions
- Configure the start and end hours for Asia, London, and New York.
- Apply an optional hour shift to all session times.
- Display session ranges and levels in UTC-based session windows.
- Show session overlaps when configured session windows overlap.
Session Ranges and Chart Objects
- Draw a range band for each session.
- Display session high and low levels, with optional session open levels.
- Extend levels a configurable number of chart bars.
- Highlight the opening portion of the current day’s sessions as killzones.
- Show current session labels and optionally display historical labels.
- Choose how many recent days to display.
Liquidity Analysis
The indicator evaluates closed candles and can identify:
- Level tests: A candle’s wick reaches or touches a session high or low.
- Liquidity sweeps: Price moves beyond a session level and the candle closes back inside the level.
- Level breaks: A candle closes beyond a session high or low.
- Sweep threshold: Set a minimum distance in symbol points for sweep detection.
Sweep, break, and test detection can be enabled or disabled separately.
Dashboard
The dashboard displays:
- Current session
- Liquidity bias
- Most recent detected event
- Active session overlap
- Status of each session
- Session range values
The bias is based on recent detected events. When the available session context is conflicting, the indicator can show a neutral bias.
Alerts
Optional alerts are available for confirmed liquidity sweeps and level breaks:
- MetaTrader alerts
- Push notifications
- Email notifications
Alert types can be enabled or disabled independently.
Chart Appearance
Optional chart settings include:
- Hide the chart grid
- Set background and foreground colors
- Apply custom bullish and bearish candle colors
- Keep the chart scrolled to the latest price
- Add chart shift to make room for future candles
The indicator saves the chart appearance settings it changes and attempts to restore them when removed.
Time Zone Setup
Session hours are defined as UTC hours. During live use, the indicator can estimate the current broker-server offset from the server time and TimeGMT() .
For historical chart data and Strategy Tester runs, configure the server’s winter and summer UTC offsets and its daylight-saving rule in the indicator inputs. MetaTrader does not provide a universal historical UTC-offset database for every broker, and TimeGMT() in the Strategy Tester follows simulated server time. Historical UTC conversion therefore depends on using the correct server profile.
The computer’s clock should also be correctly synchronized for live automatic offset estimation.
Important Notes
- Session windows are configurable time ranges; they are not trading instructions.
- Liquidity events are based on candle data and user-selected settings. Results can vary by symbol, timeframe, broker history, and server-time configuration.
- The indicator does not place trades or guarantee trading results.
- Always verify the session-time configuration and historical data on your own broker before relying on the displayed analysis.