Osama Echchakery / Vendedor
Produtos publicados
"GA Moving Average" ("GA Média Móvel") é um Expert Advisor (EA) que utiliza uma estratégia de cruzamento de médias móveis. Ele possui várias configurações para permitir a criação de uma estratégia personalizada, de acordo com a sua visão.
O conceito central do EA "GA Moving Average" é baseado no uso de indicadores de médias móveis para identificar possíveis oportunidades de negociação. Ao analisar a interação entre diferentes médias móveis, o EA busca gerar sinais de compra e venda no mercado.
FREE

Jesus XAUUSD is a professional Gold trading EA built specifically for XAUUSD, using advanced price-action pattern recognition and multi-timeframe analysis to deliver stable, accurate entries on Gold. This Expert Advisor is engineered for traders seeking a true institutional-grade XAUUSD robot with real candlestick logic, tested through over 100,000 optimization cycles. - REAL SIGNAL: 5K Live Signal : Click Here Gold is fast, aggressive, and unforgiving… but with the right strategy, it becomes

Infi Trade: Revoluciona tu Trading con Automatización Avanzada Desbloquea el Poder del Trading Automatizado: Infi Trade es un Asesor Experto de vanguardia diseñado para traders que buscan eficiencia y rentabilidad en el mercado Forex. Nuestro EA aprovecha la sofisticada estrategia de cobertura en rejilla para maximizar tus oportunidades de trading, proporcionando una experiencia de trading automatizada sin interrupciones. Estrategia Inteligente de Cobertura en Rejilla: En el corazón de Infi Trad

Hello, traders! I am Jesus , the ultimate GBP trading machine . My strategy is built on thousands of optimized candle patterns, meticulously refined to extract the best setups on GBPUSD . Precision is my foundation, and my goal is simple: to dominate the GBPUSD market with laser-sharp accuracy. I’m not just an Expert Advisor—I’m a relentless force in GPBUSD trading, designed to cut through market noise and deliver exceptional results. Whether it’s volatile spikes or quiet trends, Jesus i
"GA Moving Average" ("GA Média Móvel") é um Expert Advisor (EA) que utiliza uma estratégia de cruzamento de médias móveis. Ele possui várias configurações para permitir a criação de uma estratégia personalizada, de acordo com a sua visão.
O conceito central do EA "GA Moving Average" é baseado no uso de indicadores de médias móveis para identificar possíveis oportunidades de negociação. Ao analisar a interação entre diferentes médias móveis, o EA busca gerar sinais de compra e venda no mercado.
FREE

Unlock the power of automated trading with the Fully Automated Fibonacci Retracement EA for MetaTrader 5. This Expert Advisor dynamically identifies Fibonacci retracement levels and places trades based on candle formations—completely hands-free. Designed to simplify your trading process, it ensures accurate and timely execution without the need for constant monitoring. Key Features: Automated Trade Execution : The EA automatically analyzes Fibonacci retracement levels and enters trades based on
Unlock the full potential of trading with the Stochastic Oscillator PROject Expert Advisor (EA) , a highly customizable, automated tool built around the widely-used Stochastic Oscillator indicator. This EA is designed with advanced filters and flexible settings, empowering traders to manage risk effectively through customizable parameters such as lot size, stop-loss, take-profit, and session filters. With multiple trend confirmation options and versatile trailing stop methods, the Stochastic
"GA Moving Average" ("GA Média Móvel") é um Expert Advisor (EA) que utiliza uma estratégia de cruzamento de médias móveis. Ele possui várias configurações para permitir a criação de uma estratégia personalizada, de acordo com a sua visão.
O conceito central do EA "GA Moving Average" é baseado no uso de indicadores de médias móveis para identificar possíveis oportunidades de negociação. Ao analisar a interação entre diferentes médias móveis, o EA busca gerar sinais de compra e venda no mercado.
FREE

Apresentando o Last Hope EA , um dos meus 30 melhores EA, o inovador Expert Advisor MQL4 que está transformando a maneira como você negocia! Desenvolvido por mim e com amor, com mais de 5 anos de experiência em negociação. IMPORTANTE! Pares recomendados: EURCHF, EURUSD, USDCHF, GBPCAD e EURCAD Este EA não precisa de descrição, teste você mesmo o EA e veja os resultados. Boa opção para adicionar ao seu portfólio com boa renda passiva segura e investimento de longo prazo! Recomendações: Par d

The Tweezer Bottom candlestick pattern is formed by two candles. Here’s how to identify the Tweezer Bottom candlestick pattern: The first candle is bearish The second candle is bullish The lows from both candles should be pretty much at the same level This 2-candle bullish candlestick pattern is a reversal pattern, meaning that it’s used to find bottoms. For this reason, we want to see this pattern after a move to the downside, showing that bulls are starting to take control. When a Tweezer Bott

The Three Outside Up candlestick pattern is formed by three candles. Here’s how to identify the Three Outside Up candlestick pattern: The first candle is bearish and small The second candle is bullish and engulfs the first one completely The third candle is bullish and closes above the other ones This 3-candle bullish candlestick pattern is a reversal pattern, meaning that it’s used to find bottoms. For this reason, we want to see this pattern after a move to the downside, showing that bulls are

The Bullish Counterattack Line candlestick pattern is formed by two candles. Here’s how to identify the Bullish Counterattack candlestick pattern: The first candle is bearish and big The second candle is bullish and small There’s a gap between the close of the first candle and the open of the second candle They both close at the same level This 2-candle bullish candlestick pattern is a reversal pattern, meaning that it’s used to find bottoms. For this reason, we want to see this pattern after a
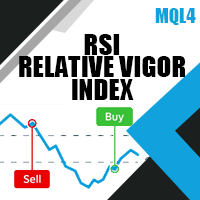
Discover the full potential of automated trading with RSI PROject, our cutting-edge MT5 Expert Advisor (EA). This sophisticated tool is designed to streamline your trading journey, offering a user-friendly interface combined with powerful filters and in-depth customization options. Whether you're a novice or an experienced trader, RSI PROject adapts to your needs, helping you optimize strategies and make informed decisions with confidence. $32 (3 copy left) next price $99 Key Features and Benef

Unlock the full potential of trading with the Parabolic SAR PROject Expert Advisor (EA) , a highly customizable, automated tool built around the widely-used Parabolic SAR indicator. This EA is designed with advanced filters and flexible settings, empowering traders to manage risk effectively through customizable parameters such as lot size, stop-loss, take-profit, and session filters. With multiple trend confirmation options and versatile trailing stop methods, the Parabolic SAR PROject EA ad

Hello, traders! I am Jesus , the ultimate Gold trading machine . My strategy is built on thousands of optimized candle patterns, meticulously refined to extract the best setups on XAUUSD . Precision is my foundation, and my goal is simple: to dominate the Gold market with laser-sharp accuracy. I’m not just an Expert Advisor—I’m a relentless force in gold trading, designed to cut through market noise and deliver exceptional results. Whether it’s volatile spikes or quiet trends, Jesus is here
Unlock the full potential of trading with the ADX PROject Expert Advisor (EA) , a highly customizable, automated tool built around the widely-used ADX indicator. This EA is designed with advanced filters and flexible settings, empowering traders to manage risk effectively through customizable parameters such as lot size, stop-loss, take-profit, and session filters. With multiple trend confirmation options and versatile trailing stop methods, the ADX PROject EA adapts seamlessly to various mar
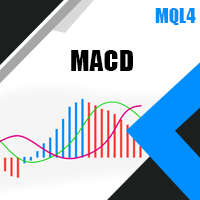
Unlock the full potential of trading with MACD PROject Expert Advisor (EA) , a highly customizable, automated tool based on the popular MACD indicator. The EA is designed with robust filters, allowing traders to manage risks through flexible settings like lot size, stop-loss, take-profit, and session filters. It offers multiple trend confirmation options and trailing stop methods, making it suitable for diverse market conditions. Price : $32 (3 copies left), Next: $99 Full Control Over Your Tra
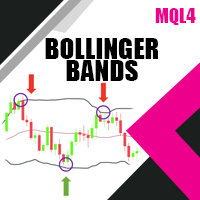
Unlock the full potential of trading with the Bollinger Bands Expert Advisor (EA) , a highly customizable, automated tool built around the widely-used Bollinger Bands indicator. This EA is designed with advanced filters and flexible settings, empowering traders to manage risk effectively through customizable parameters such as lot size, stop-loss, take-profit, and session filters. With multiple trend confirmation options and versatile trailing stop methods, the Bollinger Bands PROject EA adap
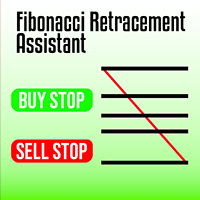
Maximize your trading efficiency with the Fibonacci Retracement Assistant for MetaTrader 5. This powerful tool automates the process of setting Buy Limit and Sell Limit orders as soon as you draw your Fibonacci retracement levels. Designed for traders seeking precision and speed, it eliminates the manual effort of order placement, letting you focus on market analysis. Key Features: Automatic Order Placement : Instantly set Buy Limit and Sell Limit orders when you drag Fibonacci retracement leve

The Hammer candlestick pattern is formed by one single candle. Here’s how to identify the Hammer candlestick pattern: The candle has a small body The wick at the bottom must be big compared to the body At the top, it should have no wick, or be very small The color of the body doesn’t matter This 1-candle bullish candlestick pattern is a reversal pattern, meaning that it’s used to find bottoms. For this reason, we want to see this pattern after a move to the downside, showing that bulls are star

GOLD xKiller is a precision Gold trading EA built on one powerful market truth: strong trends don’t reverse randomly .
By exploiting rare but high-probability streaks of 5+ consecutive daily candles in one direction , this strategy targets exhausted moves with exceptional historical performance on XAUUSD.
Simple logic. Extreme selectivity. Data-backed results that speak for themselves. Fully automatic adviser. - REAL SIGNAL: 3K Live Signal : Click Here Limited price $79 is only for 10 first sa

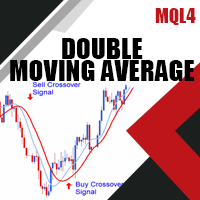
MA Crossover EA is a professional-grade Expert Advisor built on the powerful and time-tested Double Moving Average Crossover strategy , designed to give traders full control, full flexibility, and unlimited customization . The double moving average crossover is one of the most widely used trading concepts in technical analysis. It is simple, effective, and adaptable to all markets and timeframes — Forex, Gold, Indices, Crypto, and more.
This EA takes that classic concept and elevates

Euro xKiller is a precision EURUSD trading EA built on one powerful market truth: strong trends don’t reverse randomly .
By exploiting rare but high-probability streaks of 5+ consecutive daily candles in one direction , this strategy targets exhausted moves with exceptional historical performance on EURUSD.
Simple logic. Extreme selectivity. Data-backed results that speak for themselves. Fully automatic adviser. - REAL SIGNAL: 5K Live Signal : Click Here Limited price $79 is only for

Pound xKiller is a precision GBPUSD trading EA built on one powerful market truth: strong trends don’t reverse randomly .
By exploiting rare but high-probability streaks of 5+ consecutive daily candles in one direction , this strategy targets exhausted moves with exceptional historical performance on GBPUSD.
Simple logic. Extreme selectivity. Data-backed results that speak for themselves. Fully automatic adviser. - REAL SIGNAL: 5K Live Signal : Click Here Limited price $79 is only

GBPJPY xKiller is a precision GBPJPY trading EA built on one powerful market truth: strong trends don’t reverse randomly .
By exploiting rare but high-probability streaks of 5+ consecutive daily candles in one direction , this strategy targets exhausted moves with exceptional historical performance on GBPJPY.
Simple logic. Extreme selectivity. Data-backed results that speak for themselves. Fully automatic adviser. - REAL SIGNAL: 5K Live Signal : Click Here Limited price $79 is onl