DuoFX Divergence Scanner MT4
- Indicadores
-
Dragos Mihai Ofrim
 DuoFX Labs: trading tools for MetaTrader 5 and MetaTrader 4
We build the tools we use ourselves: fast, clean and honest about what they do. Every product ships for both MT5 and MT4 from the same code, is tested on live charts before release, and gets updates when traders ask for something. - Versão: 1.2
- Atualizado: 9 novembro 2026
- Ativações: 10
RSI, MACD or Stochastic divergence across 28 pairs, gold and up to 9 timeframes. One grid. No repainting.
User guide and articles
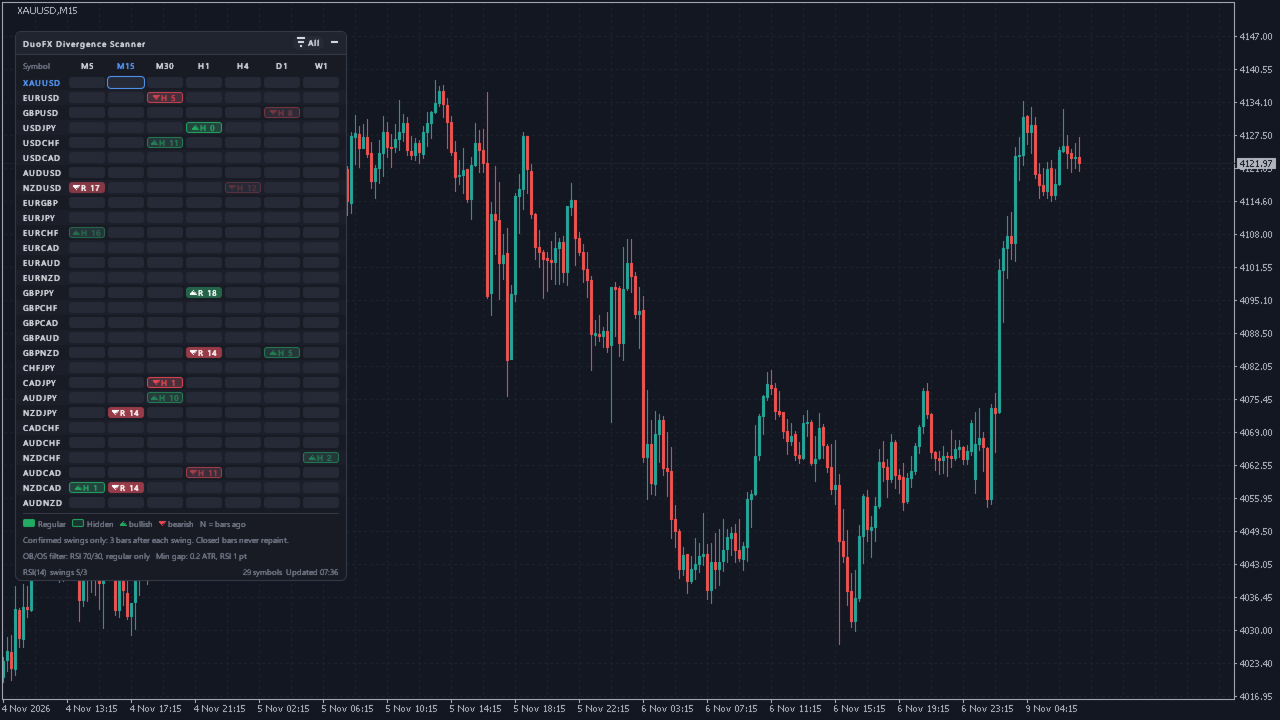
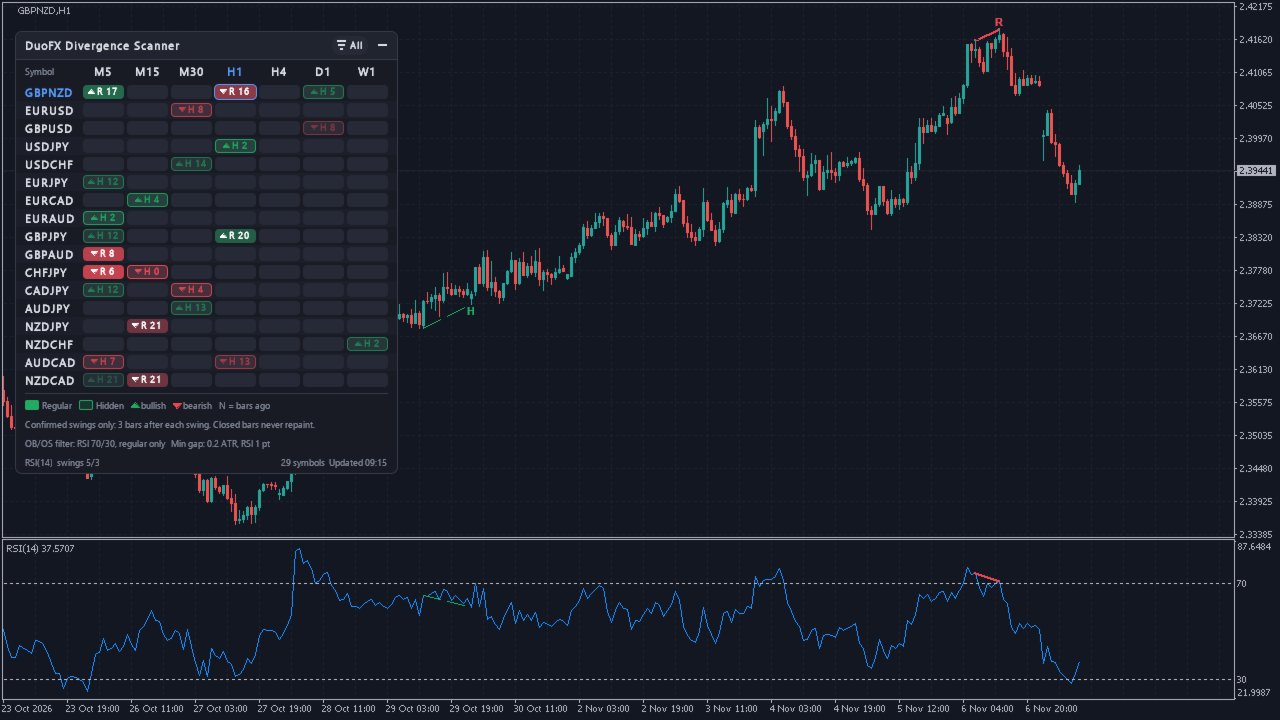
Divergence is one of the oldest warnings in trading: price makes a new high, momentum does not. But hunting for it means flicking through dozens of charts and squinting at an oscillator on each one, and by the time you find it, it is gone. DuoFX Divergence Scanner does the hunting for you. It watches all 28 major and cross pairs plus gold (XAUUSD) on up to 9 timeframes at once, and lights up each regular and hidden divergence that passes your filters as soon as the swing is confirmed. One glance at the grid, one click on a cell, and the chart is in front of you, with the oscillator underneath and the divergence drawn on both.
Who uses it, and how
- Reversal traders: scan for regular divergence from overbought or oversold to find exhaustion at the end of a move.
- Trend traders: hidden divergence on a pullback is a classic continuation warning in a trend.
- Scalpers and day traders: watch M5, M15 and H1 across all pairs and gold without opening a chart for each.
- Swing traders: H4, D1 and W1 divergence on a single screen.
- Multi-timeframe analysis: see when M15 and H4 show the same divergence on the same symbol.
- Gold (XAUUSD) traders: gold is in the default list, with GOLD used when your broker names it that way.
- It is a scanner, not a signal service. It flags divergence; you decide on entry, stop and size.
Non-repainting divergence indicator: confirmed swings only
- A swing only counts once a set number of bars have closed after it (3 by default, your choice).
- The signal appears on the bar that confirms the swing, and from then on it stays as it is until it ages out of the grid. No signals that vanish after the fact, no rewritten history.
- It works on closed bars only, and the panel footer says so.
Regular and hidden divergence: RSI divergence, MACD divergence, Stochastic and more
- Regular bullish and regular bearish: the classic reversal warning.
- Hidden bullish and hidden bearish: a classic trend continuation signal.
- Choose RSI, MACD, OsMA, Stochastic, CCI or Momentum, with your own periods.
- Swings on highs and lows, or on closes. Set how far apart the two swings can be.
- Clean lines mode: only divergences where no bar in between breaks the line, in price or in the oscillator.
- No double tops dressed up as divergence: the two swings must differ by at least 0.2 ATR in price and 1 RSI point (Stochastic 2, CCI 10, MACD / OsMA / Momentum 2% of their recent range). Your numbers, or 0 to switch off.
Overbought and oversold divergence filter: fewer, more selective setups
- On by default for regular divergence: it only counts when the oscillator was stretched. Bearish needs a swing high in overbought, bullish needs a swing low in oversold.
- Hidden divergence forms on pullbacks, where the oscillator sits mid-range, so by default it is not filtered. Switch it on if you want hidden signals from the zones only.
- Classic levels out of the box: RSI 70/30, Stochastic 80/20, CCI +100/-100. Set your own.
- MACD, OsMA and Momentum have no fixed levels, so the zone adapts to each symbol and timeframe: the top or bottom 20% of the last 200 closed bars, your choice.
- Ask for one swing point in the zone or both.
- The grid, the chart lines and every alert follow the filter, and the panel footer shows it.
Multi timeframe, multi symbol divergence dashboard
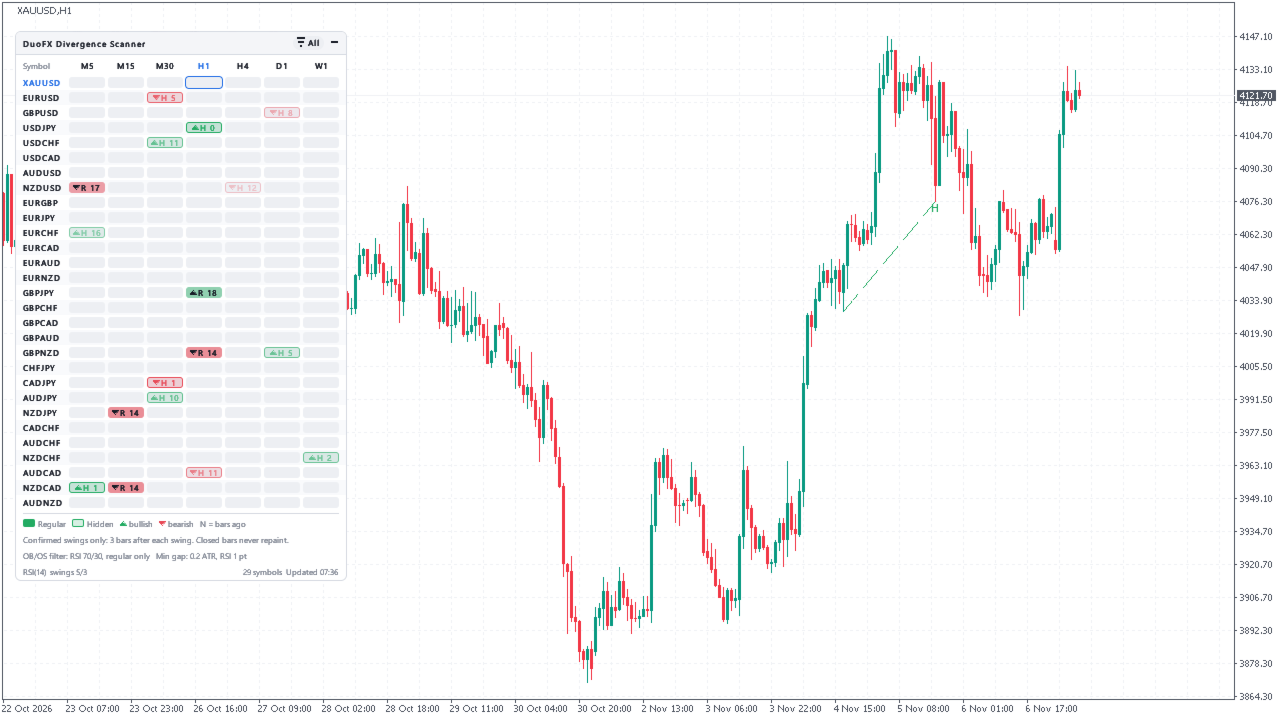
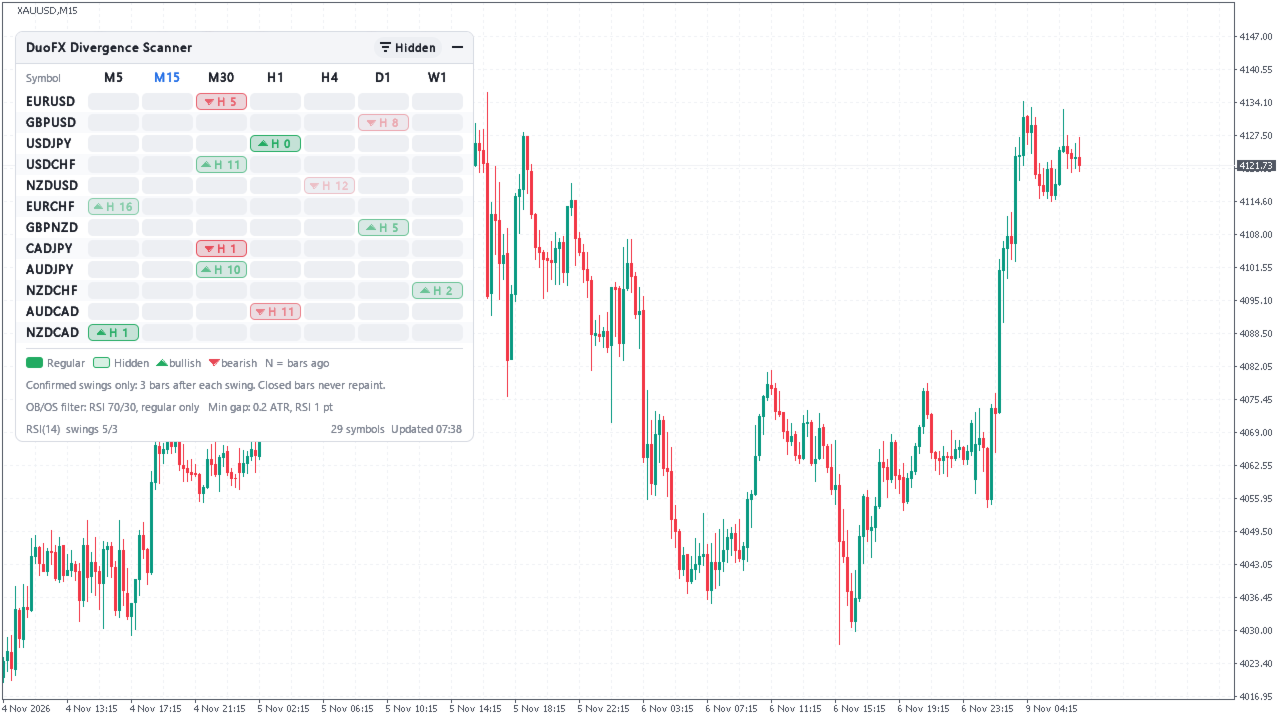
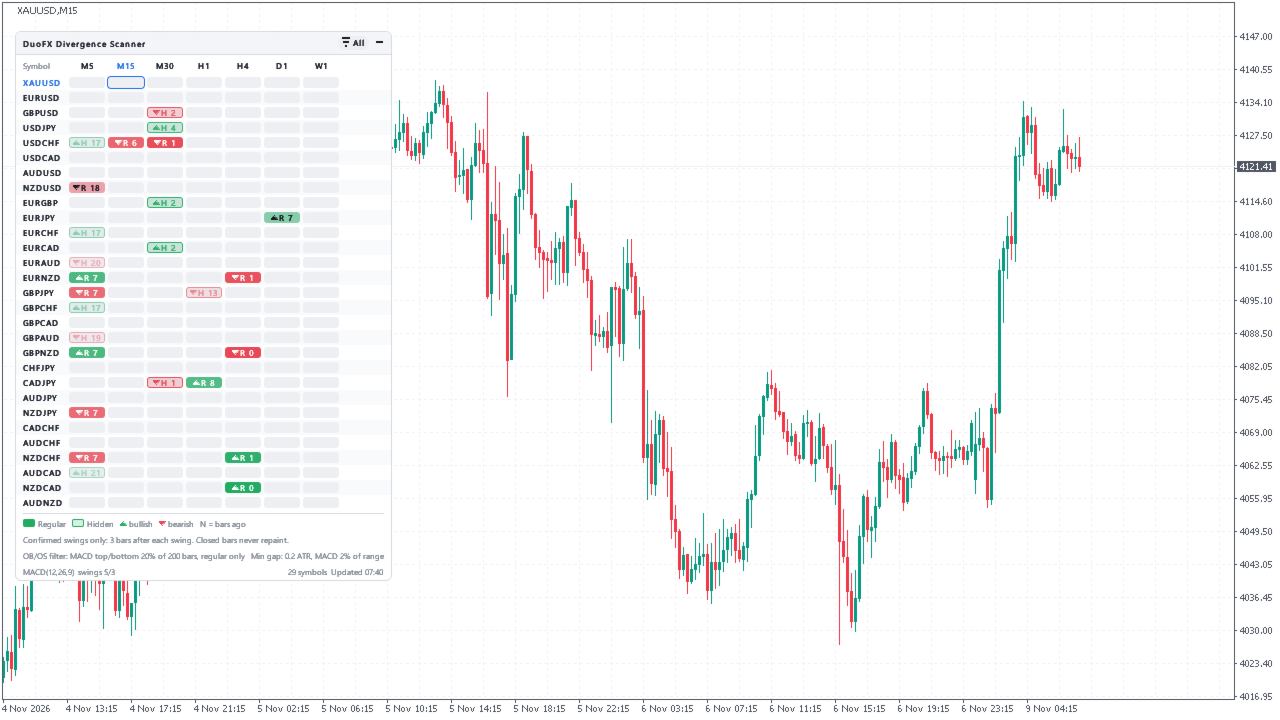
- Solid green and red cells for regular divergence, outlined cells for hidden. An arrow shows the direction and a number shows how many bars ago it confirmed.
- Cells fade as the signal ages, so the freshest setups jump out at you, and drop off when the setup is stale: after 24 bars up to H3, 12 on H4 to H12 (MT4: H1 and H4), 10 on D1 and 4 on W1 and MN1 (all yours to set).
- Each click on the filter button steps through All, Regular, Hidden, Bullish and Bearish.
- Your chart's symbol and timeframe are highlighted on the grid.
- Optional: hide every row without a signal and keep the grid tight.
One click to the chart, with the oscillator in place
- Click any cell and your chart switches to that symbol and timeframe. Prefer a new window? Set it to open a new chart instead.
- Click a symbol name to switch symbol, or a timeframe header to switch timeframe.
- The chart gets the scanner's oscillator in its own pane: the same oscillator and periods (RSI, MACD, OsMA, Stochastic, CCI or Momentum). No more adding it by hand and retyping the numbers.
- Each divergence is drawn twice: on the candles and in the oscillator pane, in the same colour and style (solid for regular, dashed for hidden). Price line against oscillator line, side by side, so you can judge the setup in a second.
- Never a duplicate pane: if the chart already shows that oscillator, it is used as it is. With "Add the oscillator to the chart (on a click)" on, change the scanner's oscillator and only the pane the scanner added is swapped; your own indicators stay, even ones you dropped into that pane.
- Two scanners on one chart (say RSI and MACD) each add their own pane and never remove each other's.
- Lines are capped at a safe number of objects.
Divergence alerts that never nag twice
- Popup, push notification, email and sound, each one on or off.
- Every signal alerts once, right after the bar that confirms it closes. No repeats, no history spam when you load the indicator. Run one instance for alerts: each chart with the scanner alerts on its own.
- Push and email use the settings in Tools > Options.
- Alerts follow your filter, so you only hear about the types you trade.
A clean, solid dashboard
- Solid panel drawn above the candles. Candles never bleed through.
- Drag it anywhere. It remembers its position, filter and minimised state when you change symbol or timeframe, and after a restart.
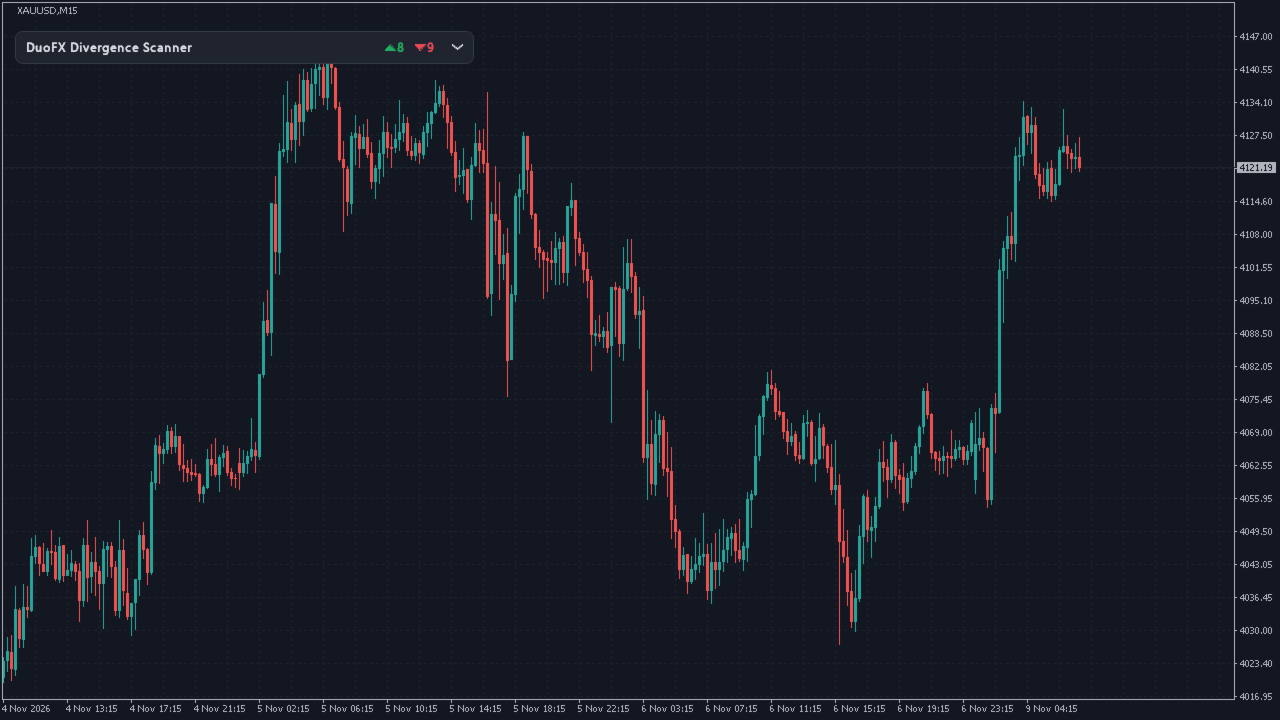
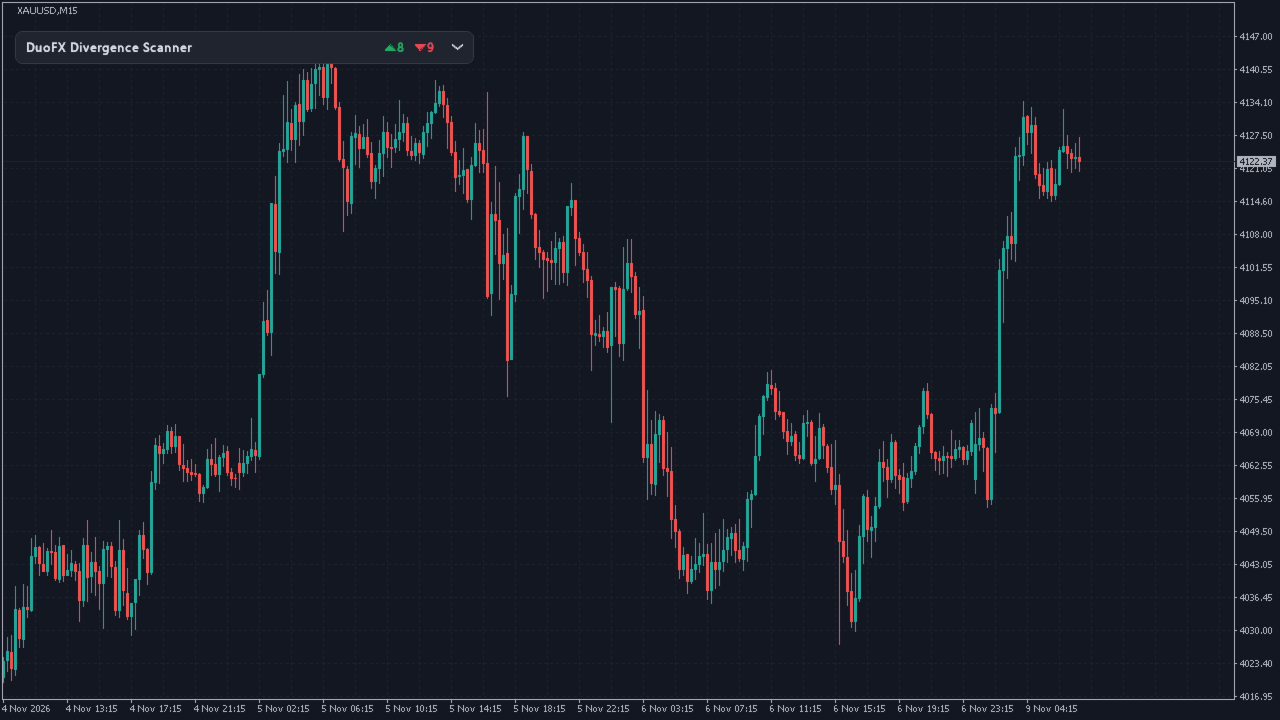
- Collapse it into a sleek bar that still counts the bullish and bearish signals. One click and it rolls back open.
- Dark, light, or automatic to match your chart.
- The panel fits your chart: on a short or narrow chart it steps the font down, and drops the footer notes if it must, so the whole grid stays visible, measured from wherever you dragged it.
Engineered to stay light
- Runs on a timer, not on every tick.
- Each symbol and timeframe is only recalculated when a new bar closes there.
- Work is spread out in small time slices, so the terminal stays responsive while it scans.
- Missing history loads in the background while the rest of the grid keeps working. The first start can take a few minutes while your terminal downloads history for every symbol.
- Works with most brokers: common symbol prefixes and suffixes (EURUSD.a, EURUSDm and others) are detected automatically, or type yours in, GOLD is used when XAUUSD is not offered, and missing symbols are skipped.
- Your own symbol list? Type up to 40 symbols: indices, metals, crypto, anything your broker offers.
- The symbols it scans are added to Market Watch.
- No DLLs, no internet connections, nothing to install. Drop it on a chart and go.
Divergence scanner FAQ
- Does it repaint? No. A swing counts only after the bars you set have closed after it, and a signal stays as it was when it appeared. It works on closed bars.
- Which oscillators? RSI, MACD, OsMA, Stochastic, CCI and Momentum, with your own periods. One oscillator at a time per instance.
- What is hidden divergence? Price makes a lower high while the oscillator makes a higher high (or the mirror on lows). Traders read it as the trend continuing.
- Does it scan gold and indices? Gold is in the default list. Type your own symbol list for indices, metals or crypto.
- Which timeframes? Up to 9 at once, M1 to MN1, your choice (default M5 to W1, 7 columns).
- Will it slow my terminal? It runs on a timer, recalculates a symbol and timeframe only when a new bar closes there, and spreads the work in small slices.
- Does it trade for me? No. It is an indicator and never opens or closes trades.
- MT4 or MT5? Both, sold as two products, same engine. MT4 offers its 9 standard timeframes (M1 to MN1); MT5 adds M2 to H12. On MT4 a cell still downloading history can show n/a for a minute.
- Can I try it in the demo? The Strategy Tester runs one symbol, so the demo scans only the tested symbol, and clicks and alerts are off there. The full grid, clicks and alerts work in the live terminal.
- What does n/a mean? Not enough history on that timeframe. Right after the first start it can also mean history is still arriving; it fills in by itself.
- Does the chart I click get the oscillator? Yes, by default, unless the chart already shows it. A click adds the scanner's oscillator, same oscillator and periods, in a pane under the chart, and the divergence lines appear in that pane as well as on the candles. The pane stays when you click on to other symbols. Turn it off with "Add the oscillator to the chart (on a click)". On MT5 the pane shows the terminal's standard levels; on MT4 it shows the scanner's overbought / oversold levels.
- Will it remove my indicators? No. It never adds a second copy of an oscillator the chart already shows, and when you change the scanner's oscillator it replaces only the pane it added itself.
- Anything different on MT4? MT4 cannot add an indicator from code, so the scanner adds the pane by reloading that chart's own template once, with the oscillator in it, and once more if you later change the scanner's oscillator. Your indicators and drawings are kept, and other indicators on that chart restart once. A chart running an Expert Advisor is never reloaded, so the EA is never restarted: there the scanner tells you once to add the oscillator by hand, or to set "Click on a cell" to "Open a new chart".
- What does "Open a new chart" give me? On MT4 and MT5, with "Add the oscillator to the chart (on a click)" on, the new chart gets this chart's colours, the oscillator and a copy of the scanner for that one symbol with alerts off, so you never get the same alert twice. With it off, the new chart opens with your default template.
Available for MetaTrader 5 and MetaTrader 4.
Settings
- Oscillator: RSI, MACD, OsMA, Stochastic, CCI or Momentum, with periods
- Swings on highs and lows or on closes
- Bars before a swing, bars after a swing (confirmation, default 3)
- Min and max bars between the two swings
- Clean lines only (on or off)
- Show signals up to N bars old, by timeframe: M1 to M30 (default 24), H1 to H3 (24), H4 to H12 (12), D1 (10), W1 and MN1 (4)
- Types shown at start: all, regular, hidden, bullish or bearish
- Overbought / oversold filter: on or off (default on)
- Zone points required: at least one swing point (default) or both
- Apply the filter to hidden divergences too (default off)
- RSI levels (default 70/30), Stochastic main line levels (default 80/20), CCI levels (default +100/-100)
- MACD, OsMA and Momentum: zone as the top / bottom % of values (default 20) over the last N closed bars (default 200)
- Minimum price gap between the two swings in ATR (default 0.2, 0 = off) and the ATR period (default 14, MT5 ATR)
- Minimum oscillator gap: RSI (default 1 point), Stochastic (2), CCI (10), MACD / OsMA / Momentum (2% of their range over the N bars above); 0 = off
- Symbols (blank = 28 majors and crosses plus XAUUSD), timeframes (up to 9), add the chart symbol
- Hide rows with no signal
- Symbol prefix / suffix (blank = automatic)
- Click on a cell: switch this chart, open a new chart, or do nothing
- Add the oscillator to the chart (on a click) (default on): the scanner's oscillator, same periods, in its own pane
- Max cells computed per refresh (lower = lighter)
- Alerts: popup, push, email, sound, sound file
- Chart lines: on or off, bars to search, max divergences drawn, line width
- Corner, horizontal and vertical offset, theme, font, font size, start minimised
How it works A swing high is a bar whose high is above the bars before it and not exceeded by the bars after it (lows mirrored). When a new swing is confirmed, it is compared with the nearest earlier swing of the same kind. Regular bearish: price makes a higher high while the oscillator makes a lower high. Hidden bearish: price makes a lower high while the oscillator makes a higher high. Bullish types mirror this on the lows. The two swings must differ by the minimum gaps in price and in the oscillator. Each cell shows the most recent divergence that passes your filter and is not older than the age set for its timeframe.
How the overbought / oversold filter works With the filter on, a regular divergence counts only if at least one of its two oscillator swing points is in the extreme zone (or both, if you choose). Hidden divergences pass too only if you apply the filter to them (off by default). Bearish: at least one oscillator swing high is at or above the overbought level. Bullish: at least one oscillator swing low is at or below the oversold level. RSI, Stochastic (main line) and CCI use the levels you set. MACD, OsMA and Momentum have no fixed bounds, so their zone is adaptive: a swing high is in the zone when at least 80% (100 minus your percentage) of the last 200 oscillator values are below it, and a swing low when at least 80% are above it. Those 200 values are the closed bars up to and including the bar that confirms the divergence, so the zone uses only what was known when the signal appeared and never repaints. A flat oscillator has no extreme, so nothing passes. The filter only removes divergences, it never swaps in an older swing. The adaptive zone needs that many extra bars of history, so a timeframe with less shows n/a. Right after the first start, n/a can also mean history is still arriving; it fills in by itself.
Disclaimer: Trading forex and CFDs is high risk and markets can move fast. This indicator is a market analysis tool for educational and informational purposes only. It is not financial advice and does not guarantee results. Past performance does not indicate future results.