Conheça o Mercado MQL5 no YouTube, assista aos vídeos tutoriais
Como comprar um robô de negociação ou indicador?
Execute seu EA na
hospedagem virtual
hospedagem virtual
Teste indicadores/robôs de negociação antes de comprá-los
Quer ganhar dinheiro no Mercado?
Como apresentar um produto para o consumidor final?
Novas ferramentas de negociação para MetaTrader 5 - 27

Exit based Indicator - What is it? Exit your open positions based on up to 10 indicators. Even those you buy in Market !!! Use any indicator that provides buffer values (most of them output buffers). You can use any available buffers and even compare various indicator values. Selectors for exiting Buy Positions and Sell Positions are separate. The EA works in AND or OR mode. You can combine multiple instances to create elaborate rules. NO BROKER SIDE STOP LOSS IS USED.
Usage Ideas / Examples -

PanelTool Button Click trading (Replace Default Trade Panel)
Features
01. Button Click open or close Long positions
02. Button Click open or close Short positions
03. Set Lot sizes
04. Set SL or TP points
05. Set order's commentment
06. Show BreakEven price
07. Show Long or Short Lots
08. Show Profit or Loss USD
09. Show Daily Profit or Loss USD
10. Set ID=0 to handle manual orders together
FREE

Telegram Notify MT5
Telegram Notify MT5 is an utility tool to bridge your MetaTrader 5 activities to your Telegram chat/channel. It is useful for monitoring your MetaTrader 5 account by sending a notification to your particular Telegram chat/channel when someone/EA is placing trades, modifying order's TP/SL, closing trades and etc. This EA does not place any trade for your account. This EA also could be a convenient tool for monitoring other's EA trading activities or a tool for publishing you
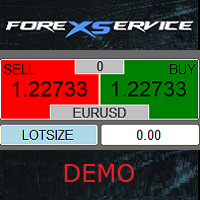
Important! Demo version will work only on EURGBP. One Click Trader is a tool designed for MetaTrader 4 platform, which enables you to take your trading to the next level. It enables you to open, manage and close your trades in simple an efficient way by just one click of your mouse button. "-" , "+" change OCT window size Up arrow minimizes the OCT panel Down arrow maximizes the OCT panel Right arrow displays the next panel with additional features Left arrow hides the panel with additiona
FREE
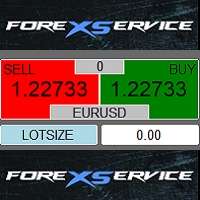
One Click Trader is a tool designed for MetaTrader 4 platform, which enables you to take your trading to the next level. It enables you to open, manage and close your trades in simple an efficient way by just one click of your mouse button. "-" , "+" change OCT window size Up arrow minimizes the OCT panel Down arrow maximizes the OCT panel Right arrow displays the next panel with additional features Left arrow hides the panel with additional features Red SELL button enables you to open s

Idea I programmed this tool out of the necessity to be constantly informed about what is going on. Before I sometimes forgot to set a stopp loss, this is impossible with this tool. Further this tool allows you to make distributed entries, eg. with a first feeler with 0.1 contracts and when the direction is the right one you just put more contacts into the game. Money- and risk management is built in. If you use more then the predetermined number of contracts there is a warning. You are constantl
FREE

OrderBook Utilities is a script, which performs several service operations on order book hob-files, created by OrderBook Recorder . The script processes a file for work symbol of the current chart. The file date is selected by means of the input parameter CustomDate (if it's filled in) or by the point where the script is dropped on the chart. Depending from the operation, useful information is written into the log, and optionally new file is created. The operation is selected by the input parame
FREE

Order Book, known also as Market Book, market depth, Level 2, - is a dynamically updated table with current volumes of orders to buy and to sell specific financial instument at price levels near Bid and Ask. MetaTrader 5 provides the means for receiving market book from your broker, but in real time only, without access to its history. This expert adviser OrderBook History Playback allows you to playback the market book events on the history using files, created by OrderBook Recorder . The exper
FREE

Order Book, known also as Market Book, market depth, Level 2, - is a dynamically updated table with current volumes of orders to buy and to sell specific financial instument at price levels near Bid and Ask. MetaTrader 5 provides the means for receiving market book from your broker in real time. The expert OrderBook Recorder records market book changes and stores them in local files for further usage in indicators and expert adviser, including testing in the tester. The expert stores market book
FREE
The utility is designed to display on the chart the margin zones built on the basis of margin requirements for futures of the Chicago Mercantile exchange (CME). These margin zones are good levels of resistance and support, as seen in the screenshots.
How to use To trade on margin zones, use the following rules: buy after the day has closed above one of the zones to the next zone; sell after the day has closed below one of the zones to the next zone; after opening a sell trade, place limit sell
Renko indicator helps develop Renko charts on different symbols.
Advantages Drag and drop the indicator on M1 timeframe of the symbol chart Realtime updates Indicator can be used for Expert Advisors and technical analysis Backtest your strategy using Renko indicator
Parameters BOX SIZE: Input the number of box size. The box size reflects the difference of the symbol price. So, a 50 box size would reflect a 5 pip value difference in a currency pair symbol Show Wicks: If true , high or low of

This is a series of gauges that can be loaded on any Chart time frame. You can use this gauge indicators to decide when to enter and exit market with high degree of confident. Gauge No 1: Ichimoku Kinko Hyo Tenken Sen Crosses Kijun Sen. This will tell Bull and Bear and the timing to enter market. When the value move from above 0 towards below 0, the Tenken Sen line is moving to cross the Kijun Sen line and appears value is the Delta for the difference. Same goes to the opposite. The positive val

Demo copier of deals from MetaTrader 5 to MetaTrader 5 ( MetaTrader 4<->MetaTrader 4 version is available ; with both versions, you can copy MetaTrader 5<->MetaTrader 4, MetaTrader 4<->MetaTrader 5, MetaTrader 5<->MetaTrader 5, MetaTrader 4<->MetaTrader 4). Works only in the mode of hedging. Spread filter. Select the best price (start copying positions with a profit or loss). Configure the lot size, fixed or ratio-based (provider signals can be copied with an increased lot). Configure order copy
FREE

Copier of deals from MetaTrader 5 to MetaTrader 5 ( MetaTrader 4<->MetaTrader 4 version is available ; with both versions, you can copy MetaTrader 5<->MetaTrader 4, MetaTrader 4<->MetaTrader 5, MetaTrader 5<->MetaTrader 5, MetaTrader 4<->MetaTrader 4). There is a demo version (restricting by grades and by lots) Works only in the mode of hedging Spread filter. Select the best price (start copying positions with a profit or loss). Configure the lot size, fixed or ratio-based (provider signals can
This utility displays the information required for making trades on each opened chart. For example: spread value, swap value; triple swap day; session closing time; ATR of the symbol by Gerchik; total profit/loss for the current symbol; the number of trades made earlier; the percentage change in the quotes of 6 selected instruments; and much more. The spread value is always shown. The rest of the information is displayed depending on the settings: Show total orders at the moment (long, short) .
FREE
This utility displays the information required for making trades on each opened chart. For example: spread value, swap value; triple swap day; session closing time; ATR of the symbol by Gerchik; total profit/loss for the current symbol; the number of trades made earlier; the percentage change in the quotes of 6 selected instruments; and much more. The spread value is always shown. The rest of the information is displayed depending on the settings: Show total orders at the moment (long, short) .

This utility clones the chart it is running on. It opens the same chart with the same graphical objects, set of indicators (saving the parameters) and the rest of the elements. In essence, it performs a deep copying of the original chart, transferring the template to the opened chart. The symbol and the timeframe of the original chart are also saved.
FREE
Check Online-Status monitors your terminal. If its connection to the server is interrupted for longer time, you will receive an email and/or a push notification, depending on what your settings. You can find out how long the terminal has been offline and can judge the quality of your brokers and/or the provider of your VPS after some time. Remember, the terminal manages and controls your money. Everything hangs in the air if it has no connection to the server! Check Online-Status displays the th

Risk Optimizer is the absolute solution for applying risk management on your account. Bad risk management is the main reason that causes traders to lose money. Risk Optimizer calculates and suggests the correct lot size for each position according to your personal, customized risk profile. You can give directly your preferred risk as percentage (%) for each position or you can trust our algorithms to calculate and optimize according to your risk category selection. But it is not only that! Selec
FREE

A utility used to create custom Tick or Volume bar charts and provide real-time updates. This is an MT4 "offline" chart equivalent which is very simple to use. You can attach any MT5 compatible indicator or template to the tick chart and perform your technical analysis.
Tick charts measure the number of transactions per bar. You can choose any number of ticks per bar but most traders choose Fibonacci numbers (1, 2, 3, 5, 8, 13, 21, 34, 55, 89, 144, 233...). The generator uses tick data to plot
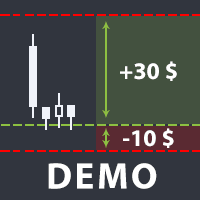
The utility helps open a deal with a stop loss that does not exceed the specified amount, or to refrain from it altogether. That is, it determines the number of lots to open the deal so that the stop loss is as close as possible to the specified amount in USD without exceeding it. For example, it will be indispensable when trading according to the Gerchik strategy. That is, when trading based on risks, with a fixed risk and a fixed take profit relative to stop loss. For example, if you always op
FREE
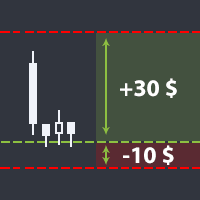
The utility helps open a deal with a stop loss that does not exceed the specified amount, or to refrain from it altogether. That is, it determines the number of lots to open the deal so that the stop loss is as close as possible to the specified amount in USD without exceeding it. For example, it will be indispensable when trading according to the Gerchik strategy. That is, when trading based on risks, with a fixed risk and a fixed take profit relative to stop loss. For example, if you always op
Robust trading panel for use on any symbol (including RangeBars or Renko custom symbols). The tool can be placed anywhere on the chart and offers the following array of features: One-click instant order entry. Pending order entry using horizontal lines on the chart Pending order entry using keys in Entry price (E/P) and optional Stop Loss (S/L) and/or Take Profit (T/P) A choice between fixed trading volume or risk-based volume calculation based on the available account equity, entry price, and t

Pointer synchronization MT5 is an indicator with which the pointer can be synchronized in all the visible graphics of the terminal. It shows a cross cursor on all the visible graphics of the terminal, in position relative to the cursor of the active graph. To activate the indicator, simply press the button that appears in one of the corners of the chart once the indicator is added to the chart. To deactivate the indicator, simply press the button again. Once the indicator has been deactivated,

Presentation The URL html and xml to csv is designed to get contents from URLs with html or xml content, and to download it to an output format as a txt or as a csv file. It enables to get the whole web sites page, starting with the http protocol, in a document for a further use and in additional with downloading directly on the MetaTrader applications and on the desktop. It is a good advantage for taking the most data from events and economic calendars, and also publications related to the inst
FREE

Presentation The URL html and xml to csv is designed to get contents from URLs with html or xml content, and to download it to an output format as a txt or as a csv file for MetaTrader 5. It enables to get the whole web sites page, starting with the http protocol, in a document for a further use and in additional with downloading directly on the MetaTrader applications and on the desktop. It is a good advantage for taking the most data from events and economic calendars, and also publications re
This indicator is designed to provide all useful information about symbol, account, positions and profit. It is developed for improving trader's money management.
Parameters Calc can be divided to separate blocks. Each block is possible to hide, set its own color and other properties. Block symbol: This block displays information about actual SPREAD, POINT VALUE (in deposit currency for 1 lot), SWAP LONG and SHORT. Show symbol info - display/hide this block Color of symbol info - color of this
FREE

Market Grid View is a utility to replace the original 'Market Watch' window. It was designed to be fast and give the user the ability to navigate over all symbols with just a click, while watch the price change or last trade value. To use it, configure your "Market Watch" window with all the symbols you want to monitor, and you can close it. Then insert the indicator in the graph. The parameters window need to be configured: Columns: the number of columns you want to be drawn ShowInfo: the type
FREE

TCP - Trader Control Panel is an extension to build into MetaTrader 5 manual methods to control open positions. It adds opening and closing position feature as well as user-friendly monitoring dashboard, money and risk management when opening. Opening and closing positions are done by mouse by interactively placing stop loss line on appropriate level or by pressing predefined keys on keyboard. Before opening a new position, the EA calculates such lot size, which will guarantee you no more losses
FREE

TCP - Trader Control Panel is an extension to build into MetaTrader 5 manual methods to control open positions. It adds opening and closing position feature as well as user-friendly monitoring dashboard, money and risk management when opening. Opening and closing positions are done by mouse by interactively placing stop loss line on appropriate level or by pressing predefined keys on keyboard. Before opening a new position, the EA calculates such lot size, which will guarantee you no more losses

This is a demo version of a non-trading expert , which utilizes so called the custom symbols feature ( available in MQL as well ) to build renko charts based on historical quotes of selected standard symbol and to refresh renko in real-time according to new ticks. Also it translates real ticks to the renko charts, which allows other EAs and indicators to trade and analyze renko. Place the EA on a chart of a working instrument. The lesser timeframe of the source chart is, the more precise resulti
FREE

This non-trading expert utilizes so called custom symbols feature ( available in MQL as well ) to build renko charts based on historical quotes of selected standard symbol and to refresh renko in real-time according to new ticks. Also, it translates real ticks to the renko charts, which allows other EAs and indicators to trade and analyze renko. Place RenkoCharts on a chart of a work instrument. The lesser timeframe of the source chart is, the more precise resulting renko chart is, but the lesse

This utility changes the behavior of auto-scroll. It removes the need to manually disable and re-enable the auto-scroll function.
Main features Disables auto-scroll - when the screen is scrolled backwards to look at the price history. Enables auto-scroll - when moved back to current history.
Inputs None.
Note I recommend testing when markets are open, since auto-scroll works when there are incoming ticks.

Super ATR is a powerful tool for analyzing the ATR (Average True Range) levels. The intuitive interface allows you to easily monitor all the main ranges of volatility.
Key Features Plots the daily АТR areas on the chart. Plots the weekly АТR areas on the chart. Plots the monthly АТR areas on the chart. Displays a panel with the current values of the main volatility ranges (M5,H1,D1,W1,MN) on the chart. The areas and values in the table change their color when the ATR level is reached. Draws th
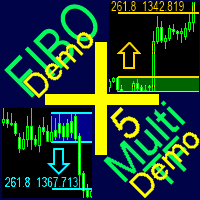
A ready-made multitimeframe trading system based on automatic plotting and tracking of Fibonacci levels for buying and selling any symbol. Demo version - calculation of the last 390 bars is not performed.
Advantages Determines the trend direction based on a complex of 14 indicators ( Cx ), extremums of ZigZag ( Z ), RSI ( R ), Impulse ( I ) Displaying the values of 14 indicators comprising the trend direction ( Cx ) Plotting horizontal levels, support and resistance lines, channels View the pl
FREE
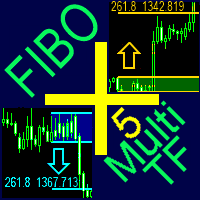
A ready-made multitimeframe trading system based on automatic plotting and tracking of Fibonacci levels for buying and selling any symbol.
Advantages Determines the trend direction based on a complex of 14 indicators ( Cx ), extremums of ZigZag ( Z ), RSI ( R ), Impulse ( I ) Displaying the values of 14 indicators comprising the trend direction ( Cx ) Plotting horizontal levels, support and resistance lines, channels View the plotting option of Fibonacci levels on any timeframe, with the abili

The Quick trade report separately by symbols script will be useful for simultaneous trading on multiple instruments. It provides the ability to assess the effectiveness of trading on each symbol separately. It is possible to set a time period for making the reports. The report visualizes the changes in the balance for deals on each symbol. Also, the following key trading parameters are calculated for each instrument: Total net profit - the financial result of all trades. This parameter represent
The " Delta Volume histogram " Expert Advisor plots histograms of "Delta volume", "Real volume", "Buy volume", "Sell volume", "Tick volume".
EA version: Has a built-in «Pending orders indicator". The indicator is designed for analysis of pending orders in the market, available in "MarketBook". Displays the Volume profile levels (VAH VAL from 60% to 85%). Built-in side histogram. This is a powerful tool for analyzing trade volumes. The chart is plotted based on tick data.
Depending on the broke

Spread Costs refers to the amount of the loss caused by the spread, and Swap Benefits refers to the amount of the income gained by overnight positions. Spread Costs is an important indicator for short-term traders, especially for scalping traders, and Swap Benefits is an important indicator for long-term traders. Since the spreads and swaps on the MetaTrader 5 platform are all expressed in points, we need to convert it into the amount expressed in the account currency. This tool can display the

The Universal Signal Dashboard (USD) is a signal dashboard or indicator matrix. It can generate a matrix of signals from values, chart and candle prices, and from the buffer output of almost any technical indicator. However, unlike most dashboards of the same category, USD is configurable based on the inputs provided by the user within the app interface. The tabs (Display, Data, and Signals tabs) starts empty and the Display tab will show more display entries as the user adds more signal entries
FREE

The Universal Signal Dashboard (USD) is a signal dashboard or indicator matrix. It can generate a matrix of signals from values, chart and candle prices, and from the buffer output of almost any technical indicator. However, unlike most dashboards of the same category, USD is configurable based on the inputs provided by the user within the app interface. The tabs (Display, Data, and Signals tabs) starts empty and the Display tab will show more display entries as the user adds more signal entries

Professional renko charting on a custom symbol chart
accurate pricing to the tick accurate timeline (no future date projections )
every renko variation in a single package very responsive charts optional display of live trade levels on the chart
An Expert Advisor (EA) used to create custom Renko charts and provide real-time updates. This is an MT4 "offline" chart equivalent which is very simple to use. All historical renkos are constructed using real tick data from the broker's server.

Risk Manager Pro is a simple utility that calculates the necessary lots with the risk percentage and the pips of stop loss, before opening positions. The web calculators can be useful in some cases but they are not efficient to open operations in real time. In the trading days, there are few opportunities to open positions and when the opportunity arises, the seconds make the difference. This is not possible with conventional web calculators, since to calculate the size of an operation regarding

Professional range bar charting on a custom symbol chart accurate pricing to the tick accurate timeline (no future date projections) very responsive charts An Expert Advisor (EA) is used to create a RangeBar custom chart and provide real-time updates. It is an MT4 "offline" range bars chart equivalent. The simplicity of use - Attach the EA to any time-based chart that you wish to see Range Bars for, input your desired parameters and you are ready to go! You can attach any MT5 compatible indicat

The trade cost caused by spreads is an important indicator when formulating trade profit-loss ratios. Spread costs info is particularly important for short-term traders, especially scalping traders. This tool can output the spread cost of all Forex currencies (including XAU and XAG) in the platform in different account types (USD account, EUR account, etc.).
Calculation and code See articles: THE TRADE COST OF FOREX CURRENCY Part1 THE TRADE COST OF FOREX CURRENCY Part2 THE TRADE COST OF FOREX
FREE

Copyist MS — это простой и удобный в использовании торговый копир. Работает как однофайловый советник с переключаемыми режимами работы Master и Slave. Ордера можно копировать из МТ5 в МТ5, из МТ5 в МТ4, из МТ4 в МТ5. Для копирования ордеров в MetaTrader 4 требуется версия советника для MetaTrader 4. Текущая версия советника работает только на ХЕДЖИНГОВЫХ счетах. Параметры Тип работы - выбор режима работы: Master или Slave; Копировать по магическому номеру - копирование торговых ордеров по магич

Free version. Only works on EURUSD. Would you like to have statistics about your trades displayed while you operate? Have you a solid understanding of the symbol you are trading? Do you really know everything you need to about your trading account? Do you need to keep an eye on the local times around the world? Advanced Info Displayer answers to all that. It helps you to know many hidden or hard to find data. Also, it is very convenient if you value statistics and maths. Just to exemplify, in mo
FREE
Would you like to have statistics about your trades displayed while you operate? Have you a solid understanding of the symbol you are trading? Do you really know everything you need to about your trading account? Do you need to keep an eye on the local times around the world? Advanced Info Displayer answers to all that. It helps you to know many hidden or hard to find data. Also, it is very convenient if you value statistics and maths. Just to exemplify, in more than 80 lines of information you

As the name suggests, the utility collects ticks and uploads them to a file. Each symbol receives its own folder. A directory in the symbol folder is created for each date so that you can find ticks of a necessary symbol and date quickly and easily. The collector is made as fast as possible within MQL. One collector is sufficient for each symbol. Timeframe does not matter. The utility features the function for displaying ticks collected in a file on a chart. You can also navigate ticks using a k
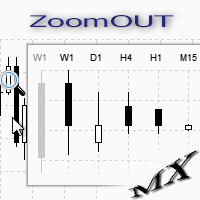
ZoomOUT allows you to have a quick look at a selected bar on a higher timeframe in a pop-up window. After the launch, the indicator works in the background mode occupying no place in the chart and consuming no resources. When activating the indicator by Shift + o (customizable), a pop-up window with a chart displaying bars of higher timeframes is created. To hide a pop-up window, left-click on any clear place on the chart. The indicator is simple and requires no settings.
FREE

This is a utility designed to automatically set the stop loss levels of orders according to the specified condition. Two price levels serve as the condition for setting stop loss: Trigger level - when this level is reached, an order is placed. The stop loss value of an order. It is possible to enable or disable traling stop loss.
Input parameters Order type for execution - type of orders to be processed by the expert. It can either be BUY, SELL or auto-select. Trigger Level Points - level to p
The CAP Equity Guard MT5 is an expert advisor that constantly monitors the equity of your trading account and prevents costly drawdowns. The CAP Equity Guard EA MT5 is a useful tool for money managers! When an emergency procedure takes place, you are notified by visual, email and push alerts. The EA performs the following tasks: It monitors your entire trading account. Easy to use! Just drag it to a random empty chart. It will work perfectly, if MetaTrader restarts. It can be workable with y
FREE

Calculation panel has been developed to aid in Forex trading using a method based on correlation dependence of currency pairs. The panel implements: Due to the fact that the working instruments of the "basket" have an equal volatility and pip values, the panel provides automatic calculation of the second instrument's lot size. To analyze the relative divergence of two currency pairs, the information based on the RSI indicator values (in percentages) are shown on the panel. Information on swaps o
A ready-made trading system based on automatic plotting and tracking of Fibonacci levels for buying and selling any symbol on any timeframe. Demo version - calculation of the last 290 bars is not performed.
Advantages Determines the trend direction (14 indicators) Displays the trend strength and the values of indicators comprising the trend direction Plotting horizontal levels, support and resistance lines, channels Selection of the Fibonacci levels calculation type (6 different methods) Alert
FREE
A ready-made trading system based on automatic plotting and tracking of Fibonacci levels for buying and selling any symbol on any timeframe.
Advantages Determines the trend direction (14 indicators) Displays the trend strength and the values of indicators comprising the trend direction Plotting horizontal levels, support and resistance lines, channels Selection of the Fibonacci levels calculation type (6 different methods) Alert system On-screen Email Push notifications
Buttons Changing the

This panel shows the price position and the selected MAs for the selected timeframes and symbols.
You can control up to 3 symbols; up to 6 timeframes; up to 10 different Moving Averages. Version for MetaTrader 4: https://www.mql5.com/ru/market/product/28281 Version for MetaTrader 5: https://www.mql5.com/ru/market/product/28096
Parameters NUM_BAR - bar number for analysis; timeframe_1....timeframe_6 - names of used timeframes (if set to "current", the timeframe will not be used); symbol_1 .
FREE

This tool will allow you to export the Historical data (Open, High, Low, Close, Volume) for any financial instrument present in your MetaTrader 5. You can download multiple Symbols and TimeFrames in the same csv file. Also, you can schedule the frequency of download (every 5 minutes, 60 minutes, etc.). No need to open a lot of charts in order to get the last data, the tool will download the data directly. The CSV File will be stored in the folder: \MQL5\Files .
How it works Select the Symbols
FREE

This indicator draws strong price levels (price consolidation levels). The levels are plotted using 2 MA indicators and 1 MACD using a complex algorithm. The algorithm used in the EA is also in personal use.
These levels have 4 variants (colors of the variants can be customized): strong up, weak up, strong down, weak down. In turn, a weak level usually appears and then it can become strong. A strong level can also become weak. Version MT4: https://www.mql5.com/en/market/product/27997/ Versio
This expert advisor can enter and exit trades at specific times and on specific weekdays, expressed in GMT Time. It offers weekday selection, trade management settings, a martingale function and money management features. [ Installation Guide | Update Guide | Troubleshooting | FAQ | All Products ] Easy to use and supervise Fully configurable entry and exit times (up to 5 trades)
Enable or disable trading weekdays in inputs
Customizable break-even, stop-loss, take-profit and trailing-stop setti
FREE
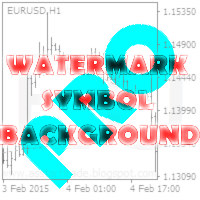
This utility displays the name of the current symbol and the current period in the chart background in a large font. It is very convenient, e.g. when you use multiple charts with different symbols, period or when saving a chart screenshot. The information is displayed in two lines. In the first line, the chart symbol and current timeframe are shown in a larger font (e.g. AUDUSD,h1 ). In the second line, the full name of the current symbol is displayed in a smaller font (e.g. for GPBJPY it shows

"LINKER" is an indicator that links any number of windows of the charts it is running on. A synchronized crosshair is also available, toggled by the (Ctrl) key or the (L) button. The visibility of the trade levels can be toggled on each chart separately using the (Shift) key or the (V) button. The buttons and the crosshair have customizable settings and colors. For instance, you need to analyze a trading instrument on different timeframes, for example, on H1, H4 and D1. Doing this in a single ch
MetaTrader 4 version is available here: MT4 Drawer . This tool allows you to draw on the chart using keyboard shortcuts. It also provides some custom drawing tools for your convenience. You can configure 3 variants for each tool (6 for advanced patterns), which you will be able to choose from dashboard. There is also, a possibility to define up to 30 quick access keys that skips the dashboard step and goes straight to drawing. Here are the list of supported tools: Advanced Pattern - draws two t

The script creates a brief daily summary report of the weekly trade in a separate window.
Input parameters of the script number of weeks - set the time interval (the number of weeks) for the report. switch for symbols selection - three modes for selecting the instruments to generate the report: All_Symbols - report is generated for deals of all instruments. Current_Symbols_Only - report is generated only for deals of the instrument in the current window. Without_Current_Symbols - report is gen

"All in One" panel. You can simultaneously control: up to 3 symbols; up to 6 periods; up to 31 popular signals. You can see the sum for all signals taking into account the weight of the signal Version for MetaTrader 4: https://www.mql5.com/ru/market/product/27880 Version for MetaTrader 5: https://www.mql5.com/ru/market/product/27830
Parameters NUM_BAR - number of the bar to analyze (set a value greater than 0 to work on closed bars). timeframe_1....timeframe_6 - working timeframes (if set to "
FREE

The Expert Advisor is used to create Renko chart, realtime updates, easy for technical analysis. Backtest your strategy with all indicators with Renko chart in MetaTrader 5.
Parameters Box Size : input the number of box size. Show Wicks : if true , draw a candle with high/low. History Start: input the date to creat first candle.
Maximum Bars: limit number of bars on renko chart
How to use Attach the Expert Advisor to a chart (timeframe M1), for which you want to create a renko. Input box siz
The VR Orders History script is designed to upload a trade report to a csv file. This format is intended for additional analysis of trading history in programs such as EXCEL, Openoffice, and Libreoffice. Thanks to the script, it is now much easier for a trader to analyze their trading history. The program facilitates the analysis of the trading history for the MetaTrader 5 terminal. The trader sees structured trading. The entire report is based on the following principle: Position > Order on the
FREE
This tool allows you to better analyze your chart. With "Crosshair Percent", you can calculate distances in the chart in a percentage way (in a very simple way, when the pointer is attached in the form of a crosshair: CRTL + F). The utility allows to measure and/or calculate the movements of the price NOT only in points, use a measure in professional terms as it is the percentage. The result is shown in two parts of the screen, one of them, next to the position of the pointer and the other in a

O FXTT Trendline EA para MT5 é um robô que o ajuda a gerir as suas posições de acordo com as linhas que voce desenha no seu gráfico. Basicamente ele permite que voce crie ordens pendentes utilizando linhas que não sejam horizontais . Por omissão, esta funcionalidade não é suportada pelo Metatrader 4. Fácil de configurar Basta escolher o Lot size , Stop Loss e Take Profit Permite abrir posições de acordo com varias situações: Touch, Pullback, Breakout e False Breakout da linha A uti

DAR Portfolio Modeller Expert Advisor forms an investment share portfolio. Its model is based on two key indicators of any financial instrument - profitability and risk that are both quantified. According to the model, the profitability is a mathematical expectation of profit, while risk is defined as a profitability distribution near the mathematical expectation and calculated using the standard deviation. Unlike other similar programs, you do not have to manually download history and insert it

Fibonacci decorator is a unique product that decorates Fibonacci objects. This indicator can change the specific level line of a Fibonacci object. This tool caters to both beginners and advanced traders using Fibonacci objects.
Advantages Supports three Fibonacci objects: Fibonacci Retracement Fibonacci expansion Fibonacci time zones Just add the mark of your choice to the description of a Fibonacci object's level Easy setting This indicator does not work well with Strategy Tester. Please down
O Mercado MetaTrader contém robôs de negociação e indicadores técnicos para traders, disponíveis diretamente no terminal.
O sistema de pagamento MQL5.community está disponível para todos os usuários registrados do site do MQL5.com para transações em todos os Serviços MetaTrader. Você pode depositar e sacar dinheiro usando WebMoney, PayPal ou um cartão de banco.
Você está perdendo oportunidades de negociação:
- Aplicativos de negociação gratuitos
- 8 000+ sinais para cópia
- Notícias econômicas para análise dos mercados financeiros
Registro
Login
Se você não tem uma conta, por favor registre-se
Para login e uso do site MQL5.com, você deve ativar o uso de cookies.
Ative esta opção no seu navegador, caso contrário você não poderá fazer login.