Conheça o Mercado MQL5 no YouTube, assista aos vídeos tutoriais
Como comprar um robô de negociação ou indicador?
Execute seu EA na
hospedagem virtual
hospedagem virtual
Teste indicadores/robôs de negociação antes de comprá-los
Quer ganhar dinheiro no Mercado?
Como apresentar um produto para o consumidor final?
Novos Indicadores Técnicos para MetaTrader 5 - 37

Este indicador forma um canal com base nas leituras do indicador ADX (índice de movimento direcional médio), exibe e informa o negociante sobre uma reversão de preço nos limites deste canal e também pode relatar quando o preço atinge os limites do canal. Ele também desenha linhas pontilhadas adicionais, que dependem das leituras + DI e -DI do indicador ADX. Também possui a opção de filtrar sinais em função das leituras estocásticas. O canal desenhado por este indicador acaba sendo um pouco como
FREE

If you have the opportunity to read the book " Trend Trading - A Seven-Step Approach to success " by Daryl Guppy, you will have a great deal of information about how to "read" the market. In his book Daryl show, among other things, how can we use a visual tool to measure the volatility and trend between Long and Short-term periods: The GMMA - Guppy Multiple Moving Averages .
Instead of using his original idea of having 12 Exponential Moving Averages in your chart - which could be very CPU-dem
FREE

A small utility displays the time in five time zones. You can customize the display of one to five time zones. For each time it is configured: show or not; name; time offset from GMT; color; In general settings, you can change: date / time format ("hh: mi", "hh: mi: ss", "yyyy.mm.dd hh: mi", "yyyy.mm.dd hh: mi: ss") font name; font size; offset from the left edge of the chart; offset from the top edge of the chart;
FREE

The Relative Strenght Index presented to the world in 1978 by J. Welles Wilder Jr. in his book " New Concepts in Technical Trading Systems " is widely used around the world in several ways, not only with the traditional approach of Overbought and Oversold states, which in several cases and depending on the assets and timeframes it just simply doesn't work anymore . BUT, this indicator has its value when used, for instance, looking for divergences between its measuring system and the Prices appea

COMPRE um dos nossos ROBÔS e RECEBA a VERSÃO PRO deste produto DE GRAÇA
Não deixe de testar nossa versão Profissional com recursos e alertas configuráveis: Agression Wave PRO
Este indicador soma a diferença entre a agressão de venda e agressão de compra ocorrida em cada Candle, plotando graficamente as ondas de acumulação dos volumes de agressão. Através destas ondas é calculada uma média exponencial que indica o sentido do fluxo de negócios
Nota: Ele
FREE

The indicator makes calculations based on data obtained from one of seven (7) moving averages and colors the chart.
Simple moving averages are those that have only one important calculation parameter - the period.
The shift in the indicator is not used.
There is a shift trick setting, it is used to smooth the result of calculations. You can see the changes if you reduce this parameter to 1 (minimum value).
shift trick must always be less than the period value.
Available averages:
MA
FREE

The indicator paints the candlesticks of the chart in colors calculated from the values of the strengths of the bulls and bears.
It works like this:
The values of the two indicators Bears and Bulls are taken, and who is stronger on the candlestick is compared. It's all.
.
FREE
Professional traders know that volume is the fuel for price movement. Large players try to hide their true intentions, but they can be recognized by volume bursts. The standard vertical volume does not show us specific price levels, but the cluster volume and especially its surges provide a very clear picture and specific price levels (areas).
The DBS Cluster Search indicator searches for clusters of the specified size in tick data and highlights them with colored figures on the chart. These

The indicator plots dynamic POC, VAH and VAL levels for a specified period from tick data. POC - Point Of Control, the price at which the maximum volume has accumulated over a certain period of time (POC in the volume profile). VA - Volume Area, the zone of the fair value of the asset. VAH - Volume Area High. VAL - Volume Area Low. The DBS_DynamicLevels indicator plots dynamic levels where the calculation point is the maximum volume level (POC) and zone VAH / VAL. The indicator shows the history

The Better Volume indictator improves the comprehension on volume by coloring the classical histogram bars . The colors point out differents nature of volume .
The Better Volume OnOff allows to open/close the subwindow through a botton or using the keyboard only. There is the possibility to customize 3 symbols and assign them different parameters for each time frame .
The indicator improves the comprehension on volume by coloring the classical histogram bars : CLIMAX UP -

We at Minions Labs always like to defy the stablished systems and beliefs trying new things and new ways of seeing and interpreting the Market Data. And all starts with the following question...
WHAT IF...
You give more relevance and focus on the Wicks/Shadows on the candlesticks? And Why? In volatile markets wicks play an important role on determining who is winning the the fight between Bulls and Bears , and more than that, Higher and lower wicks can present you with a good status of the cu
FREE

This easy to setup indicator shows you the market volumes in a different way, with support and resistance as showed. You can setup: - Backdays volume to show - Heiken Ashi candle view It works for every kind of graph and every kind of period. The program shows the volumes based on the number of candles displayed in the chart: the more candles the more volumes. Enjoy this very useful indicator.
Please feel free to message me to report any kind of improvements! :D

O Pivot Point Fibo RSJ é um indicador que traça as linhas de suporte e resistência do dia usando as proporções de Fibonacci. Este indicador espetacular cria até 7 níveis de suporte e resistência por meio do Pivot Point usando proporções de Fibonacci. É fantástico como os preços respeitam cada nível deste suporte e resistência, onde é possível perceber possíveis pontos de entrada / saída de uma operação.
Recursos
Até 7 níveis de suporte e 7 níveis de resistência Defina as cores dos níveis in
FREE

This indicator shows Fractal Breakout Trendlines and Support and Resistance
The Fractal Ascending Trendline and Fractal Descending Trendline are drawn from the last valid fractals. Breakouts can be taken above or below these trendlines. Horizontal lines are drawn from the Last upper and Last lower fractal to show support and resistance levels. Horizontal Upper and Lower Intersection lines are drawn where a fractal trendline has been last intersected, to show where to place a buy or sell orde
FREE

Boa tarde. Hoje apresentamos o novo indicador de PointIntoChannelTOMSON https://youtu.be/dmgtVwX3nvg
https://youtu.be/Wr7N2WEY8lA - este indicador é calculado a partir de um canal, o nível de desvio de preço na direção de compra e venda, verde e vermelho a janela de indicadores, respectivamente. Quanto maior o nível de desvio, maior a probabilidade de reversão. As leituras do indicador são recalculadas com cada nova barra e é recomendável usá-lo apenas como auxiliar
Contatos para comunica

Boa tarde. UturnAnalysis - para verificar a qualidade do indicador
Lançou uma versão de avaliação do envio gratuito de sinais de reversão com base neste indicador para o mercado de ações e mercado de ações MICEX
escreva agora, me 777basil@mail.ru ou nos comentários o seu endereço de e-mail e nós lhe enviaremos os dados da conta onde vêm os alertas, grátis.
https://youtu.be/q228LvLec-Y
colocamos várias ferramentas ao mesmo tempo https://youtu.be/Wr7N2WEY8lA economize seu tempo no Monitor
Zona Importante. O indicador Zona Importante é um indicador desenvolvido com todo meu conhecimento no mercado. o que voce podera esperar dele? o Indicador gerara alerta em toda e qualquer Reversao, seja uma reversao de fato ou um simples pullback ou seja a cada mudanca de direcao ocorrera um alerta. - Beneficios: - Nao deixara voce perder oportunidade.
O sell signal significa que uma nova onda de queda ocorrera. O buy signal significa que uma nova onda de alta ocorre

MT5 Version Dashboard: Free scanner to monitor All pairs and timeframes. Please contact me after purchase, i will send it to you! MT4 version indicator: https://www.mql5.com/en/market/product/59127 Tip: This is an indicator for real-time signal display. When the indicator is loaded and running on the chart, the past signal cannot be displayed Market structure changes as price reverses And filter with all import features built inside one tool. Breaker's smart algorithm detects the reverses,

The signal trend indicator Sliding Step . The appearance of a signal in the form of an arrow gives a recommendation to open a deal. The appearance of scissors warns of a changing in the situation and gives a recommendation on fixing profit (loss).
Settings:
Trend filter (period) - the filter restricts trade in transitional stages and U-turns. It is recommended that you actively work with the filter settings. The upper limit of the settings depends on the volatility of the instrument.
FREE

The Wave Splash technical indicator measures the deviation of the price of an instrument from the average values over a specified period of time. It forms divergence patterns with the price chart and generates leading signals that make it possible to timely detect signs of an upcoming correction in the price of an instrument or a reversal with a trend change even at the moment the price updates extreme values. The Wave Splash indicator is effective in an active market.
Settings:
S
FREE

Bar Countdown é um simples indicador para MetaTrader 5 que mostra o tempo restante de cada vela. Ele pode ser colocado em qualquer canto do gráfico ou perto do fechamento de preço. Escolha o formato do contador entre HR:MIN:SEC ou MIN:SEC
É muito fácil de usar, configure a cor, o tamanho e a posição no gráfico do contador e pronto!!! A contagem regressiva começa agora!
Atualizações:
28/02/2021; v1.0: Versão inicial 16/03/2021; v1.1: Pequenas alterações no código
FREE
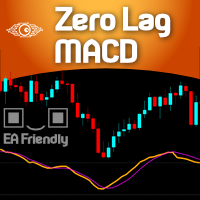
For those who are fans of the traditional MACD ( Moving Average Convergece/Divergence ) indicator, here it is a way faster indicator that could be very useful for intraday trading. Of course it could be used in higher timeframes, with the proper settings. Here at Minions Labs we always encourage traders to calibrate every single indicator you have to extract and distill every drop of good information it has for you. And this is the case with this speedy friend... This Zero Lag MACD could be used

As médias coiote automatizam a leitura de analise de médias rápidas e lentas no saldo do volume e preço. Quando as médias estão em modo compra, a coloração do candle fica azul.
Quando as médias estão em modo venda, a coloração do candle fica magenta. Quando a coloração fica verde ou vermelho, temos a tomada das médias no volume mas não no preço, quando isso ocorre é um sinal de atenção.
A concepção do indicador é ser utilizado para operações em saída de consolidações na direção da tendencia d

GIVE A LOOK TO MY OTHER PRODUCTS ! 100 % PER MONTH PROFIT---- MY NEW SIGNAL HERE -------> https://www.mql5.com/en/signals/2162238?source=Site+Signals+My#
The Parabolic SAR (PSAR) helps trader identifying direction of the stock movement and also provides them with the entry and exit. This indicator on the chart appears as a series of dots either above or below the price bars. When the Dots are below the price bar is then the price movement is considered to be bullish and when the Dots are a
The Moving Average Convergence Divergence Indicator (MACD) is both a trend–seeking and momentum indicator which uses several exponential moving averages set to closing prices to generate trading signals. This Version brought to you the Stochastic confluence filtering the signals, this set ups amazing entries on índices and stock futures trading.
We added many types of alerts plus the Delay Cross Filter to aid in your search for better opportunities in the market.
Product Features Sound aler

SHADOW vous donne des signaux d'achat et de vente solides avec un risque minimal. Vous pouvez voir dans quelle direction le prix évolue et la force du mouvement. Shadow filtre le bruit du marché et améliore radicalement les performances des traders.
Points forts: Détection visuelle efficace des tendances. Bruit du marché des filtres Ne repeint ni ne recalcule jamais. Signaux strictement sur "fermeture du bar". Fonctionne dans tous les symboles. Pop-up intégré, e-mail, notification push e
FREE
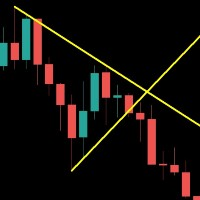
Save your time . Select area and the trend line will draw automatically . Draw a support and resistance line for the selected range with two mouse clicks . If you need to, you can also draw a line for support and resistance based on separate areas.
The resistance trend line is drawn based on the first and last highs inside the selected area; The support trend line is drawn based on first and last lows inside the selected area;

Candle Timer Countdown exibe o tempo restante antes que a barra atual feche e uma nova barra se forme. Ele pode ser usado para gerenciamento de tempo.
Versão MT4 aqui!
Recursos
Rastreia a hora do servidor, não a hora local Cor de texto e tamanho da fonte configuráveis Visualização opcional da variação diária do símbolo Otimizado para reduzir o uso da CPU
Parâmetros de entrada
Mostrar variação diária: verdadeiro / falso Tamanho da fonte do texto Cor do texto Se você ainda tiver dúvidas
FREE

O Setup Tabajara foi criado por um trader brasileiro conhecido como "O OGRO de Wall Street" .
A ideia deste setup é indicar ao trader a tendência atual dos preços e o tipo de operação deve-se buscar no gráfico. Funcionamento
Ele faz isto através da relação de posicionamento do fechamento dos candles e o sentido da vwap até 10:40 e após a média aritmética de 20 períodos pintando os candles de 4 possíveis cores: Verde -> Preço subindo em Tendência de alta (Buscar pontos d
FREE

Candle Counter é um indicador que imprime o número dos candles desde o primeiro candle do dia. O primeiro candle do dia será o número 1 e cada novo candle será aumentado em 1 nesta contagem.
Parâmetros de entrada Escolha entre par, ímpar ou todos Distância do Candle para imprimir o número Tamanho da fonte do texto Cor da fonte do texto Se você ainda tiver dúvidas, entre em contato comigo por mensagem direta: https://www.mql5.com/pt/users/robsjunqueira/
FREE

A distribuição de Cauchy é um exemplo clássico de distribuição de cauda gorda. Caudas grossas indicam que a probabilidade de uma variável aleatória se desviar da tendência central é muito alta. Portanto, para uma distribuição normal, o desvio de uma variável aleatória de sua expectativa matemática em 3 ou mais desvios padrão é extremamente raro (a regra dos 3 sigma), e para a distribuição de Cauchy, os desvios do centro podem ser arbitrariamente grandes. Esta propriedade pode ser usada para sim
MT4 Version Available Here: https://www.mql5.com/en/market/product/43528
Telegram Channel & Group : https://t.me/bluedigitsfx
V.I.P Group Access: Send Payment Proof of any of our Paid Products to our Inbox
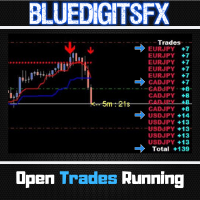
Recommended Broker: https://eb4.app/BDFXOsprey * The Most Sought After Pip Counter for Metatrader ! Features
Will show Currency Symbol in BLUE for Buy positions. Will show Currency Symbol in RED for Sell positions. Will Show pips in BLUE Color for Positive Pips Will Show pips in
FREE

O indicador Weis Waves RSJ soma os volumes de cada onda. É assim que recebemos um gráfico de barras de volumes cumulativos de ondas alternadas. Ou seja, o volume cumulativo torna os gráficos de ondas Weis únicos.
Isto lhe permite comparar a relação das características da sequência de ondas, como correspondência da força aplicada (expressa no volume) e resultado recebido (evolução do preço).
FREE

TrendMeasurer indicator manual / TMi manual The indicator is designed to help the user to find the end point of a strong trending price movement. Important - END. Not start. How the indicator works The first price impulse and its subsequent pullback form a certain "critical mass" which acts as "fuel" for further price movement. The production of this fuel indicates the potential end of the trend. Both volume and indicator calculated in a certain way from price data can be the fuel. The amount of

VWAP Fibo Bands RSJ é um indicador que traça a linhas do VWAP diário e a partir dela cria bandas utilizando proporções de Fibonacci.
Este espetacular indicador cria 10 níveis de bandas através da VWAP diária utilizando proporções de Fibonacci. É fantástico com os preços respeitam cada nível das bandas, aonde é possível perceber que quase toda vez que o preço fecha acima/abaixo de um nível das bandas ele irá buscar o próximo. Se fecha acima irá buscar atingir o nível acima e se fecha abaixo
FREE

O Setup Tabajara foi criado por , trader brasileiro conhecido como "O OGRO de Wall Street" .
A ideia deste setup é indicar ao trader a tendência atual dos preços e o tipo de operação deve-se buscar no gráfico.
Ele faz isto através da relação de posicionamento do fechamento dos candles e o sentido da média aritmética de 20 períodos pintando os candles de 4 possíveis cores:
Verde -> Preço subindo em Tendência de alta (Buscar pontos de entrada de COMPRA)
Preto -> Pr
FREE

VWAP RSJ é um indicador que representa as linhas horárias, diárias, semanais e mensais do VWAP.
Grandes compradores institucionais e fundos mútuos usam o índice VWAP para ajudar a entrar ou sair de ações com o menor impacto possível no mercado.
Portanto, quando possível, as instituições tentarão comprar abaixo do VWAP ou vender acima dele.
Dessa forma, suas ações empurram o preço de volta para a média, em vez de afastá-lo dela.
Com base nessas informações, desenvolvi este indicador que
FREE

Este simples indicador pinta de uma cor mais escura a barra do quando a quantidade negociada no candle fica acima a média selecionada de períodos do próprio , apresentando desta forma os momentos aonde houve um grande de negociações acima da média. É possível também utilizar uma configuração de 4 cores aonde a tonalidade da cor demonstra a força do volume do candle. O padrão do indicador é a média simples de 20 períodos, mas é possível alterar para outros tipos de médias e pe
FREE

COMPRE um dos nossos ROBÔS e RECEBA a VERSÃO PRO deste produto DE GRAÇA
Não deixe de testar nossa versão Profissional com recursos e alertas configuráveis: Delta Agression Volume PRO Este indicador calcula a diferença entre a agressão de venda e agressão de compra ocorrida em cada Candle, plotando graficamente o saldo de cada um deles.
Nota: Ele só funciona com corretoras e/ou mercados que informam o tipo de agressão de cada negociação, ou seja, informando s
FREE

The delta indicator is used to display the difference between the volume that passed on the exchange at the Ask price and above (market buys) and the volume that passed at the Bid price and below (market sales). This indicator shows the delta of each candle on the timeframe of your choice. The data is displayed as a colored histogram in a separate indicator window. The indicator is calculated from the tick history, therefore, to speed up the calculations and reduce the load on the system, the n

The indicator draws a normal chart by coloring it in colors based on prices calculated by the Heiken Ashi indicator algorithm.
That is, the shape of the candles does not change.
In fact, this is the same Heiken Ashi that does not distort the price chart.
Then there will be a drawing of a cat, because there is nothing more to write about the indicator. .
FREE

ProFactor is an indicator generating signals based price on the famous profit factor formula. The calculation is simply defined as gross GREEN BARS divided by gross RED BARS.
That's it in a nutshell, but sometimes the simplest things hold the most value.
So let's imagine your trading system's gross profit for the past year was $40,000 and your gross losses were $20,000. Your Profit Factor would be 2. The ProFactor calculation works on the price of the asset instead of the strategy out
FREE

An effective indicator that highlights candles with increasing volumes, overshadowing those with shrinking volumes. Also suitable for Forex because it uses tick_volume.
You can set the colors to your liking. It will be easier to spot trends and possible reversals. The increasing volumes indicate the presence of large investors and therefore determine the reliability of the candle under observation

This indicator watch the Fibonacci retracement for levels and timeframes selected by the trader. In the workload of day trading, having your eyes on all the timeframes to validate some information, for Fibonacci traders, is really time consuming and requires constant focus. With this in mind, this tool allows you to have your attention on other trading details while this one monitors the retracements of each timeframe in real time. In the charts, this indicator data (retracement %, age of the r
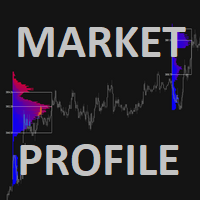
Concept of Market Profile was created at Chicago Board of Trade (CBOT) by trader Peter Steidlmayer and first published during the 1980s as CBOT product. Market profile by itself is not a stand-alone strategy, but a different way how you can view the market and make better trading decisions.
They have seen a market as an auction process which is affected by supply and demand the same way as every other auction, for example, development of prices of food, gas etc.
The price goes up as long th
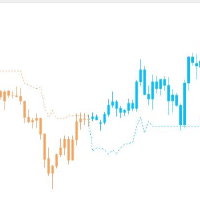
Stable trend index without clutter The index optimizes the moving average and removes the unstable clutter It can also be used in any other commodity It is best used in mainstream currencies such as EURUSD, USDJPY, GBPUSD and AUDUSD
The time period is 1 hour
I only know a little English, please forgive me if you don't understand I will always improve this indicator

Description
Bitcoin Manager is the best indicator for trading Bitcoin cryptocurrency. It is calculated based on the price deviation from the moving average line channel. Ascending and descending arrows indicate potential points and levels for opening buy and sell positions.
How to use?
We strongly recommend using this indicator on the H1 timeframe. An up arrow indicates a buy level. Down Arrow - Sell Level.
Parameters
Maximum History Bars - maximum count of history bars to calculate

Elliot Waves Analyzer calculates Elliot Waves to Help Identify Trend direction and Entry Levels. Mainly for Swing Trading Strategies. Usually one would open a Position in trend direction for Wave 3 or a Correction for Wave C . This Indicator draws Target Levels for the current and next wave. Most important Rules for Elliot Wave Analysis are verified by the Indicator. This free version is limited for Analyzing one Timperiod Waves. Waves are Shown only in PERIOD_H4 and above. Not Useful for Intr
FREE

The indicator highlights in color the places on the chart where the price moves in one direction continuously from the selected number of candles.
You can specify the number of points from the beginning of the movement to select only movements from this amount.
It can be useful for looking for reversals or sharp impulses.
I also recommend purchasing this utility to determine local weekly / monthly trends and support and resistance lines. https://www.mql5.com/en/market/product/61401
FREE

If You Are Discretionary Trader This Tool Is A Must Chart Switcher ------> Linking Multi-Time Frame Charts / Syncing Indicators And Drawings. Main USP Of This Indicator: Is Opening Multi-Time Frame Multiple Charts {Up To 10 Charts} Of A Symbol With Just 1 Click. You Do not Have To Save Any Template As It has Been Save Auto When You Click Same Symbol Or Move To Another Symbol. It Is Divided Into 2 Parts: 1} COMMON MODE and 2} SYMBOL MODE 1} COMMON MODE: Under This Mode, You Can Sync Commo
For those who are fans of Bill William's strategy, here it is the Trade Zone indicator filled with alerts and a better coloring system and EA ready (BUY & SELL buffers). And for those who don't know Bill Williams work, search Amazon for the title " Trading Chaos: Maximize Profits with Proven Technical Techniques ". This indicator internally uses the widely known Awesome Oscillator along with the Accelerator indicator, and when both are aligned it lights up the candles signaling a probable strong

Upgraded - Stars added to indentify Areas you can scale in to compound on your entry when buying or selling version 2.4 Upgraded Notifications and alerts added version 2.3 *The indicator is suitable for all pairs fromm Deriv pairs (Vix,jump,boom & crash indices) , Currencies, cryptos , stocks(USA100, USA30 ), and metals like gold etc. How does it work?
Increasing the period make it more stable hence will only focus on important entry points However lowering the period will mean the indica

Profit Loss Meter For the serious trader this fun easy to use indicator allows you to measure Profit and Loss of current, closed or future trades on your forex account chart. It measures Currency Pairs And Indices plus estimates margin levels at the trade close point. The Profit/Loss indicator is based on MT5 native Crosshair instrument. TO ACTIVATED USE "HOT KEYS" ctrl+f just as you would for activating the Crosshair. left click and hold then drag in the direction in which you would like to m

Добрый день. Сегодня добавили вспомогательный индикатор тренда DveMashkiTompson, идея взята из аналога МТ4 и перенесена на МТ5, используется совместно с индикаторами Тренда ТМА и МА, рисует красные и зеленые области в зависимости от направления рынка. Тренд вверх -зеленые области, тренд вниз -красные.Области основываются на пересечении индикатора МА, таким образом данный индикатор дает информацию графического содержания для более быстрой оценки ситуации и принятия решения.
FREE
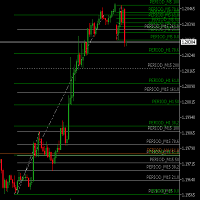
Sets and Updates Fibo-Retracemnet-Levels for Multi Timeframes. Helps to Find TradeZones combined over Multi-Timeframes. M1 M5 M15 H1 H4 D1 are analyzed and shown. Color Changes as soon 161 and 261 Retracements are reached to visualize possible Targets/ TakeProfit Zones . No Settings for Indicator available . Fibonacci retracements are set using a fixed Logic.
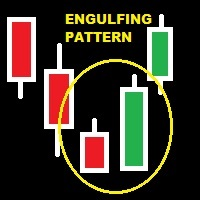
GIVE A LOOK TO MY OTHER PRODUCTS ! There are patterns that are more affidable then others.One of the most important is the engulfing pattern .It is very helpful to understand if there is a change of trend. This indicator find for you affidable engulfing patterns and send you an alert when a pattern is completely formed . To make this alert indicator more reliable,there is a parameter that you can change relative to the engulfing bar ( so the lost one closed before signal ). In fact you can cho

GIVE A LOOK TO MY OTHER PRODUCTS !
100 % PER MONTH PROFIT---- MY NEW SIGNAL HERE -------> https://www.mql5.com/en/signals/2162238?source=Site+Signals+My# Morning and evening star are 2 famous and reliable candlestick patterns, very helpful to understand an imminent change of trend. This indicator finds for you this patterns on your chart and send you an alert just when a pattern is 100 % formed. To make this indicator more reliable,y

This indicator provides an original mix of WPR, VSA, and volume delta. It shows ratio of buy/sell volumes scaled on 100% range based on total volume change for a selected period. The convetional VSA (Volume Spread Analysis) studies interconnections of price action and volume change in absolute values, whereas WPR (Williams Percent Range) offers a convenient approach of price moves normalization into the fixed percentage metric: 0 - 100%. Hence overbough and oversold states are easily spotted. N

Here I present you this awesome indicator I made. This is a nique combination witch puts you in the same level as MM's. So you can surf a lot of waves and identify the rally time, breakouts, and the perfect time to get in the market. ----
The SSL Channel is a great all-rounder based on 2 Simple Moving Averages, one of recent Highs, one of recent Lows. The calculation prints a channel on the chart consisting of 2 lines. This strategy gives a Long signal when price closes above the top of the

Hi-Lo é um indicador cuja finalidade é auxiliar de maneira mais precisa as tendências de um determinado ativo — indicando assim, o possível melhor momento para compra ou venda. O que é o Hi-lo? Hi-Lo é um termo derivado do inglês, onde Hi está ligado à palavra High (Alto) e Lo à palavra Low (baixo). Ele é um indicador de tendência usado para avaliação da negociação de ativos no mercado financeiro. Sendo assim, a sua utilização é dada para identificar se um determinado ativo está apresentando u
FREE

O indicador mede o saldo de agressão acumulado. A fórmula é a seguinte: Acumulado = Acumulado do Candle Anterior + Volume de Compra - Volume de Venda.
Conheça Nossos Produtos
***** Gostou do produto? Então, nos ajude fazendo sua avaliação na aba " Comentário ". *****
Nota: Recomenda-se utilizar os valores padrões de configuração e VPS. É necessário as informações de negociações(Time nd Sales).
O indicador envia para o seu email ou celular informação quando o saldo acumulado invert

O indicador plota no gráfico o volume de compra e de venda.
São gerados duas linhas correspondendo as médias dos volumes de compra e venda.
Suporte e dúvidas dos produtos no link Abaixo: Suporte
O Cruzamento das médias, o aumento do distanciamento das mesmas são bons indicativos de movimento do mercado. Conheça Nossos Produtos
Nota: Recomenda-se utilizar os valores padrões de configuração e VPS. É necessário as informações de negociações (Time and Sales).
Parâmetros : Agressão Nú

This indicator provides you with MACD formula applied to volume-aware Accumulation/Distribution and OnBalance Volumes indicators. In addition to tick volumes it supports special pseudo-real volumes, synthesized for Forex symbols where real volumes are unknown. More details on the volume surrogates may be found in description of another indicators - TrueVolumeSurrogate and OnBalanceVolumeSurrogate (algorithm of the latter is used internally in MACDAD for AD and OBV calculation before they procee

O indicador mede o saldo de agressão para cada Candle. A fórmula é a seguinte:
Agressão = Volume de Compra - Volume de Venda.
Nota: Recomenda-se utilizar os valores padrões de configuração e VPS. Não funciona em Forex.
Conheça Nossos Produtos
Parâmetros : Números de dias anteriores ao atual para cálculo; Divisor do Volume e; Habilita cálculo do candle atual; Histograma Estilo da linha e; Tamanho; Linha Estilo da linha e; Tamanho;
Acompanhe-nos no nosso sites e envie sua dúvida n

Investment Castle Support and Resistance Indicator has the following features: 1. Dictates the direction of Buy or Sell trades based on Support and Resistance Levels automatically . 2. Candles stick colors will change to Red for Sell and Blue for Buy (Default settings, user can change from the inputs). 3. This indicator is built-in the Support & Resistance based Investment Castle EA which works with Psychological Key Levels "Support & Resistance".
FREE

This is a bufferless indicator which can display classical X and O columns if applied on custom symbol charts built by Point-And-Figure-like generator PointFigureKagiCharts or its DEMO . The indicator will enforce a fixed price-scale on the chart to make sure the marks keep correct aspect ratio. The marks are shown only if the chart time-scale is large enough to hold them in the space allocated per bar (if the horizontal scale is one of 3 smallest ones, the indicator draws nothing and outputs a
FREE

GIVE A LOOK TO MY OTHER PRODUCTS ! 100 % PER MONTH PROFIT---- MY NEW SIGNAL HERE -------> https://www.mql5.com/en/signals/2162238?source=Site+Signals+My# Double MA Cross Alert,is a cool indicator that notificate you directly on your telephone or email when 2 Moving average ( you choose the parameters ) crosses. This is very important when you want to know a change of trend and you can't stay in front of your pc! The indicator give you the alert just when the next bar opens ,so give you a more

Automatic Fibonacci Tool Fibonacci retracements is a popular instrument used by technical analysts to determine potential Support and Resistance areas. In technical analysis, this tool is created by taking two extreme points (usually a peak and a minimum) on the chart and dividing the vertical distance by the key Fibonacci coefficients equal to 23.6%, 38.2%, 50%, 61.8%, and 100%. Our Automatic Fibonacci Tool is programmed to make thigs easier. Using this tool, there is no need to explicitly set

根据高开低收价格确定反转点位,画出的极点折线。 The pole polyline is drawn according to the high opening and low closing price to determine the reversal point.
参数(Args):
1.周期数(Period)。参与界限计算的K柱数量。 2.界限(Divide)。计算方式包括: t1,顺高低价 (Buy min H,Sell max L) t2,逆高低价 (Buy min L,Sell max H) t3,收盘价 (Buy min C,Sell max C) t4,开盘价 (Buy min O,Sell max O) t5,高开低收价的一半 (HOLC/2) t6,高开低收价的一半+1 (HOLC/2+1) t7,高开低收价的一半+2 (HOLC/2+2) 3.跨越界限使用的价格(Price)。包括收盘价(C)和高低价(HL) 4.偏移(

This indicator calculates Correlation among currency pairs (Selected by user) to find the least and/or most correlated symbols in real time. Correlation ranges from -100% to +100%, where -100% represents currencies moving in opposite directions (negative correlation) and +100% represents currencies moving in the same direction.
Note The Correlation more than 80 (Adjustable) between two currency pairs, Shows that they are quite similar in the kind of movement and side. The Correlation less than
Você sabe por que o mercado MetaTrader é o melhor lugar para vender as estratégias de negociação e indicadores técnicos? Não há necessidade de propaganda ou software de proteção, muito menos problemas de pagamentos. Tudo é providenciado no mercado MetaTrader.
Você está perdendo oportunidades de negociação:
- Aplicativos de negociação gratuitos
- 8 000+ sinais para cópia
- Notícias econômicas para análise dos mercados financeiros
Registro
Login
Se você não tem uma conta, por favor registre-se
Para login e uso do site MQL5.com, você deve ativar o uso de cookies.
Ative esta opção no seu navegador, caso contrário você não poderá fazer login.