适用于MetaTrader 5的新技术指标 - 37

This indicator forms a channel based on the readings of the ADX (Average Directional Movement Index) indicator, displays and informs the trader of a price reversal at the boundaries of this channel, and can also report when the price touches the channel boundaries. It also draws additional dotted lines, which depend on the readings of the + DI and -DI of the ADX indicator. It also has an option for filtering signals depending on the readings of the stochastic. The channel drawn by this indicato
FREE

If you have the opportunity to read the book " Trend Trading - A Seven-Step Approach to success " by Daryl Guppy, you will have a great deal of information about how to "read" the market. In his book Daryl show, among other things, how can we use a visual tool to measure the volatility and trend between Long and Short-term periods: The GMMA - Guppy Multiple Moving Averages .
Instead of using his original idea of having 12 Exponential Moving Averages in your chart - which could be very CPU-dem
FREE

A small utility displays the time in five time zones. You can customize the display of one to five time zones. For each time it is configured: show or not; name; time offset from GMT; color; In general settings, you can change: date / time format ("hh: mi", "hh: mi: ss", "yyyy.mm.dd hh: mi", "yyyy.mm.dd hh: mi: ss") font name; font size; offset from the left edge of the chart; offset from the top edge of the chart;
FREE

The Relative Strenght Index presented to the world in 1978 by J. Welles Wilder Jr. in his book " New Concepts in Technical Trading Systems " is widely used around the world in several ways, not only with the traditional approach of Overbought and Oversold states, which in several cases and depending on the assets and timeframes it just simply doesn't work anymore . BUT, this indicator has its value when used, for instance, looking for divergences between its measuring system and the Prices appea

This indicator sums up the difference between the sells aggression and the buys aggression that occurred in each Candle, graphically plotting the waves of accumulation of the aggression volumes. Through these waves an exponential average is calculated that indicates the direction of the business flow.
Note: This indicator DOES NOT WORK for Brokers and/or Markets WITHOUT the type of aggression (BUY or SELL). Be sure to try our Professional version with configurable features and alerts: Agr
FREE

The indicator makes calculations based on data obtained from one of seven (7) moving averages and colors the chart.
Simple moving averages are those that have only one important calculation parameter - the period.
The shift in the indicator is not used.
There is a shift trick setting, it is used to smooth the result of calculations. You can see the changes if you reduce this parameter to 1 (minimum value).
shift trick must always be less than the period value.
Available averages:
MA
FREE

The indicator paints the candlesticks of the chart in colors calculated from the values of the strengths of the bulls and bears.
It works like this:
The values of the two indicators Bears and Bulls are taken, and who is stronger on the candlestick is compared. It's all.
.
FREE
Professional traders know that volume is the fuel for price movement. Large players try to hide their true intentions, but they can be recognized by volume bursts. The standard vertical volume does not show us specific price levels, but the cluster volume and especially its surges provide a very clear picture and specific price levels (areas).
The DBS Cluster Search indicator searches for clusters of the specified size in tick data and highlights them with colored figures on the chart. These

The indicator plots dynamic POC, VAH and VAL levels for a specified period from tick data. POC - Point Of Control, the price at which the maximum volume has accumulated over a certain period of time (POC in the volume profile). VA - Volume Area, the zone of the fair value of the asset. VAH - Volume Area High. VAL - Volume Area Low. The DBS_DynamicLevels indicator plots dynamic levels where the calculation point is the maximum volume level (POC) and zone VAH / VAL. The indicator shows the history

The Better Volume indictator improves the comprehension on volume by coloring the classical histogram bars . The colors point out differents nature of volume .
The Better Volume OnOff allows to open/close the subwindow through a botton or using the keyboard only. There is the possibility to customize 3 symbols and assign them different parameters for each time frame .
The indicator improves the comprehension on volume by coloring the classical histogram bars : CLIMAX UP -

We at Minions Labs always like to defy the stablished systems and beliefs trying new things and new ways of seeing and interpreting the Market Data. And all starts with the following question...
WHAT IF...
You give more relevance and focus on the Wicks/Shadows on the candlesticks? And Why? In volatile markets wicks play an important role on determining who is winning the the fight between Bulls and Bears , and more than that, Higher and lower wicks can present you with a good status of the cu
FREE

This easy to setup indicator shows you the market volumes in a different way, with support and resistance as showed. You can setup: - Backdays volume to show - Heiken Ashi candle view It works for every kind of graph and every kind of period. The program shows the volumes based on the number of candles displayed in the chart: the more candles the more volumes. Enjoy this very useful indicator.
Please feel free to message me to report any kind of improvements! :D

枢轴点斐波那契 RSJ 是一个指标,它使用斐波那契汇率追踪当天的支撑线和阻力线。
这个壮观的指标使用斐波那契汇率通过枢轴点创建多达 7 个支撑位和阻力位。 价格如何尊重该支撑和阻力的每个水平真是太棒了,在那里可以感知操作的可能进入/退出点。
特征 多达 7 个支撑位和 7 个阻力位 单独设置级别的颜色
输入 枢轴类型 Pivot Fibo RSJ1 = Fibo ratio 1 计算 Pivot Fibo RSJ2 = Fibo ratio 2 计算 Pivot Fibo RSJ3 = Fibo ratio 3 计算 Pivot Fibo Classic = 经典枢轴计算 最低枢轴级别 旋转 3 个级别 旋转 4 个级别 旋转 5 个级别 枢轴 6 个级别 旋转 7 个级别
如果您仍有疑问,请通过直接消息与我联系: https://www.mql5.com/zh/users/robsjunqueira/
FREE

This indicator shows Fractal Breakout Trendlines and Support and Resistance
The Fractal Ascending Trendline and Fractal Descending Trendline are drawn from the last valid fractals. Breakouts can be taken above or below these trendlines. Horizontal lines are drawn from the Last upper and Last lower fractal to show support and resistance levels. Horizontal Upper and Lower Intersection lines are drawn where a fractal trendline has been last intersected, to show where to place a buy or sell orde
FREE

下午好。. 今天,我们提出了一个新的指标PointIntoChannelTOMSON https://youtu.be/dmgtVwX3nvg
https://youtu.be/Wr7N2WEY8lA -这个指标是从通道计算的价格偏差水平在买入和卖出的方向,指标的绿色和红色窗口,分别。 偏差水平越高,反转的概率越大。 指标读数会随着每个新柱重新计算,建议仅将其用作辅助柱
联系沟通777basil@mail.ru ,我们将准备一个专家,为您的任务的指标。
//输入参数: indPeriod = 20; // Период усреднения для вычисления индикатор indShift = 0; // Отклонение от основной линии indDeviation = 2; // Кол-во стандартных отклонений i

下午好。. UturnAnalysis - 检查指标的质量
我们已经推出了一个试用版免费分布的信号关于逆转的基础上,这个指标的期货和股票市场的MICEX
写信给技术支持,我777basil@mail.ru ,或在评论中您的电子邮件地址,我们将向您发送警报发送的帐户详细信息,免费。 https://youtu.be/q228LvLec-Y
我们一次把它放在几个工具上 https://youtu.be/Wr7N2WEY8lA 将节省您的时间在显示器,信号之间,你可以做一些有用的东西,
反转区域指标被设计为一个固定时间的符号状态的复杂分析器。
今天我们介绍斗鱼版本,如果您提前知道反转水平,它非常适合平仓和超频存款策略,
然后,您可以采取行动并固定利润,将止损移动到盈亏平衡区,或扩大您的交易,如有必要增加额外的交易量。
为了全面运行分析仪,您需要下载我们以前发布的免费指标 https://www.mql5.com/ru/users/777basil/seller 谢谢
安装后该指示器不会出现在屏幕上,但需要对电子邮件通知进行其他设置。
(配置终
Zona Importante. O indicador Zona Importante é um indicador desenvolvido com todo meu conhecimento no mercado. o que voce podera esperar dele? o Indicador gerara alerta em toda e qualquer Reversao, seja uma reversao de fato ou um simples pullback ou seja a cada mudanca de direcao ocorrera um alerta. - Beneficios: - Nao deixara voce perder oportunidade.
O sell signal significa que uma nova onda de queda ocorrera. O buy signal significa que uma nova onda de alta ocorre

MT5 Version Dashboard: Free scanner to monitor All pairs and timeframes. Please contact me after purchase, i will send it to you! MT4 version indicator: https://www.mql5.com/en/market/product/59127 Tip: This is an indicator for real-time signal display. When the indicator is loaded and running on the chart, the past signal cannot be displayed Market structure changes as price reverses And filter with all import features built inside one tool. Breaker's smart algorithm detects the reverses,

The signal trend indicator Sliding Step . The appearance of a signal in the form of an arrow gives a recommendation to open a deal. The appearance of scissors warns of a changing in the situation and gives a recommendation on fixing profit (loss).
Settings:
Trend filter (period) - the filter restricts trade in transitional stages and U-turns. It is recommended that you actively work with the filter settings. The upper limit of the settings depends on the volatility of the instrument.
FREE

The Wave Splash technical indicator measures the deviation of the price of an instrument from the average values over a specified period of time. It forms divergence patterns with the price chart and generates leading signals that make it possible to timely detect signs of an upcoming correction in the price of an instrument or a reversal with a trend change even at the moment the price updates extreme values. The Wave Splash indicator is effective in an active market.
Settings:
S
FREE

Bar Countdown is a simple indicator for MetaTrader 5 that shows the time remaining of the each candle. It can be placed in any corner of the chart or near of the price close and it'll help you to know
if the current candle is ending. Choose the counter format between HR:MIN:SEC and MIN:SEC It is so easy to use, configure the color, size and counter position on the chart and that's it!!! The Countdown starts now!
Updates: 2021/02/28; v1.0: Initial release 2021/03/16; v1.1: Minor code changes
FREE
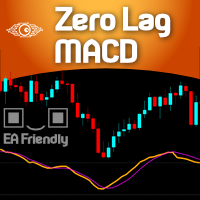
For those who are fans of the traditional MACD ( Moving Average Convergece/Divergence ) indicator, here it is a way faster indicator that could be very useful for intraday trading. Of course it could be used in higher timeframes, with the proper settings. Here at Minions Labs we always encourage traders to calibrate every single indicator you have to extract and distill every drop of good information it has for you. And this is the case with this speedy friend... This Zero Lag MACD could be used

As médias coiote automatizam a leitura de analise de médias rápidas e lentas no saldo do volume e preço. Quando as médias estão em modo compra, a coloração do candle fica azul.
Quando as médias estão em modo venda, a coloração do candle fica magenta. Quando a coloração fica verde ou vermelho, temos a tomada das médias no volume mas não no preço, quando isso ocorre é um sinal de atenção.
A concepção do indicador é ser utilizado para operações em saída de consolidações na direção da tendencia d

GIVE A LOOK TO MY OTHER PRODUCTS ! 100 % PER MONTH PROFIT---- MY NEW SIGNAL HERE -------> https://www.mql5.com/en/signals/2162238?source=Site+Signals+My#
The Parabolic SAR (PSAR) helps trader identifying direction of the stock movement and also provides them with the entry and exit. This indicator on the chart appears as a series of dots either above or below the price bars. When the Dots are below the price bar is then the price movement is considered to be bullish and when the Dots are a
The Moving Average Convergence Divergence Indicator (MACD) is both a trend–seeking and momentum indicator which uses several exponential moving averages set to closing prices to generate trading signals. This Version brought to you the Stochastic confluence filtering the signals, this set ups amazing entries on índices and stock futures trading.
We added many types of alerts plus the Delay Cross Filter to aid in your search for better opportunities in the market.
Product Features Sound aler

SHADOW vous donne des signaux d'achat et de vente solides avec un risque minimal. Vous pouvez voir dans quelle direction le prix évolue et la force du mouvement. Shadow filtre le bruit du marché et améliore radicalement les performances des traders.
Points forts: Détection visuelle efficace des tendances. Bruit du marché des filtres Ne repeint ni ne recalcule jamais. Signaux strictement sur "fermeture du bar". Fonctionne dans tous les symboles. Pop-up intégré, e-mail, notification push e
FREE
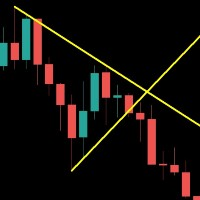
Save your time . Select area and the trend line will draw automatically . Draw a support and resistance line for the selected range with two mouse clicks . If you need to, you can also draw a line for support and resistance based on separate areas.
The resistance trend line is drawn based on the first and last highs inside the selected area; The support trend line is drawn based on first and last lows inside the selected area;

Candle Timer Countdown 显示当前柱线关闭并形成新柱线之前的剩余时间。 它可以用于时间管理。
MT4版本在这里!
功能亮点 跟踪服务器时间而不是本地时间 可配置的文本颜色和字体大小 符号每日变化的可选可视化 优化以减少 CPU 使用率
输入参数
显示每日变化:真/假 文本字体大小 文字颜色
如果您仍有疑问,请通过直接消息与我联系: https://www.mql5.com/zh/users/robsjunqueira/
如果可能,请留下您的评论和评论,以帮助向社区传播信息。 还可以了解我们的其他指标和专家顾问。 我有几种有用的指标和专家顾问。 如果您有任何建议,请随时提出建议,这样我才能改进产品,使持续改进永无止境。
FREE

Setup Tabajara 是由一位被称为“华尔街的 OGRO”的巴西交易员创建的。
这种设置的想法是向交易者表明当前的价格趋势和应该在图表中寻找的操作类型。
手术 它通过将蜡烛的收盘价和 VWAP 定位到上午 10:40 和之后的 20 个周期的算术平均值来实现这一点,以 4 种可能的颜色绘制蜡烛: 绿色 -> 价格呈上升趋势(搜索购买入口点) 黑色 -> 看涨趋势中的价格修正(搜索购买切入点) 红色 -> 价格在下降趋势中下降(搜索销售切入点) 白色 -> 在下降趋势中修正价格(搜索销售切入点) 另外,我还在脚本中放入了以下指标: 8 个时期的指数平均值:识别短期价格变动 50 个周期的算术平均值:确定中期价格变动 80 个时期的指数平均值:确定中期价格变动 200 个周期的算术平均值:确定长期价格变动
如果您仍有疑问,请通过直接消息与我联系: https://www.mql5.com/zh/users/robsjunqueira/
FREE

蜡烛计数器是一个指标,用于打印当天第一根蜡烛的蜡烛数量。 当天的第一根蜡烛将是数字 1,在此计数中,每根新蜡烛都会增加 1。
输入参数 从偶数、奇数或全部中选择 从蜡烛到打印数字的距离 文本字体大小 文字字体颜色
如果您仍有疑问,请通过直接消息与我联系: https://www.mql5.com/zh/users/robsjunqueira/ ----------------------------------------- 如果可能,请留下您的评论和评论,以帮助向社区传播信息。 还可以了解我们的其他指标和专家顾问。 我有几种有用的指标和专家顾问。 如果您有任何建议,请随时提出建议,这样我才能改进产品,使持续改进永无止境。
FREE

柯西分布是胖尾分布的经典示例。粗尾表明随机变量偏离中心趋势的可能性非常高。因此,对于正态分布,随机变量与其数学期望之间的偏差为3个或更多标准偏差是非常少见的(3 sigma规则),对于柯西分布,与中心的偏差可以任意大。此属性可用于模拟市场中的价格变化。因此,柯西分布可以过滤出由意外和/或不可预测的因素引起的大而急剧的价格变动。 该指标使您可以选择要使用的价格。使用以下参数配置其指示器操作: iPeriod-计算的柱线数 Lvl 1-3-百分比水平偏差,允许值大于0且小于100(默认为50%,20%和10%) Shift级继续向右 该指标在交易中的使用是基于这样的假设,即价格在超过最高或最低水平后很可能会返回平均值。也就是说,如果价格超过10%的较低水平,则应该开仓买入交易;如果价格超过10%的较高水平,则应该开仓卖出交易(图1)。 同样,使用此指标,您可以判断趋势的阶段。为此,您需要评估指标的过去读数所处的水平(图2)。 特别是,可以确定趋势变化的时刻(图3-4)。
当然,可以以一种方式或另一种方式来调节电平,以提高信号的质量,而另一种则可以提高信号的质量。
MT4 Version Available Here: https://www.mql5.com/en/market/product/43528
Telegram Channel & Group : https://t.me/bluedigitsfx
V.I.P Group Access: Send Payment Proof of any of our Paid Products to our Inbox
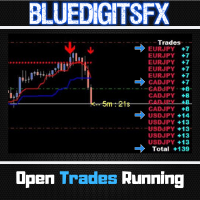
Recommended Broker: https://eb4.app/BDFXOsprey * The Most Sought After Pip Counter for Metatrader ! Features
Will show Currency Symbol in BLUE for Buy positions. Will show Currency Symbol in RED for Sell positions. Will Show pips in BLUE Color for Positive Pips Will Show pips in
FREE

The Weis Waves RSJ Indicator sums up volumes in each wave. This is how we receive a bar chart of cumulative volumes of alternating waves. Namely the cumulative volume makes the Weis wave charts unique. It allows comparing the relation of the wave sequence characteristics, such as correspondence of the applied force (expressed in the volume) and received result (the price progress).
If you still have questions, please contact me by direct message: https://www.mql5.com/en/users/robsjunqueira/
FREE

TrendMeasurer indicator manual / TMi manual The indicator is designed to help the user to find the end point of a strong trending price movement. Important - END. Not start. How the indicator works The first price impulse and its subsequent pullback form a certain "critical mass" which acts as "fuel" for further price movement. The production of this fuel indicates the potential end of the trend. Both volume and indicator calculated in a certain way from price data can be the fuel. The amount of

VWAP Fibo Bands RSJ is an indicator that traces the lines of the daily VWAP and from it creates bands using Fibonacci proportions. This spectacular indicator creates 10 band levels through the selected VWAP period using Fibonacci ratios.
It is fantastic how the prices respect each level of the bands, where it is possible to realize that almost every time the price closes above / below a level of the bands he will seek the next one. If close above will seek to reach the level above and if close
FREE

Setup Tabajara was created by a Brazilian trader known as "The OGRO of Wall Street" .
The idea of this setup is to indicate to the trader the current trend of prices and the type of operation should be looked for in the graph.
Operation
It does this through the relation of the closing price position and the of 20 periods, by painting the candles in 4 possible colors : Green -> Price rising in upward trend (Search entry points for PURCHASE) Black -> Price correcting in Bullish Trend
FREE

VWAP RSJ is an indicator that plots the Hourly, Daily, Weekly and Monthly VWAP Lines.
Large institutional buyers and mutual funds use the VWAP ratio to help move into or out of stocks with as small of a market impact as possible. Therefore, when possible, institutions will try to buy below the VWAP, or sell above it. This way their actions push the price back toward the average, instead of away from it. Based on this information I developed this indicator that combines 4 types of VWAP T
FREE

This simple indicator paints with a darker color on the volume bar when the quantity traded is above the average of select number of periods of the volume itself, highlighting the moments when there was a large volume of deals above the average. It is also possible to use a configuration of four colors where the color tone shows a candle volume strength. The indicator defaults to the simple average of 20 periods, but it is possible to change to other types of averages and periods. If you like
FREE

This indicator calculates the difference between the SELL aggression and the BUY aggression that occurred in each Candle, plotting the balance of each one graphically. Note: This indicator DOES NOT WORK for Brokers and/or Markets WITHOUT the type of aggression (BUY or SELL).
Be sure to try our Professional version with configurable features and alerts: Delta Agression Volume PRO
Settings
Aggression by volume (Real Volume) or by number of trades (Tick Volume) Start of the Aggression De
FREE

The delta indicator is used to display the difference between the volume that passed on the exchange at the Ask price and above (market buys) and the volume that passed at the Bid price and below (market sales). This indicator shows the delta of each candle on the timeframe of your choice. The data is displayed as a colored histogram in a separate indicator window. The indicator is calculated from the tick history, therefore, to speed up the calculations and reduce the load on the system, the n

The indicator draws a normal chart by coloring it in colors based on prices calculated by the Heiken Ashi indicator algorithm.
That is, the shape of the candles does not change.
In fact, this is the same Heiken Ashi that does not distort the price chart.
Then there will be a drawing of a cat, because there is nothing more to write about the indicator. .
FREE

ProFactor is an indicator generating signals based price on the famous profit factor formula. The calculation is simply defined as gross GREEN BARS divided by gross RED BARS.
That's it in a nutshell, but sometimes the simplest things hold the most value.
So let's imagine your trading system's gross profit for the past year was $40,000 and your gross losses were $20,000. Your Profit Factor would be 2. The ProFactor calculation works on the price of the asset instead of the strategy out
FREE

An effective indicator that highlights candles with increasing volumes, overshadowing those with shrinking volumes. Also suitable for Forex because it uses tick_volume.
You can set the colors to your liking. It will be easier to spot trends and possible reversals. The increasing volumes indicate the presence of large investors and therefore determine the reliability of the candle under observation

This indicator watch the Fibonacci retracement for levels and timeframes selected by the trader. In the workload of day trading, having your eyes on all the timeframes to validate some information, for Fibonacci traders, is really time consuming and requires constant focus. With this in mind, this tool allows you to have your attention on other trading details while this one monitors the retracements of each timeframe in real time. In the charts, this indicator data (retracement %, age of the r
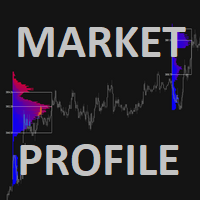
Concept of Market Profile was created at Chicago Board of Trade (CBOT) by trader Peter Steidlmayer and first published during the 1980s as CBOT product. Market profile by itself is not a stand-alone strategy, but a different way how you can view the market and make better trading decisions.
They have seen a market as an auction process which is affected by supply and demand the same way as every other auction, for example, development of prices of food, gas etc.
The price goes up as long th
Stable trend index without clutter The index optimizes the moving average and removes the unstable clutter It can also be used in any other commodity It is best used in mainstream currencies such as EURUSD, USDJPY, GBPUSD and AUDUSD
The time period is 1 hour
I only know a little English, please forgive me if you don't understand I will always improve this indicator

Description
Bitcoin Manager is the best indicator for trading Bitcoin cryptocurrency. It is calculated based on the price deviation from the moving average line channel. Ascending and descending arrows indicate potential points and levels for opening buy and sell positions.
How to use?
We strongly recommend using this indicator on the H1 timeframe. An up arrow indicates a buy level. Down Arrow - Sell Level.
Parameters
Maximum History Bars - maximum count of history bars to calculate

Elliot Waves Analyzer calculates Elliot Waves to Help Identify Trend direction and Entry Levels. Mainly for Swing Trading Strategies. Usually one would open a Position in trend direction for Wave 3 or a Correction for Wave C . This Indicator draws Target Levels for the current and next wave. Most important Rules for Elliot Wave Analysis are verified by the Indicator. This free version is limited for Analyzing one Timperiod Waves. Waves are Shown only in PERIOD_H4 and above. Not Useful for Intr
FREE

The indicator highlights in color the places on the chart where the price moves in one direction continuously from the selected number of candles.
You can specify the number of points from the beginning of the movement to select only movements from this amount.
It can be useful for looking for reversals or sharp impulses.
I also recommend purchasing this utility to determine local weekly / monthly trends and support and resistance lines. https://www.mql5.com/en/market/product/61401
FREE

If You Are Discretionary Trader This Tool Is A Must Chart Switcher ------> Linking Multi-Time Frame Charts / Syncing Indicators And Drawings. Main USP Of This Indicator: Is Opening Multi-Time Frame Multiple Charts {Up To 10 Charts} Of A Symbol With Just 1 Click. You Do not Have To Save Any Template As It has Been Save Auto When You Click Same Symbol Or Move To Another Symbol. It Is Divided Into 2 Parts: 1} COMMON MODE and 2} SYMBOL MODE 1} COMMON MODE: Under This Mode, You Can Sync Commo
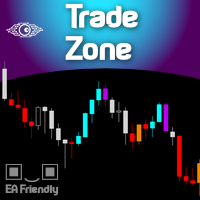
For those who are fans of Bill William's strategy, here it is the Trade Zone indicator filled with alerts and a better coloring system and EA ready (BUY & SELL buffers). And for those who don't know Bill Williams work, search Amazon for the title " Trading Chaos: Maximize Profits with Proven Technical Techniques ". This indicator internally uses the widely known Awesome Oscillator along with the Accelerator indicator, and when both are aligned it lights up the candles signaling a probable strong

Upgraded - Stars added to indentify Areas you can scale in to compound on your entry when buying or selling version 2.4 Upgraded Notifications and alerts added version 2.3 *The indicator is suitable for all pairs fromm Deriv pairs (Vix,jump,boom & crash indices) , Currencies, cryptos , stocks(USA100, USA30 ), and metals like gold etc. How does it work?
Increasing the period make it more stable hence will only focus on important entry points However lowering the period will mean the indica

Profit Loss Meter For the serious trader this fun easy to use indicator allows you to measure Profit and Loss of current, closed or future trades on your forex account chart. It measures Currency Pairs And Indices plus estimates margin levels at the trade close point. The Profit/Loss indicator is based on MT5 native Crosshair instrument. TO ACTIVATED USE "HOT KEYS" ctrl+f just as you would for activating the Crosshair. left click and hold then drag in the direction in which you would like to m

Добрый день. Сегодня добавили вспомогательный индикатор тренда DveMashkiTompson, идея взята из аналога МТ4 и перенесена на МТ5, используется совместно с индикаторами Тренда ТМА и МА, рисует красные и зеленые области в зависимости от направления рынка. Тренд вверх -зеленые области, тренд вниз -красные.Области основываются на пересечении индикатора МА, таким образом данный индикатор дает информацию графического содержания для более быстрой оценки ситуации и принятия решения.
FREE
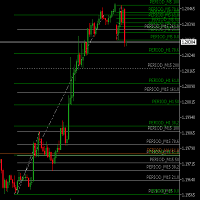
Sets and Updates Fibo-Retracemnet-Levels for Multi Timeframes. Helps to Find TradeZones combined over Multi-Timeframes. M1 M5 M15 H1 H4 D1 are analyzed and shown. Color Changes as soon 161 and 261 Retracements are reached to visualize possible Targets/ TakeProfit Zones . No Settings for Indicator available . Fibonacci retracements are set using a fixed Logic.
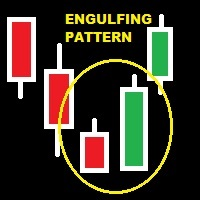
GIVE A LOOK TO MY OTHER PRODUCTS ! There are patterns that are more affidable then others.One of the most important is the engulfing pattern .It is very helpful to understand if there is a change of trend. This indicator find for you affidable engulfing patterns and send you an alert when a pattern is completely formed . To make this alert indicator more reliable,there is a parameter that you can change relative to the engulfing bar ( so the lost one closed before signal ). In fact you can cho

GIVE A LOOK TO MY OTHER PRODUCTS !
100 % PER MONTH PROFIT---- MY NEW SIGNAL HERE -------> https://www.mql5.com/en/signals/2162238?source=Site+Signals+My# Morning and evening star are 2 famous and reliable candlestick patterns, very helpful to understand an imminent change of trend. This indicator finds for you this patterns on your chart and send you an alert just when a pattern is 100 % formed. To make this indicator more reliable,y

This indicator provides an original mix of WPR, VSA, and volume delta. It shows ratio of buy/sell volumes scaled on 100% range based on total volume change for a selected period. The convetional VSA (Volume Spread Analysis) studies interconnections of price action and volume change in absolute values, whereas WPR (Williams Percent Range) offers a convenient approach of price moves normalization into the fixed percentage metric: 0 - 100%. Hence overbough and oversold states are easily spotted. N

Here I present you this awesome indicator I made. This is a nique combination witch puts you in the same level as MM's. So you can surf a lot of waves and identify the rally time, breakouts, and the perfect time to get in the market. ----
The SSL Channel is a great all-rounder based on 2 Simple Moving Averages, one of recent Highs, one of recent Lows. The calculation prints a channel on the chart consisting of 2 lines. This strategy gives a Long signal when price closes above the top of the

Hi-Lo is an indicator whose purpose is to more precisely assist the trends of a given asset - thus indicating the possible best time to buy or sell.
What is Hi-lo?
Hi-Lo is a term derived from English, where Hi is linked to the word High and Lo to the word Low. It is a trend indicator used to assess asset trading in the financial market.
Therefore, its use is given to identify whether a particular asset is showing an upward or downward trend in value. In this way, Hi-Lo Activator can be t
FREE

The indicator measures the accumulated balance of aggression.
The formula is as follows: Accumulated = Previous Candle Accumulated + Purchase Volume - Sales Volume. Know our products
*** Did you like the product? Then, help us doing review in the " Reviews " tab.
The indicator sends information to your email or cell phone when the accumulated balance changes direction. Example : Accumulated seller becomes a buyer.
Note : It is recommended to use the default configuration and VPS

The indicator plots the buying and selling volume on the chart.
Two lines are generated corresponding to the average purchase and sale volumes. The crossing of averages, the increase in their distance are good indicators of market movement.
Know our products
NOTES : It is recommended to use the default configuration and VPS values. You need trading information (Time and Sales).
Parameters : Aggression Numbers of days prior to the current one for calculation; Volume Divider e

This indicator provides you with MACD formula applied to volume-aware Accumulation/Distribution and OnBalance Volumes indicators. In addition to tick volumes it supports special pseudo-real volumes, synthesized for Forex symbols where real volumes are unknown. More details on the volume surrogates may be found in description of another indicators - TrueVolumeSurrogate and OnBalanceVolumeSurrogate (algorithm of the latter is used internally in MACDAD for AD and OBV calculation before they procee

The indicator measures the balance of aggression.
The formula is as follows: Aggression = Purchase Volume - Sales Volume.
Note : It is rec ommended to use the default configuration and VPS values. It does not work in Forex.
Meet Our Products
Parameters : Numbers of days prior to the current one for calculation; Volume Divider e; Enables calculation of the current candle; Histogram Line style and; Size; Line Line style and; Size;
Follow us on our website to check the next new

Investment Castle Support and Resistance Indicator has the following features: 1. Dictates the direction of Buy or Sell trades based on Support and Resistance Levels automatically . 2. Candles stick colors will change to Red for Sell and Blue for Buy (Default settings, user can change from the inputs). 3. This indicator is built-in the Support & Resistance based Investment Castle EA which works with Psychological Key Levels "Support & Resistance".
FREE

This is a bufferless indicator which can display classical X and O columns if applied on custom symbol charts built by Point-And-Figure-like generator PointFigureKagiCharts or its DEMO . The indicator will enforce a fixed price-scale on the chart to make sure the marks keep correct aspect ratio. The marks are shown only if the chart time-scale is large enough to hold them in the space allocated per bar (if the horizontal scale is one of 3 smallest ones, the indicator draws nothing and outputs a
FREE

GIVE A LOOK TO MY OTHER PRODUCTS ! 100 % PER MONTH PROFIT---- MY NEW SIGNAL HERE -------> https://www.mql5.com/en/signals/2162238?source=Site+Signals+My# Double MA Cross Alert,is a cool indicator that notificate you directly on your telephone or email when 2 Moving average ( you choose the parameters ) crosses. This is very important when you want to know a change of trend and you can't stay in front of your pc! The indicator give you the alert just when the next bar opens ,so give you a more

Automatic Fibonacci Tool Fibonacci retracements is a popular instrument used by technical analysts to determine potential Support and Resistance areas. In technical analysis, this tool is created by taking two extreme points (usually a peak and a minimum) on the chart and dividing the vertical distance by the key Fibonacci coefficients equal to 23.6%, 38.2%, 50%, 61.8%, and 100%. Our Automatic Fibonacci Tool is programmed to make thigs easier. Using this tool, there is no need to explicitly set

根据高开低收价格确定反转点位,画出的极点折线。 The pole polyline is drawn according to the high opening and low closing price to determine the reversal point.
参数(Args):
1.周期数(Period)。参与界限计算的K柱数量。 2.界限(Divide)。计算方式包括: t1,顺高低价 (Buy min H,Sell max L) t2,逆高低价 (Buy min L,Sell max H) t3,收盘价 (Buy min C,Sell max C) t4,开盘价 (Buy min O,Sell max O) t5,高开低收价的一半 (HOLC/2) t6,高开低收价的一半+1 (HOLC/2+1) t7,高开低收价的一半+2 (HOLC/2+2) 3.跨越界限使用的价格(Price)。包括收盘价(C)和高低价(HL) 4.偏移(

This indicator calculates Correlation among currency pairs (Selected by user) to find the least and/or most correlated symbols in real time. Correlation ranges from -100% to +100%, where -100% represents currencies moving in opposite directions (negative correlation) and +100% represents currencies moving in the same direction.
Note The Correlation more than 80 (Adjustable) between two currency pairs, Shows that they are quite similar in the kind of movement and side. The Correlation less than
MetaTrader市场是 出售自动交易和技术指标的最好地方。
您只需要以一个有吸引力的设计和良好的描述为MetaTrader平台开发应用程序。我们将为您解释如何在市场发布您的产品将它提供给数以百万计的MetaTrader用户。
您错过了交易机会:
- 免费交易应用程序
- 8,000+信号可供复制
- 探索金融市场的经济新闻
注册
登录