 MetaTrader 5
 Experts
 Indicadores
 Bibliotecas
 Utilitários
 Widgets
 Regras
Conheça o Mercado MQL5 no YouTube, assista aos vídeos tutoriais
Como comprar um robô de negociação ou indicador?
Execute seu EA na
hospedagem virtual
hospedagem virtual
Teste indicadores/robôs de negociação antes de comprá-los
Quer ganhar dinheiro no Mercado?
Como apresentar um produto para o consumidor final?
Novos Indicadores Técnicos para MetaTrader 5 - 183
 É com base nos sinais de indicadores técnicos que se aplicam as decisões para abertura ou fechamento de uma transação nos mercados de ações e Forex. A essência dos indicadores reside na previsão de mudanças de preço, com base na conversão matemática de preço e/ou volumes de um instrumento financeiro.
Teste os indicadores técnicos para prever melhor o comportamento do mercado e lucrar com isso.

O filtro Kolmogorov-Zhurbenko pode ser considerado como uma função de janela especial projetada para eliminar o vazamento espectral. Esse filtro é ideal para suavizar séries temporais estocásticas (incluindo financeiras). O indicador baseado neste filtro contém os seguintes parâmetros: iLength - o período da janela retangular original usada para construir o filtro. O valor válido é 2 - 255. iDegree - ordem do filtro. Se iDegree=0, uma média móvel simples será obtida. Se iDegree=1, você obtém um
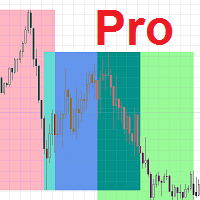
O indicador de sessões de negociação destaca os começos e os fins de cada sessão de negociação .
Versão paga do produto Trading_Sessions_Indicator_Free com a capacidade de personalizar o início/fim das sessões.
[Opções:] Asian session Open Asian session Close Asian session OpenSummertime Asian session CloseSummertime European session Open European session Close European session Open European session Close Timeshift
Use os prazos M15-H2 para obter melhores resultados.
Correção adicionada par
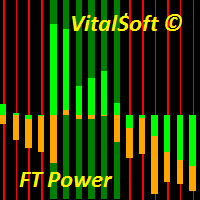
The FT Power indicator system is designed to determine the trend direction of the price chart. Consists of two histograms. The central histogram Bull/Bear Power determines the predominance of bullish or bearish power. When the indicator value is above zero, Bull/Bear Power shows that the bulls are strong, and when the histogram goes below 0, the bulls are exhausted and further growth becomes doubtful. The main histogram is used to determine the trend or flat sections of the chart and confirm the

This indicator calculates gann support and resistance prices with use gann pyramid formulation and draw them on the chart. And If you want, Indicator can alert you when the current price arrive these pivot levels. Alert Options: Send Mobil Message, Send E-mail, Show Message and Sound Alert Levels: S1, S2, S3, S4, S5, R1, R2, R3, R4, R5 Inputs: GannInputPrice: Input price for gann pyramid formulation. GannInputDigit: How many digit do you want to use for calculation formula. (The number and the
FREE

This indicator is designed according to the combination of WPR and Stoch indicators, when WPR goes up and Stoc goes up quickly too, the price may meet strong resistance, many times short order will take profit, but if the price break through it, Long positions are more likely to be profitable, and the reverse held true as well. You can adjust the parameters of WPR and Stoc to Adapt the symbol you operate. Click here to look the advanced edition: https://www.mql5.com/en/market/pro
FREE

Offer 249 down from 350 for the next 1 copies. then back to 350 $
Are you tired of using outdated indicators that leave you guessing where to set your profit targets? Look no further than the AK CAP Opening Range Breakout Indicator. This powerful tool is backed by a US patent and has already helped countless traders pass funded challenges like FTMO. We use it daily on our prop traders and internal funds, and now it's available to you as well. The calculation behind the indicator is incredibly a
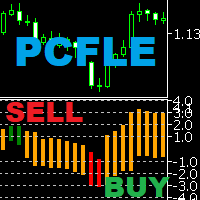
PCFLE Histogram (Price Change From the Last Extreme) - plots the percentage movement from the last extreme. Can be used for graphical representation of percentage movement from last lowest low to current high / from last highest high to current low. Input parametters: InpDigits - the number of decimal places displayed on the y-axis You can set colors and horizontal levels in the indicator properties. Examples of how to trade with the indicator can be found in screenshots.
Simple Super Trend indicator for MetaTrader 5. A trend indicator similar to moving averages. Use it for entry and exit signals. It gives accurate signals on precise time. Works as a Trailing SL/TP. This indicator can also be used on multiple timeframes where you place it on a larger timeframe then go to a lower timeframe. Super Trend needs to be used in conjunction with other indicators like rsi, Parabolic SAR, MACD, etc to receive filtered signals.

Trend Reversal alert: The concept of the EA is to give you a message/alert when something happens in the market, so you will never pass a tradechance for a trendreversaltrade. The EA give you the message when the chance is higher for a trendreversal, but it is important to say that this doesn`t mean that you should trade every signal. The advantage provided by the program is that you don`t need to sit the hole time for the PC and look at the chart because you get a message when a good trendrever
FREE
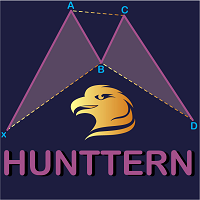
"Hunttern harmonic pattern finder" base on the dynamic zigzag with the notification and prediction mode
This version of the indicator identifies 11 harmonic patterns and predicts them in real-time before they are completely formed. It offers the ability to calculate the error rate of Zigzag patterns depending on a risk threshold. It moreover sends out a notification once the pattern is complete.
The supported patterns:
ABCD BAT ALT BAT BUTTERFLY GARTLEY CRAB DEEP CRAB CYPHER SHARK THREE DRIV

Indicador de oferta e demanda real - permitirá que você determine rapidamente a localização dos níveis de resistência e suporte em todos os prazos. O indicador será útil para quem usa análise técnica em suas negociações. O indicador é fácil de usar, basta arrastar e soltar no gráfico e o indicador mostrará os níveis de suporte e resistência mais prováveis. Ao alternar os prazos, você verá os níveis para o período de tempo recém-selecionado.
Robot Scalper Recomendado - teste

Vix 75 and Boom Sniper Entry
= Assistance for Non Beginners traders = Market Structure is KEY =Trading is a Risk ... Know what you are entering into when starting your trading journey
Basically the indicator gives signals due to reach of Support and Resistance, it also give signals on touch of order block. Works Best on Gold and Eurusd and Synthetic Index - its best give accurate confluences with a TDI
TDI settings: RSI Period -10 Bollinger Bands - Period 34 - First indicators Data M

Acompanhe a direção do mercado de imediato KT Trend Filter transforma seu método refinado de análise de tendência em uma linha clara e colorida diretamente no gráfico de preços. Ele ajuda a reconhecer se o mercado está subindo, caindo ou se movendo lateralmente sem empilhar vários indicadores. Com o Trend Period padrão de 200, você obtém uma visão direcional ampla e mantém o estado atual fácil de identificar. Transforme a tendência em contexto visual claro Uptrend azul: Destaca um estado de alta
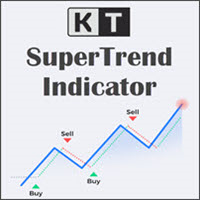
O KT SuperTrend coloca uma linha direcional clara no gráfico de preços. Durante uma tendência de alta, a linha avança abaixo do preço e pode servir como referência para acompanhar o movimento. Durante uma tendência de baixa, ela fica acima do preço e acompanha o mercado para baixo. Como a distância é baseada no Average True Range, a linha se adapta quando a volatilidade aumenta ou diminui. A direção muda depois que um candle fecha do outro lado da linha SuperTrend. Um fechamento acima da linha m
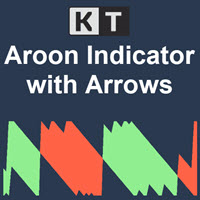
O KT Aroon Oscillator é uma versão modificada do oscilador Aroon original, desenvolvido por Tushar Chande em 1995. Ele mede o intervalo de tempo entre os altos e baixos recentes e usa essa informação para calcular a direção e a força da tendência do mercado. Ele funciona com base na ideia de que, durante uma tendência de alta, o preço formará sucessivos topos, enquanto em uma tendência de baixa, novos fundos serão estabelecidos. Sinal de compra: Quando a linha Aroon Up cruza acima da linha Aroo

O indicador mostra uma tendência e metas para a situação atual todos os dias. O indicador também reduz o número de acordos de produção de perdas, para contar a definição certa das condições de mercado. Desenhado para análise e comércio dentro do dia.
Como usar:
A linha azul mostra o preço de abertura do dia, que está estabelecido numa fórmula especial de 4 linhas que estabelece metas para o dia. Você pode olhar e abrir acordos para a tendência.
A linha cinzenta é o primeiro golo. Quando são a
FREE
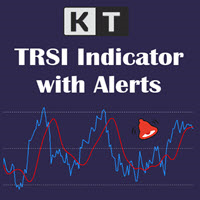
O KT TRSI é um oscilador construído a partir da combinação do RSI (Índice de Força Relativa), EMA (Média Móvel Exponencial) e SMA (Média Móvel Simples). Comparado ao RSI clássico, o TRSI é menos suscetível a sinais falsos devido ao fator de suavização da SMA. Além disso, ele é compatível com todos os tipos de alertas do MetaTrader.
Regras simples de entrada
Compra: quando a linha azul (RSI) cruza acima da linha vermelha (TRSI). Venda: quando a linha azul (RSI) cruza abaixo da linha vermelha (TR
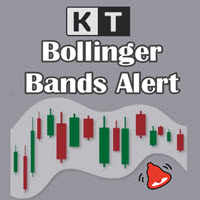
Monitore cada toque nas Bandas de Bollinger diretamente no gráfico KT Bollinger Bands Alert exibe as bandas superior, média e inferior e monitora quando o candle atual toca qualquer banda selecionada. Ative os eventos que fazem parte do seu método e deixe o indicador chamar sua atenção nesses momentos enquanto você acompanha o restante do mercado. Mantenha os valores das três bandas visíveis As etiquetas de preço opcionais acompanham os valores atuais das bandas superior, média e inferior no grá
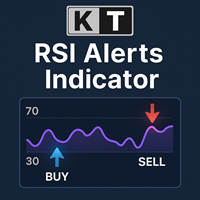
KT RSI Alerts é uma implementação personalizada do oscilador RSI (Índice de Força Relativa) que fornece sinais e alertas com base em quatro eventos personalizados: Quando o RSI entra na zona de sobrecompra. Quando o RSI sai da zona de sobrecompra. Quando o RSI entra na zona de sobrevenda. Quando o RSI sai da zona de sobrevenda.
Recursos Uma excelente opção para traders que analisam os movimentos do RSI dentro das zonas de sobrecompra/sobrevenda. Indicador leve, desenvolvido para consumir pouca

KT Forex Volume exibe o volume de compra e venda de um par de moedas na forma de um histograma colorido. O volume é composto por transações de compra e venda de um ativo. No mercado Forex: Se o volume de compra for maior que o de venda, o preço do par de moedas tende a subir. Se o volume de venda for maior que o de compra, o preço do par de moedas tende a cair.
Recursos Evite operações ruins confirmando-as com dados de volume por tick. Ajuda você a operar na direção dos grandes players do merca
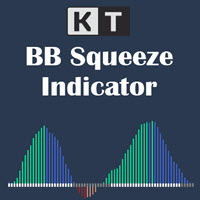
Veja a volatilidade contrair antes da expansão do momentum O KT BB Squeeze reúne o estado da volatilidade e a direção do momentum em um oscilador claro. Ele compara Bollinger Bands com Keltner Channels para mostrar se o mercado está comprimido ou em expansão, enquanto o histograma revela como o momentum evolui em torno da linha zero. Pontos cinza: Bollinger Bands está dentro de Keltner Channels e indica uma fase de compressão. Pontos brancos: Bollinger Bands está fora de Keltner Channels e indic
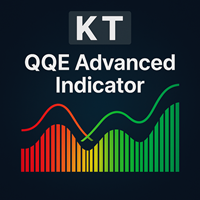
O KT QQE Advanced é uma versão modificada do oscilador QQE clássico que o apresenta de forma mais fiel por meio de um histograma colorido com Trailing Line (TL) rápido e lento.
Diferente do QQE tradicional, o KT QQE Advanced traz um histograma com níveis de sobrecompra/sobrevenda.
Aplicações
Encontre sinais rápidos de compra/venda em todos os timeframes usando o scanner MTF. Determine a direção da tendência com maior precisão. Detecta mercado sobrecomprado/sobrevendido. Mostra o momentum do p
Este indicador colocar Fibonacci nas pernas do indicador zigzag
Parâmetros:
ZigZag Show Depth Deviation Backstep Fibonacci Show Invertido (trabalhar com o fibonacci invertido) niveis (separe as porcentagens com ",") cor estilo largura da linha usar raio o parâmetro níveis (levels) pode ser modificador com qualquer valor de porcentagem, e os valores podem ser separados por virgula Se você se interessar por esse indicador deixe um comentário para eu continuar melhorando ele
FREE
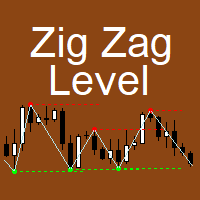
The indicator implements the author's approach to the construction of the popular "Zig-Zag" indicator.
The advantages of the "ZIgZag Level" indicator is that it filters out market noise and shows levels.
"ZIg Zag Level" is based on peaks and troughs, displays levels.
These levels can be disabled and configured.
The indicator displays the price of the level, the price tag can be disabled.
The "zigzag" line between the points can also be disabled.
The indicator has a built-in notification s
Tomamos 5 medios móviles las unimos en una la cual suavizamos y volvemos a suavizar, resultando un mega suavizador de medios móviles suavizadas. Indicador de mql5 funciona en cualquier broker y para todos los tiempos, siendo el mas optimo el de 5, 15 a mas. Funciona mejor en grupo consigo misma osea poner uno de 14 y otro de 50 y 400,, así se observa mejor su desempeño.
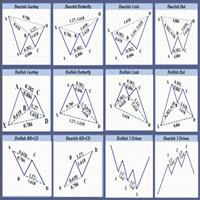
Only 5 copies of the EA at $30! Next price --> $45 Find charts and signals based on harmonic patterns, which work great in 1-hour timeframes and up.
Buy and sell signs based on different harmonic patterns as follows:
0: ABC_D
1: ABCD_E
2: 3Drive
3: 5_0
4: Gartley
5: Bat
6: Crab
7: Butterfly
8: Cypher
9: NenStar
10: Shark
11: AntiBat
12: AntiGartley
13: AntiCrab
14: AntiButterfly
15: AntiCypher
16: AntiNenStar
17: AntiShark
How to use:
When there is an opportunity to buy or sell, you have 5:

ATR Scanner Pro is a multi symbol multi timeframe volatility scanner that monitors and analyzes Average True Range indicator value in up to 28 symbols and 9 timeframes in 3 modes : ATR value: As a volatility dashboard it shows the ATR indicator value in all pairs and timeframes and signals when the ATR value reaches a maximum or minimum in a given duration. Short term ATR/Long term ATR ratio: It shows ratio of 2 ATRs with different periods. It's useful in detecting short term volatility and
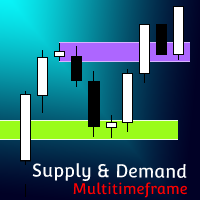
[ MT4 Version ] Supply and Demand Multitimeframe Supply and Demand Multitimeframe is the first indicator in the market that combines multiple aspects like trading volume, price structure and momentum to identify Supply and Demand zones for every asset. The Supply and Demand indicator analyzes simultaneously up to 4 different TFs and represents their information in the current graph. Its interactive UI highlights everytime the price enters a Supply or Demand zone even if the zones are not visible

Indicator and Expert Adviser EA Available in the comments section of this product. Download with Indicator must have indicator installed for EA to work.
Mt5 indicator alerts for bollinger band and envelope extremes occurring at the same time. Buy signal alerts occur when A bullish candle has formed below both the lower bollinger band and the lower envelope Bar must open and close below both these indicators. Sell signal occur when A bear bar is formed above the upper bollinger band and upper
FREE
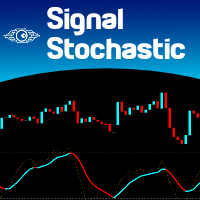
It is the very same classic Stochastic indicator, but with a little twist: we changed the Signal Line with a 2-color line, so we can use it with EAs as a filtering system. And that's it! I know it could seem stupid but I needed that, so I created it. The original formula is right from Metaquote's chest, no additions, no subtractions, it is Stochastics in its core.
So I will not publish here the Stochastics parameters as they are all the same as always... Enjoy!
If you like this indicator, all I
FREE
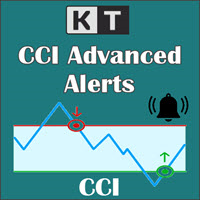
KT CCI Alerts is a personal implementation of the Commodity Channel Index (CCI) oscillator that provide signals and alerts on four custom events: When CCI enter in an overbought zone. When CCI exit from an overbought zone. When CCI enter in an oversold zone. When CCI exit from an oversold zone.
Features A perfect choice for traders who speculate the CCI movements within an overbought/oversold zone. Lightly coded without using extensive memory and resources. It implements all Metatrader alerts.
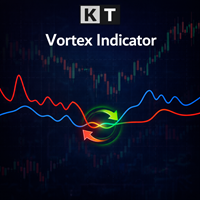
The Vortex Indicator was first presented by Douglas Siepman and Etienne Botes in January 2010 edition of Technical Analysis of Stocks & Commodities. Despite its based on a complex implosion phenomenon, the vortex is quite simple to interpret. A bullish signal is generated when +VI line cross above the -VI line and vice versa. The indicator is mostly used as a confirmation for trend trading strategies. The Vortex was inspired by the work of Viktor Schauberger, who studied the flow of water in tur
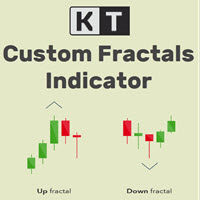
KT Custom Fractals is a personal implementation of the Fractal indicator first introduced by Bill Williams. With KT Custom Fractals you can choose a custom number of bars to allow to the left and right side of the fractal. For example, you can display the fractals that have "three" successive bars with the highest high in the middle and one lower high on both sides , or you can display the fractals that have "Eleven" consecutive bars with the lowest low in the middle and five higher lows on bot

KT Fractal Channel Breakout draws a continuous channel by connecting the successive Up and Down fractals. It provides alerts and also plots the Up and Down arrows representing the bullish and bearish breakout of the fractal channel.
Features
If you use Bill Williams fractals in your technical analysis, you must also include it in your trading arsenal. It can be very effective and useful for stop-loss trailing. A new market trend often emerges after a fractal channel breakout in a new direction.
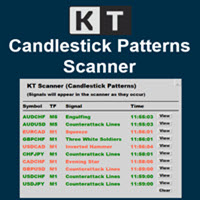
KT Candlestick Patterns Scanner is a Multi-Symbol and Multi-Timeframe scanner that fetches and shows various candlestick patterns on 28 currency pairs and 9 time-frames concurrently . The scanner finds the candlestick patterns by loading the KT Candlestick Patterns indicator as a resource in the background.
Features
The scanner can find the candlestick patterns on 252* combinations of symbols and time-frames from a single chart. Open the signal's chart loaded with a predefined template with a s
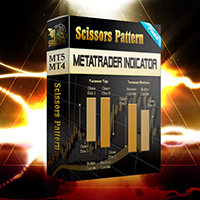
Configure scaffolding charts and signals based on the scissor pattern, which works great at low times.
Buy and sell signs based on 2 previous candle patterns
It works on the active time form, and when detecting the pattern in 4 time frames, 5 minutes, 15 minutes, 30 minutes and one hour, the alert can be set to notify us of the formation of this pattern.
MetaTrader version 4 click here
How to use:
When there is an opportunity to buy or sell, the marker places a scissors mark on the candle
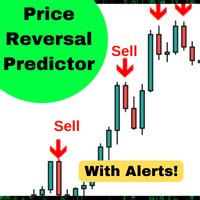
Este algoritmo prevê mudanças de curto prazo no preço com uma precisão de 90%*. Prevê se o preço será maior ou menor do que a vela de sinal. Perfeito para negociação de reversão média, opções binárias ou contratos futuros em prazos maiores. O indicador foi testado em 5 anos de dados e tem uma precisão de 90% para prever reversões de preços ao longo do tempo.
Recurso:
Configuração simples Arraste e solte em qualquer gráfico Ativar alertas (opcional) E você acabou! Alertas visuais e de áudio Al
FREE
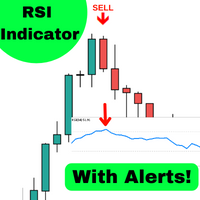
Este algoritmo prevê mudanças de curto prazo no preço com uma precisão de 86%*. Quando há um grande movimento conforme determinado pelo ATR, durante uma condição de sobrecompra ou sobrevenda, o indicador irá alertá-lo. Prevê se o preço será maior ou menor do que a vela de sinal. Perfeito para negociação de reversão média, opções binárias ou contratos futuros em prazos maiores. O indicador foi testado em 5 anos de dados e tem uma precisão de 90% para prever reversões de preços ao longo do tempo.
FREE
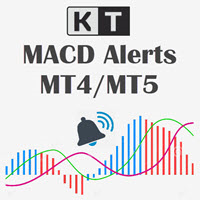
Sinais claros de momentum MACD KT MACD Alerts ajuda os traders a reconhecer mudanças na direção e no momentum do mercado por meio de uma exibição MACD limpa e codificada por cores. Os cruzamentos de alta e de baixa são fáceis de identificar, enquanto as linhas verticais no gráfico e os alertas flexíveis ajudam a chamar sua atenção para cada novo sinal. Os sinais são confirmados após o fechamento da vela, oferecendo uma visão clara e consistente das mudanças no momentum do MACD ao longo do gráfic

O KT Coppock Curve transforma uma leitura suavizada de momentum em uma visão clara da direção do mercado. Ele funciona em uma janela separada abaixo do gráfico de preços, onde a linha zero é a principal referência. Em vez de reagir a cada pequena mudança da curva, você consegue ver rapidamente se o momentum permanece no lado comprador ou vendedor. A curva combina leituras de taxa de variação de períodos mais longos e mais curtos, e suaviza o resultado. Isso ajuda a acompanhar mudanças mais ampla
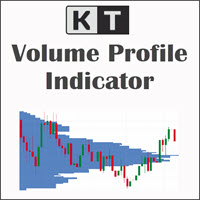
O KT Volume Profile ajuda você a estudar onde a atividade de negociação ficou concentrada dentro de uma área escolhida no gráfico. Posicione o retângulo sobre o movimento que deseja analisar e arraste a borda esquerda ou direita. O perfil é recalculado na hora e exibe um histograma horizontal ao longo da faixa de preços selecionada. Escolha a parte do gráfico que realmente importa Você não fica preso a uma sessão ou período fixo. O retângulo móvel permite isolar uma perna de tendência, uma conso

Nosso indicador fornecerá um rastreador de spread para monitorar o spread de vários pares simultaneamente e também uma contagem regressiva do temporizador de velas exibe o tempo restante antes que a barra atual feche e uma nova barra se forme.
OFERTA POR TEMPO LIMITADO: Todos os nossos indicadores premium estão disponíveis por apenas 50$, acessando nosso blog MQL5 você encontrará todos os detalhes de nossos indicadores premium. Clique aqui.
Características principais Monitore a propagação d
FREE

O ROC mede a velocidade com que o preço mudou em relação a um período anterior. Por isso, ele se torna especialmente útil quando o preço alcança uma nova máxima ou mínima de oscilação, mas o momentum por trás do movimento não confirma. O KT ROC Divergence encontra essas diferenças automaticamente e desenha linhas correspondentes no gráfico de preço e na janela do ROC. Ao contrário de osciladores que permanecem dentro de uma faixa fixa, o ROC se expande e se contrai conforme a velocidade do merca
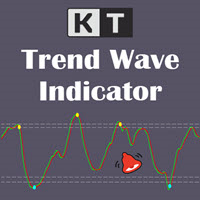
Acompanhe os cruzamentos do Trend Wave em seu contexto O KT Trend Wave transforma o movimento do preço em um oscilador claro com uma onda principal e uma linha de sinal suavizada. Ele aparece em uma janela separada abaixo do gráfico de preços, mantendo a onda, as áreas de referência e os marcadores de cruzamento visíveis sem cobrir os candles. Leia as linhas, as zonas e os marcadores em conjunto Linha principal verde-limão: Mostra a resposta mais rápida da onda de tendência. Linha de sinal verme
Indicador Relative Vigor Index (RVI) avançado com sinais de linha dupla, sistema de nível zero, suporte multi-timeframe, sinais visuais personalizáveis e sistema de alertas altamente configurável.
Serviços de programação freelance, atualizações e outros produtos TrueTL estão disponíveis no meu perfil MQL5 .
Comentários e avaliações são muito apreciados!
O que é o Relative Vigor Index (RVI)? O Relative Vigor Index (RVI) é um oscilador de momentum desenvolvido por John Ehlers que mede a convicç
FREE
Veja em qual sessão do forex você está operando e quantos pips cada sessão moveu, direto no seu gráfico do MetaTrader 5. KT Forex Sessions MT5 é um indicador de sessões que desenha as sessões de Tóquio, Londres e Nova York como caixas coloridas e escreve o tamanho de cada sessão em pips na sua caixa. O indicador lê sozinho o fuso GMT da sua corretora, e cada sessão segue a hora local e o horário de verão da sua própria cidade. As caixas ficam no lugar certo o ano todo, sem nada para configurar.
É um fato bem conhecido que os mercados financeiros tendem apenas cerca de 30% do tempo, enquanto nos outros 70% movimentam-se dentro de uma faixa lateral. No entanto, a maioria dos traders iniciantes tem dificuldade em identificar se o mercado está em tendência ou preso em um movimento lateral. O KT Chop Zone resolve esse problema ao destacar claramente a fase do mercado em três zonas: Zona de Baixa, Zona de Alta e Zona de Consolidação (Chop Zone).
Recursos
Melhore instantaneamente sua negocia
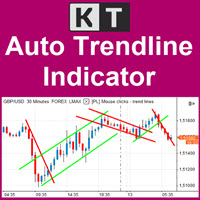
Mantenha as linhas de tendência importantes atualizadas KT Auto Trendline constrói automaticamente uma linha de tendência superior e outra inferior a partir dos pontos de oscilação recentes do ZigZag, projetando ambas para a frente no gráfico ativo. Isso oferece uma estrutura clara para acompanhar rompimentos em formação, rejeições e mudanças na direção do preço sem precisar redesenhar as mesmas linhas manualmente. Acompanhe a estrutura próxima e os movimentos mais amplos O primeiro conjunto de
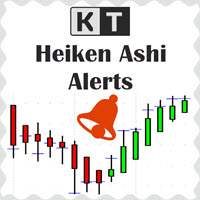
O KT Heiken Ashi Alert exibe setas de compra e venda e gera alertas com base nas velas padrão de Heiken Ashi. É uma ferramenta essencial para traders que desejam incorporar Heiken Ashi em sua estratégia de negociação. Uma seta de compra é exibida quando o Heiken Ashi muda de estado de baixa para alta. Uma seta de venda é exibida quando o Heiken Ashi muda de estado de alta para baixa. Inclui notificações por celular, e-mail, som e alertas pop-up.
O que é exatamente o Heiken Ashi? Em japonês, "He

KT Pip Counter é um indicador simples e informativo que exibe dados essenciais em tempo real. Informações tão críticas podem beneficiar o trader durante sessões intensas de negociação.
Funcionalidades
Mostra o lucro/prejuízo atual em moeda, pips e porcentagem. Exibe o spread do momento. Indica o tempo restante para o fechamento da vela atual. Esquemas de cores distintos para cenários de lucro/prejuízo. Posição e layout do texto totalmente personalizáveis. Consome recursos mínimos de CPU.
Inp

O KT Pivot Points traça automaticamente os níveis de pivô diários, semanais e mensais no gráfico, com cálculos precisos baseados nos dados mais recentes. Pontos de pivô são indicadores amplamente utilizados na análise técnica, especialmente no mercado Forex.
Recursos
Envia alertas quando o preço atinge um nível de pivô. Oferece personalização completa para cada tipo de nível de pivô. Mostra os níveis de pivô diário, semanal e mensal de forma clara e simples. Utiliza recursos mínimos da CPU
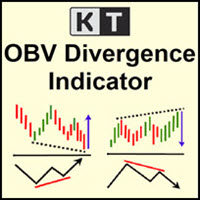
KT OBV Divergence mostra as divergências regulares e ocultas formadas entre o preço e o oscilador OBV (On Balance Volume).
Recursos
Divergências assimétricas são descartadas para maior precisão e menos poluição visual. Suporta estratégias de trading para reversão de tendência e continuação de tendência. Totalmente compatível e pronto para ser integrado a um Expert Advisor. Pode ser utilizado tanto para entradas quanto para saídas. Todos os tipos de alertas do MetaTrader estão disponíveis.
O qu
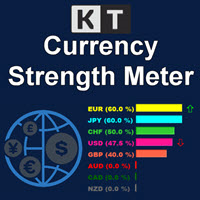
O KT Currency Strength Meter mede a força e a fraqueza das moedas individuais aplicando uma fórmula matemática agregada sobre os principais pares de moedas do mercado Forex. A força é calculada com base nas velas de alta e baixa durante um período fixo. Depois de preencher os dados de força, um algoritmo classifica as moedas da mais forte à mais fraca e atualiza essa ordem em tempo real com os dados recebidos.
Vantagens
Melhore sua estratégia de negociação instantaneamente filtrando sinais que
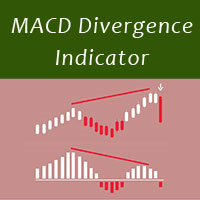
MACD divergence indicator finds divergences between price chart and MACD indicator and informs you with alerts (popup, mobile notification or email) . Its main use is to find trend reversals in the chart. Always use the divergence indicators with other technical assets like support resistance zones, candlestick patterns and price action to have a higher possibility to find trend reversals. Three confirmation type for MACD divergences: MACD line cross zero level Price returns to previous H/L Crea
FREE
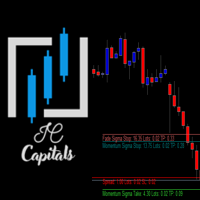
Key Features: Multi-Target Volatility: Configure multiple Take Profit and Stop Loss levels based on real-time market volatility. Fully Customizable: Set specific volatility multipliers (e.g., 4x for Stop, 10x for Take) using any look-back period (e.g., previous 20 bars on a 2-minute chart). Clear Visuals: Assign unique names to each level to be displayed directly on your symbol's chart for easy monitoring. Consistency: Every level calculated is synchronized with the volatility of your chosen per
FREE
Tick imbalance bars (TIB), descrito no livro Advances in Financial Machine Learning (2018) de Marcos López de Prado. Indicador que forma barras (candlesticks) com uma amostragem diferente da fixa por tempo. Utiliza dados em tempo real e pode ser usado como substituto do gráfico padrão. Cada barra é formada quando um certo equilíbrio é ultrapassado, devolvendo ao usuário os valores OHLC do agrupamento.
O parâmetro de entrada tick_threshold é o balanço esperado de uma barra. Quando excedido, um
FREE
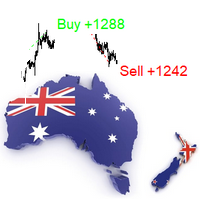
The indicator is a trading system for AUDUSD or NZDUSD currency pairs.
The indicator was developed for time periods: M15, M30.
At the same time, it is possible to use it on other tools and time periods after testing.
"Kangaroo Forex" helps to determine the direction of the transaction, shows entry points and has an alert system.
When the price moves in the direction of the transaction, the maximum length of the movement in points is displayed.
The indicator does not redraw, all actions occ

Market Momentum Alerter Market Momentum Alerter will inform you about danger to operate in the market.
Imagine you see a very nice setup (Forex, Stocks, Indices) and you decide to place your trade...
And you finally lose your trade and don't understand what happened.
This can happen due to big operations in the market carried out by banks and big institutions.
These operations are invisible for most people.
Now with the Market Momentum Alerter you will be able to detect those operations...
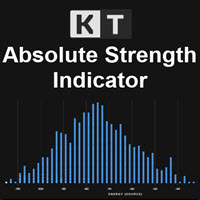
KT Absolute Strength measures and plots the absolute strength of the instrument's price action in a histogram form. It combines the moving average and histogram for a meaningful illustration. It supports two modes for the histogram calculation, i.e., it can be calculated using RSI and Stochastic both. However, for more dynamic analysis, RSI mode is always preferred.
Buy Entry
When the Absolute Strength histogram turns green and also it's higher than the previous red column.
Sell Entry
When th
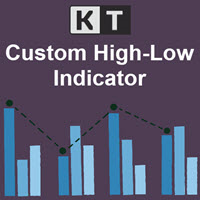
KT Custom High Low shows the most recent highs/lows by fetching the data points from multi-timeframes and then projecting them on a single chart. If two or more highs/lows are found at the same price, they are merged into a single level to declutter the charts.
Features
It is built with a sorting algorithm that declutters the charts by merging the duplicate values into a single value. Get Highs/Lows from multiple timeframes on a single chart without any fuss. Provide alerts when the current pri
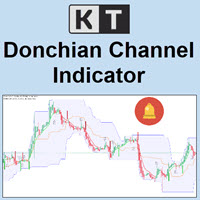
KT Donchian Channel is an advanced version of the famous Donchian channel first developed by Richard Donchian. It consists of three bands based on the moving average of last high and low prices. Upper Band: Highest price over last n period. Lower Band: Lowest price over last n period. Middle Band: The average of upper and lower band (Upper Band + Lower Band) / 2. Where n is 20 or a custom period value is chosen by the trader.
Features
A straightforward implementation of the Donchian channel ble
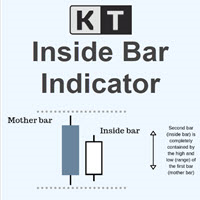
KT Inside Bar plots the famous inside bar pattern in which the bar carries a lower high and higher low compared to the previous bar. The last bar is also known as the mother bar. On smaller time-frames, the inside bar sometimes appears similar to a triangle pattern.
Features
Also plots entry, stop-loss, and take-profit levels with the inside bar pattern. No complex inputs and settings. Erase unwanted levels when the price reaches the entry line in either direction. All Metatrader alerts include
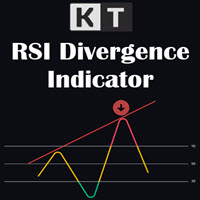
KT RSI Divergence shows the regular and hidden divergences built between the price and Relative Strength Index (RSI) oscillator. Divergence can depict the upcoming price reversal, but manually spotting the divergence between price and oscillator is not an easy task.
Features
Ability to choose the alerts only for the divergences that occur within an overbought/oversold level. Unsymmetrical divergences are discarded for better accuracy and lesser clutter. Support trading strategies for trend reve

Best indicator for MT5 providing accurate and sniper signals to enter a trade without repainting!
It can be applied to any financial assets: forex, synthetic, cryptocurrencies, metals, stocks, indices . It will provide pretty accurate trading signals and tell you when it's best to open a trade and close it. Most traders improve their trading results during the first trading week with the help of the Power Indicator Pro.
Benefits of the Power Indicator Pro
Entry signals without repaint

KT Average Daily Range(ADR) shows the upper and lower levels using the average daily range covered by the currency pair or the instrument. The average daily range is calculated using the chosen period in the input settings. ADR High: ADR upper level is found by adding the average daily range value to the current day's low.
ADR Low: ADR lower level is found by subtracting the ADR value from the current day's high.
Features
It shows the ADR levels with several other helpful information benefici

KT Fisher Transform is an advanced version of the original Fisher Transform oscillator equipped with divergence detection, crossover alerts, and many more features. Originally it was developed by John F. Ehlers. It converts the asset's price into a Gaussian normal distribution to find the local extremes in a price wave.
Features
A light-weighted oscillator that efficiently identifies the upward and downward crossovers and marks them using vertical lines. It also finds regular and hidden diverg

PriceRunner MT5 The PriceRunner indicator is based on pure relative power. It gives promising results even in M1 timeframes in currency pairs and M2 in commodities and cryptos. The indicator is designed with user-friendly and simple settings. It is very suitable even for beginners who are interested in indicators and strategies. I am ready to make improvements on the indicator in line with the needs of those who buy or rent. However, even in its current state, you can see very promising results
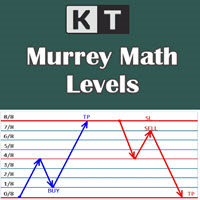
It shows the Murrey Math levels on chart and also provides an alert when price touch a particular level. T. Henning Murrey, in 1995, presented a trading system called Murrey Math Trading System, which is based on the observations made by W.D Gann.
Applications
For Murrey Math lovers, this is a must-have indicator in their arsenal. There is no need to be present on the screen all the time. Whenever the price touches a level, it will send an alert. Spot upcoming reversals in advance by speculatin
KT Candle Timer shows the remaining time in the closing of the current bar. You can use the bar closing time for multiple purposes, including time and trade management during the trading hours.
Features
It also shows the Symbol spreads along with the remaining time. It offers two convenient timer display positions, i.e., chart corner or next to the current bar. From colors to text size, it offers full customization according to user preferences. It is optimized to work without using extensive c
KT Bullish Bearish shows the bullish/bearish regime of the market in the form of a colored histogram representing both of the market states alternately. Bull Market (Blue Histogram): A bull market indicates an uptrend when an instrument price rises over a continued period like days, months, or years. Bear Market (Red Histogram): A bear market indicates a downtrend when an instrument price rises over a continued period like days, months, or years.
Applications
It prevents trading against the big
Saiba como comprar um robô de negociação na AppStore do MetaTrader, a loja de aplicativos para a plataforma MetaTrader.
O Sistema de Pagamento MQL5.community permite transações através WebMoney, PayPay, ePayments e sistemas de pagamento populares. Nós recomendamos que você teste o robô de negociação antes de comprá-lo para uma melhor experiência como cliente.

Você está perdendo oportunidades de negociação:
- Aplicativos de negociação gratuitos
- 8 000+ sinais para cópia
- Notícias econômicas para análise dos mercados financeiros
Registro
Login
Você concorda com a política do site e com os termos de uso
Se você não tem uma conta, por favor registre-se