 MetaTrader 5
 Experts
 Indicadores
 Bibliotecas
 Utilitários
 Widgets
 Regras
Conheça o Mercado MQL5 no YouTube, assista aos vídeos tutoriais
Como comprar um robô de negociação ou indicador?
Execute seu EA na
hospedagem virtual
hospedagem virtual
Teste indicadores/robôs de negociação antes de comprá-los
Quer ganhar dinheiro no Mercado?
Como apresentar um produto para o consumidor final?
Indicadores Técnicos Grátis para MetaTrader 5 - 43
 É com base nos sinais de indicadores técnicos que se aplicam as decisões para abertura ou fechamento de uma transação nos mercados de ações e Forex. A essência dos indicadores reside na previsão de mudanças de preço, com base na conversão matemática de preço e/ou volumes de um instrumento financeiro.
Teste os indicadores técnicos para prever melhor o comportamento do mercado e lucrar com isso.

O Simple Background MT5 foi criado com objetivo de proporcionar ao trader a facilidade de personlizar o meta trader com uma imagem de preferência para background/wallpaper. Não existe dificuldade aqui.
Vamos direto ao ponto:
1 - Instale o indicador; 2 - Escolha sua imagem de preferência em formatos como jpg, png, etc... abra a imagem no paint e salve-a como .bmp; 3 - Após salvar a imagem como .bmp, coloque na pasta images (seguindo essa rota pelo terminal MQL5\Images); 4 - Insira o indicador n
FREE

Esse Indicador é uma boa opção para quem gosta de operar a longo prazo e com paciência. Ele trabalho com os níveis de fibo na media de 200 são 9 níveis onde você pode operar nas reversões o mercado partir do níveis abaixo. Level 1 = 550 pontos Level 2 = 890 pontos Level 3 = 1440 pontos Level 4 = 2330 pontos Level 5 = 3770 pontos Level 7 = 9870 pontos Level 8 = 15970 pontos Level 9 = 25840 pontos Level 6 = 6100 pontos
FREE
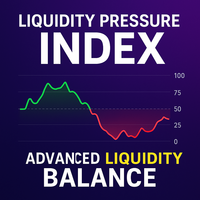
Liquidity Pressure Index (LPI) is an advanced technical indicator designed to uncover the hidden battle between buyers and sellers in the market. Unlike conventional oscillators that only rely on price movements, LPI integrates market depth (order book data), ATR-based volatility compression, and adaptive smoothing to give traders a deeper view of true liquidity dynamics.
By combining price action with volume absorption and order flow pressure, the LPI helps traders anticipate shifts in market
FREE

El **Heiken Ashi Smoothed** es una versión suavizada del indicador técnico Heiken Ashi, que se utiliza en el análisis de gráficos de velas para identificar tendencias del mercado y pronosticar movimientos de precios. Este indicador se basa en el promedio de datos de precios para formar un gráfico de velas que ayuda a los traders a filtrar el ruido del mercado.
**¿Para qué sirve?** Este indicador se utiliza para identificar cuándo los traders deben permanecer en una operación y cuándo está por
FREE

SmartAlgo Candle Timer is a simple MetaTrader 5 indicator that displays the remaining time until the current candle closes directly on the chart. The timer updates every second and calculates the remaining time using the current chart symbol and timeframe. The displayed countdown helps traders keep track of the current candle's remaining duration without needing to monitor the platform clock separately. Main Functions The indicator displays a live countdown for the current candle. The remaining
FREE

ADR Target Zones — Indicator Description Brief Description ADR Target Zones is a MetaTrader 5 indicator that displays target zones of probable price movement based on the Average Daily Range (ADR) and Average Weekly Range (WADR). The zones are built symmetrically above and below a base price, helping traders identify potential areas of price completion within a day and a week. How It Works The indicator calculates the average High − Low range over a specified number of periods: ADR — Average Dai
FREE

Descrição do Produto O CM Ultimate MA MTF V2 é um indicador técnico de média móvel dupla altamente otimizado, desenvolvido nativamente para o MetaTrader 5. Exibe duas médias móveis independentes (curto e longo prazo) num único gráfico, apresentando uma visualização adaptativa de tendências em 3 cores para acompanhar instantaneamente as mudanças de momentum do mercado.
Ao utilizar a tecnologia Multi-Timeframe (MTF) de alto desempenho, este indicador fornece aos traders uma direção de tendência
FREE

Session Breakout & Range Indicator
Overview A lightweight, clean utility indicator designed to plot the high and low of the Asian trading session while clearly dividing the Asian, London, and New York sessions on your MetaTrader 5 charts. Ideal for session breakout strategies, ICT concepts, and liquidity sweeps.
Key Features
Asian Session Range Box: Automatically calculates and highlights the exact High and Low formed during the Asian session.
Session Separators: Distinct visual dividers ma
FREE

Candle Timer V5 Nunca mais perca o fechamento de uma vela. Candle Timer V5 é um painel premium de contagem regressiva multi-timeframe para MetaTrader 5 que mostra exatamente quanto tempo falta para o fechamento da vela atual em todos os períodos que você utiliza, tudo em um único painel elegante e sempre visível. Desenvolvido para scalpers, traders intraday e analistas multi-timeframe que precisam de precisão de segundos sem trocar constantemente de gráfico ou período. Principais recursos Contag
FREE

SuperPanel Multitime Overview SuperPanel Multitime is a high-performance, clean, and non-intrusive Multi-Timeframe (MTF) Dashboard indicator designed specifically for professional MetaTrader 5 traders. It provides an instant, real-time overview of market trend health and volume data directly on your main chart—completely eliminating chart clutter and complex, lagging signal lines. Key Features Multi-Timeframe Analysis: Monitor trends seamlessly across multiple timeframes (from M1 up to D1) at a
FREE

Super Trend Forex PRO is an advanced algorithmic analysis system for MetaTrader 5 designed to provide an immediate and simultaneous view of market direction across multiple pairs and timeframes. This dashboard transforms complex market data into an intuitive visual interface allowing traders to identify moments of perfect market convergence at a glance. The core of the system is the Convergence Protocol which identifies rare moments when different temporal scales align in the same direction high
FREE
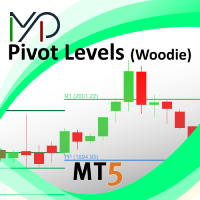
This indicator is stand alone version from MP Pivot Levels (All in one) containing Woodie Pivots. Woodie’s pivot points are made up of multiple key levels, calculated from past price points, in order to frame trades in a simplistic manner. The key levels include the ‘pivot’ itself, and multiple support and resistance levels (usually up to three each). Traders use these levels as a guide for future price movements when setting up trades.
The pivot : (Previous high + previous low + 2 x previous
FREE

Session Bias This Strategy of bias useful for those who follow TRADESHARE on youtube. This script is designed by BokaroTraderFx for traders who want assistance in determining their session bias, particularly for those who trade within sessions typically represented by a single 4-hour candle. The method involves using price action to establish a daily bias, guiding decisions on whether to focus on buys, sells, or both. The analysis is based on the previous daily and 4-hour candle closes, fo
FREE

Donchian Master Pro upgrades the traditional Donchian Channel with powerful tools that help you spot big moves before they happen. It highlights trend direction, detects squeeze conditions where volatility is hiding, and alerts you when price breaks through the channel with a strength rating so you can act with confidence. What You Get Color-coded Donchian Channels showing whether the market is trending up or down. Squeeze Detection reveals periods of low volatility that often precede major brea
FREE

opnMAX Sysifus: Indicator Overview Traditional Volume Profile and TPO (Time Price Opportunity) indicators suffer from a fatal flaw: they rely on hundreds of heavy graphical objects that lag the MetaTrader 5 terminal, drain CPU resources, and interfere with Expert Advisor execution. opnMAX Sysifus is engineered to solve this. It is a razor-sharp, highly optimized structural mapper that dives into granular 1-minute tick data to reveal exactly where institutional liquidity is parked and where sudd
FREE

TREND FOLLOWING INDICATOR — FREE
A free Trend Following Indicator developed from my own Trend Following EA, designed for scalping and day trading.
FEATURES
• BUY & SELL trend-following signals
• TP & SL levels displayed on the chart
• Real-time signal notifications/alerts
• Approximately 3–4 signals per day under typical market conditions
• Multi-timeframe support
• Suitable for Forex, Gold and other supported instruments
• Beginner and experienced trader friendly
️ RECOMMENDED SETTING
FREE

Ratio X Trend Watcher – Advanced Trendline Breakout Indicator Learn More about Ratio X Systems:
Source code and compiled EA: Reasons why the .mq5 file changes everything. Integrated MQL5 message filters: How to protect professional operating systems without DLLs? How can you build your own expert advisor (EA) brand using white-label trading software? MQL5 programming methods with ChatGPT and Claude Code (no development knowledge required) You will have unlimited access to all source code (.mq5)
FREE

Topdown Trend Dashboard puts real top-down market analysis right on your chart, so you stop flipping between timeframes to figure out the bigger picture. It watches six timeframes at once — 4H, 1H, 30M, 15M, 5M and 1M — and shows you a live, color-coded trend call for each one in a compact panel. The trend calls come from five EMAs (25, 50, 100, 200 and 800), so you get a read on short-, medium- and long-term momentum that's quick to check but grounded in something real — no repainting, no laggy
FREE
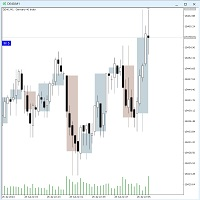
The Twotimeframe-Candles (RFrame) - Indicator for MT5 shows the candles of an higher, timeframe as an overlay on the current timeframe. You can choose the number of candles and color of the overlays. The indicator calculates the candle evevery tick. If you like the indicator, please left a comment. Version 1.1: The second time frame can now be set.
Keywords:
Candlestick, Multitimefram, Two Timeframes,
FREE
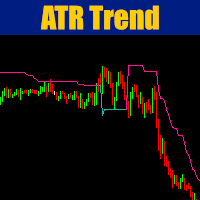
Cybertrade ATR Trend Zone - MT5 O indicador apresenta através do cálculo do ATR (Average True Range), a zona de provável resistência do preço. Indicado para ser utilizado como provável ponto de saída de uma operação.
Funciona em períodos maiores do que o período visível no gráfico. Todos os valores estão disponíveis em forma de buffers para simplificar possíveis automatizações. Este indicador é o mesmo que utilizamos em nosso EA. Confira também nossos demais produtos.
Buffers:
IATR Value b[0
FREE

NovaTac Fixed Volume Profile displays configurable volume-at-price profiles with POC, value area, nodes and closed-bar context alerts.
Overview
NovaTac Precision Volume Profile is an analytical chart indicator for MetaTrader 5. It organizes available volume across price rows and displays the areas where trading activity was concentrated within a selected range.
The indicator does not open, modify or close trades. It is intended to support chart analysis and discretionary decision-making.
Pr
FREE

Duchesne Candle Timer and Spread shows the time left before the current candle closes and keeps an eye on the spread.
Main features - Countdown next to the price, updated every second even without new ticks - Spread now, average and maximum over the last minutes (5 by default) - The spread line turns orange above your limit - Optional alert when the spread is above your limit, with a pause between two alerts - Panel corner, colors and font size to adjust
How it works The countdown uses the es
FREE

Introduction Poppsir is a trend-range indicator for metatrader 5 (for now), which distinguishes sideways phases from trend phases.
With this tool it is possible to design a trend following-, meanreversion-, as well as a breakout strategy.
This indicator does not repaint!
The signal of the Poppsir indicator is quite easy to determine. As soon as the RSI and Popsir change their respective color to gray, a breakout takes place or in other words, the sideways phase has ended.
Interpretation
FREE

MNFM Session Activity shows the indicative trading hours of the Sydney, Tokyo, London, and New York forex sessions. The timeline marks each opening and closing, highlights active sessions, and shows the current time in your computer’s local time zone by default. The Hourly Price Movement chart compares today’s completed hourly high–low ranges with the average for the same hours across up to 14 historical trading days. Values are in points for the chart symbol and depend on the broker’s available
FREE

O movimento de hoje é normal ou incomum para este mercado? O Daily Range Stats responde a partir do próprio histórico do símbolo: qual o tamanho habitual de um dia típico, de um dia grande e de um dia muito grande, qual a posição de hoje em relação aos dias passados e onde ficaria a máxima ou a mínima de hoje se hoje se tornasse um desses dias. Gratuito, claro e conferido com uma implementação separada. O que faz Uma pequena tabela no gráfico mostra o tamanho de um dia típico, de um dia grande (
FREE

Lab Risk Calculator answers the most important question before every trade: how many lots can I open without risking more than I planned? How it works Attach it to any chart. A red stop-loss line appears. Drag the line to where your stop will be. The panel instantly shows the exact lot size for your risk percentage. Features Works on forex, indices, metals, energies, stocks and CFDs (uses the symbol's real tick value). Detects long or short automatically: stop below price = long, above price = s
FREE

Finding Divergence RSI is a professional MetaTrader 5 indicator designed for automatic detection and visualization of classic and hidden divergences using the RSI indicator. The indicator works directly on the price chart, displaying arrows at divergence points and optionally drawing trend lines on both price and RSI charts. Divergence Types 1. Classic Divergences Classic Bullish : Price forms Lower Low (LL), RSI forms Higher Low (HL)
Signal: Trend reversal to upside Classic Bearish : Price fo
FREE

Description:
The Dynamic Color Stochastic is an enhanced version of the classic Stochastic Oscillator that provides instant visual feedback on market momentum through color-coded line transitions. Unlike the standard indicator, this version automatically changes the color of both the Main (%K) and Signal (%D) lines based on their relative positions. This allows traders to identify bullish and bearish crossovers instantly without squinting at the lines. Bullish Momentum (Green): When the Main
FREE

O que é o Cipher PRO? Não é um simples indicador de "setas". É um decodificador de mercado que identifica o DNA do Preço (força e volatilidade). Ele te entrega o "Norte" (contexto), para que você saiba onde o preço está e para onde ele tende a ir. Identificação Visual: Quadrado Ciano: Sinal de Compra . Indica que o DNA do preço mudou para alta com força real. Quadrado Pink/Magenta: Sinal de Venda . Indica que o DNA do preço mudou para baixa com força real. Linhas Azuis Pontilhadas: São o seu Nor
FREE

Never risk more than you plan to — down to the cent. (NOTE: IF YOU HAVE ANY COMMENTS AND SUGGESTION TO IMPROVE THE INDICATOR PLEASE LEAVE A REVIEW OR COMMENT) Gold Lot Size Calculator turns a single click-and-drag on your chart into the exact lot size for your trade. Set how much you're willing to risk in dollars, drag from your entry to your stop-loss level, and release — your position size is calculated and locked right on the chart. No spreadsheet, no calculator app, no mental math under pres
FREE

RBR Lot Calculator shows the lot size for a chosen risk directly on the chart. You drag the stop loss line, and the panel shows the lot, the money at risk and the loss per lot. It never sends, changes or closes an order. How it calculates The loss per lot is calculated from the contract specification of your terminal: contract size, profit currency, tick value rules and conversion to the account currency. The lot is rounded down to the volume step and never up, so the money at risk is never larg
FREE

iK Trendz Trading: The Ultimate Multi-Asset Trend Intelligence iK Trendz Trading is a professional-grade trend following indicator designed to provide traders with a crystal-clear view of market direction across multiple symbols and timeframes simultaneously. By combining advanced volatility-based logic with an intuitive Multi-Timeframe (MTF) dashboard, it eliminates the noise and identifies high-probability trading zones. Whether you are a scalper, day trader, or swing trader, this tool is desi
FREE

Todo crédito deste indicador é do Tiago Lacerda autor do video e quem disponibiliza o indicador GRATUITAMENTE Se inscrevam no canal dele https://www.youtube.com/channel/UCWGreIMXXE1k_7hzyRtduIw  ; segue a Pamm para investimento do Tiago https://www.mql5.com/pt/signals/881577?source=External%3Ahttps%3A%2F%2Fwww.youtube.com%2F
Túnel de Vegas, com até 20 níveis, permitindo plotar ou não cada nível com troca de cor, espessura das linhas e visualização ON/OFF para facilitar a utilização 100% g
FREE
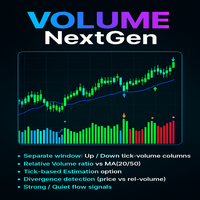
The Advanced Volume Flow Indicator is a free and practical tool who want to clearly see the balance between buying and selling pressure in the market. Instead of just showing total volume, this indicator separates volume into Up Volume (green bars) and Down Volume (red bars), making it easy to understand which side of the market is stronger at any moment.
The indicator also calculates a Relative Volume Line (blue), which shows whether the current trading activity is higher or lower than usual
FREE

Green Red Triple Overlap Candle by RWBTradeLab
Three candles of the same colour that go nowhere. A clean, non-repainting detector for MetaTrader 5 that finds the groups where one side keeps pushing and the other side keeps absorbing — and marks the exact band the group folded over. All from CLOSED candles only.
What This Indicator Does
The middle candle is the reference. Candle 1 and Candle 3 clamp its BODY from opposite ends, which is what stops the three of them from stepping away from eac
FREE

Risk Calculator Lines is a position size calculator for MetaTrader 5. Place the Entry line and the Stop Loss line where you plan to trade, and the panel shows the lot size for the percentage of your account you chose to risk. The indicator does not open, modify or close trades. It only calculates and displays. How to use Attach the indicator to a chart. Two horizontal lines appear: Entry and Stop Loss. Drag them to your planned entry price and stop loss price, then read the lot size from the pan
FREE
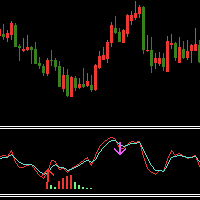
Indicator introduction: The indicator draws wave lines and histograms, It has small price lag, and the signal will not drift. The indicator can send emails, alerts and notifications to you when previous k line has an up arrow and it is under the histogram sections or it has a down arrow. you can choose whether or not to send the two kind of alerts, the alerts repetition times can also be changed. If the indicator appears red and green histograms, this is a buy zone. It can be used to analyze mar
FREE
DS RVOL: The Relative Volume Indicator for MT5 RVOL is a straightforward Relative Volume (RVOL) indicator for MetaTrader 5. It shows you how current volume compares to a historical average, providing a quick way to gauge the strength of a price move. How it Works Relative Volume is a simple ratio: R V O L = C u rre n t V o l u m e / A v er a g e H i s t or i c a l V o l u m e RVOL > 1.0 : Volume is higher than usual. This suggests there's strong interest and potential for a sustained move. RVOL
FREE
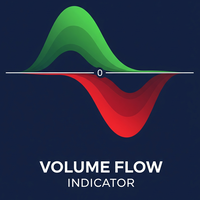
Volume Flow Indicator (VFI) - User Manual 1. General Introduction The Volume Flow Indicator (VFI) is an advanced technical oscillator designed to measure the strength and sustainability of a price trend by incorporating both price and volume data. Developed based on the concepts of On-Balance Volume (OBV) but with significant improvements, the VFI provides deeper insight into money flow and the conviction behind price movements. This indicator is not an automated trading system but a powerful an
FREE

Operar nos mercados globais (como Forex, Índices e Commodities) exige atenção máxima ao tempo. No entanto, o MetaTrader 5 exibe nativamente apenas o horário do servidor da sua corretora, forçando o trader a fazer cálculos mentais constantes para saber a hora exata em seu próprio computador. O Pinpoint Local Time resolve esse problema de forma elegante e integrada. Ele adiciona uma escala de tempo (régua) secundária e ultra-compacta na parte inferior do seu gráfico, que roda de forma síncrona com
FREE
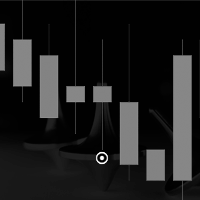
Indicador de pião real
Ele detecta o pião preciso no gráfico com corpo equilibrado e proporção de altura do pavio, que é o verdadeiro significado do pião, que o difere de Hammers e Doji ou Null Candlestick.
Este indicador traça um ícone de asas no número de piões encontrados no gráfico.
As configurações incluem
Número de compassos: Para ajustar a pesquisa no número de compassos
Cor do ícone: mude a cor do ícone
Código do ícone: altere o código de wingdings para o ícone
FREE

Meridia Sessions é a edição essencial do Meridia Session Suite. Desenha as velas H1 em qualquer timeframe inferior, com uma contagem regressiva até o fechamento da vela H1 atual, e as sessões de Ásia, Londres e Nova York como caixas com máxima e mínima. Sessões que acompanham cada mudança de hora Cada sessão tem o seu fuso horário (Europa central, Londres, Nova York, Tóquio, Sydney, UTC ou horário do servidor) e o horário de verão é aplicado sozinho todos os anos, então as caixas ficam no lugar
FREE
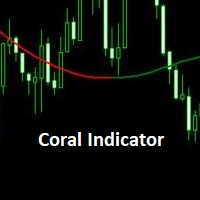
Coral trend is a trend-following indicator that is widely popular among FOREX traders . It is usually used as a confluence with other indicators. It uses combinations of moving averages with complex smoothing formulas! It has two configurable parameters: Coefficient - smoothing ratio (*)
Applied price Calculation: Coral = (-0.064) * B6 + 0.672 * B5 - 2.352 * B4 + 2.744 * B3
FREE

Pure SMC is a professional Smart Money Concepts (SMC) based trading indicator designed to help traders analyze institutional market behavior, liquidity movements, and price structure directly on the MetaTrader 5 platform. The indicator focuses on real market structure analysis instead of traditional lagging signals. It helps traders identify important institutional areas such as Break of Structure (BOS), Change of Character (CHoCH), Order Blocks, Fair Value Gaps (FVG), and Liquidity Zones. Main
FREE

<h2>Candles Size Stats</h2><p><strong>Candles Size Stats</strong> é um indicador leve e poderoso que mede e visualiza o tamanho de cada vela (intervalo High − Low) em pips, fornecendo uma imagem estatística instantânea da volatilidade do preço em qualquer símbolo e período de tempo.</p><h3>O que faz</h3><p>O indicador exibe o intervalo completo de cada vela como um histograma colorido em uma janela separada. As barras são verdes quando a vela atual é maior que a anterior e verde escuro quando é
FREE

Block Price คือ Indicator ที่ตีเส้นบนกราฟทุกๆราคาที่ผู้ใช้กำหนด โดยผู้ใช้จะต้องกำหนดกรอบราคาที่ต้องการตีเส้นในตัวแปร High Price - Low Price หากผู้ใช้ต้องการตีเส้นทุกๆ 2500 จุด XAUUSD เมื่อกำหนดค่านี้ในตัวเเปร Distance Block (Point) ระบบจะตีเส้นทุก 2500 จุดภายในกรอบราคา High Price - Low Price
หากผู้ใช้ต้องการทดราคากราฟที่ติดตั้งเครื่องมือให้ตรงกับราคาฟิวเจอร์ ผู้ใช้สามารถกำหนดค่าในตัวแปร Basis(USD) เพื่อให้ระบบตีเส้นตรงกับราคาฟิวเจอร์โดยต้องระบบค่าความต่างของราคาให้ตรงเช่นหากราคา ทองคำ Futur
FREE

Título: Painel de controle da linha do tempo da sessão global Descrição: O Global Session Timeline é um indicador interativo que exibe de forma intuitiva os horários de abertura e fechamento dos principais mercados de câmbio (Sydney, Tóquio, Londres, Nova York) em um gráfico. Proporciona um ambiente essencial para os traders que aproveitam a liquidez e a volatilidade que ocorrem durante as sobreposições de sessões, permitindo uma compreensão imediata dos mercados atualmente abertos por meio
FREE
The Sessions and Bar Time indicator is a professional utility tool designed to enhance your trading awareness and timing precision on any chart. It combines two key features every trader needs — market session visualization and real-time bar countdown — in one clean, efficient display. Key Features: Candle Countdown Timer – Shows the remaining time before the current candle closes, helping you anticipate new bar formations. Market Session Display – Automatically highlights the four main trading
FREE

MA Valuation Fluctuations measures how far the current price stands from its moving average. The deviation is expressed in units of dispersion and then compressed by a hyperbolic tangent into a fixed range from -1.0 to +1.0. The indicator is drawn in a separate window and can be used as a context filter next to a trend following or a mean reversion approach. What the indicator shows For every bar the indicator compares the selected price with a moving average in logarithmic terms. Because the r
FREE

Rainbow Volume Profile A simple, lightweight volume profile indicator that visualizes price-range volume with color-coded POCs (Points of Control). Overview RainbowVolumeProfile04Simple.mq5 calculates and displays a price–by–volume (Volume Profile) over a user-specified number of bars. The indicator automatically detects the top 5 volume concentration levels (POCs) and draws a colorful horizontal histogram at the right side of the chart. The computation is lightweight and updates in real time. K
FREE

Swing Points Pro v2 – Enhanced Highs and Lows Indicator with Push Notifications Overview :
The Swing Points Pro v2 indicator is a powerful and reliable tool designed to help traders identify critical swing highs and lows on their charts. Whether you trade Forex, Stocks, or Crypto, this updated version provides advanced features to enhance your market analysis, with real-time push notifications for key market movements. Key Features : Accurate Swing Identification : Pinpoints major swing highs a
FREE
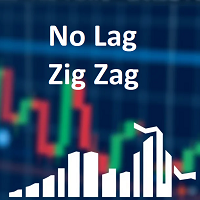
Classic ZigZag formula. But no lags and repaints. You can see on screenshots that it shows values between peaks and it is useful to test strategies based on indicator. Because sometimes people find a good idea about it but don't understand that repainting indicators have some things to keep in mind. The parameters are the same as original ZigZag indicator: Depth, Deviation and Backstep. Useful for visual analyze of the chart and cut strategies based on repainting peaks.
FREE
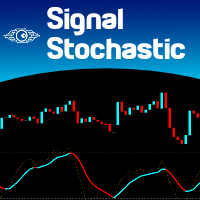
It is the very same classic Stochastic indicator, but with a little twist: we changed the Signal Line with a 2-color line, so we can use it with EAs as a filtering system. And that's it! I know it could seem stupid but I needed that, so I created it. The original formula is right from Metaquote's chest, no additions, no subtractions, it is Stochastics in its core.
So I will not publish here the Stochastics parameters as they are all the same as always... Enjoy!
If you like this indicator, all I
FREE

GRÁTIS — o canal de rompimento de Donchian, um filtro de tendência SMA e o trailing stop por ATR que gerencia a operação, reunidos em um só. Ajustado para as principais criptomoedas (BTC, ETH).
100% grátis, sem limitações. Se conquistar um lugar nos seus gráficos, uma breve avaliação é o que mais nos ajuda — leva 30 segundos e é o que permite que outros traders encontrem esta ferramenta.
Plataforma: MetaTrader 5 (esta página).
As criptos se movem em tendências longas e limpas e depois oscilam
FREE
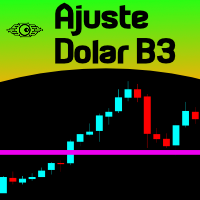
This indicator is EXCLUSIVELY to be used on the Brazilian stock exchange "B3". It automatically calculates the yesterday's Settlement Price (Ajuste) of the Symbol "DOL". It uses a mathematical calculation over the ticks received from the borker server, it DOES NOT access external sources (websites, HTTP connections, etc) so it is safe and totally reliable! For practical purposes and to maintain the longevity of the indicator it was added in the Parameters the ability to control the Time Range in
FREE

Introduction to Fractal Moving Average Fractal Moving Average indicator was designed as part of Fractal Pattern Scanner. Inside Fractal Pattern Scanner, Fractal Moving Average Indicator was implemented as multiple of chart objects. With over thousands of chart object, we find that it was not the best and efficient ways to operate the indicator. It was computationally too heavy for the indicator. Hence, we decide to implement the indicator version of Fractal Moving Average indicator to benefit ou
FREE

How to Read SUPERWAVE SUPERWAVE is designed to make the current trend state easy to understand at a glance. During bullish conditions: The adaptive trend line is displayed in blue The line follows underneath price The dashboard shows a bullish market bias A BUY signal is displayed when the detected trend changes into bullish conditions During bearish conditions: The adaptive trend line is displayed in red The line follows above price The dashboard shows a bearish market bias A SELL signal is dis
FREE

The MTF MACD .mq5 indicator is a custom technical indicator designed for the MetaTrader 5 (MT5) platform . It is a Multi-Timeframe (MTF) implementation of the standard MACD (Moving Average Convergence Divergence) indicator . With the MTF capability, you can view MACD signals from a higher timeframe (e.g., H1 or D1) directly on your active chart timeframe (e.g., M5 or M15) without switching chart views . Visual Display & Features Separate Window : Displays in an indicator window below the main p
FREE

O indicador mostra uma tendência e metas para a situação atual todos os dias. O indicador também reduz o número de acordos de produção de perdas, para contar a definição certa das condições de mercado. Desenhado para análise e comércio dentro do dia.
Como usar:
A linha azul mostra o preço de abertura do dia, que está estabelecido numa fórmula especial de 4 linhas que estabelece metas para o dia. Você pode olhar e abrir acordos para a tendência.
A linha cinzenta é o primeiro golo. Quando são a
FREE

In which direction should I trade today? For “TREND followers”, we need to determine the TREND . This indicator determines the Trend based on the price High, Low and Close of every bar, for a given period and timeframe. Calculating and plotting the Trend UP and Trend DOWN lines. If the: “Trend UP” line (Green) is above the “Trend DOWN” line (Red), then it is a BULLISH Trend (see "Screenshots" tab). “Trend DOWN” line (Red) is above the “Trend UP” line (Green), then it is a BEARISH Trend (see "
FREE
Multitimeframe Viewer HiddenEdge – HTF Realtime MiniChart A clear view of higher-timeframe structure — directly inside your main chart.
No need to switch timeframes anymore. HiddenEdge Multitimeframe Viewer shows the last candles of any higher timeframe in a compact, real-time panel — so you can see the bigger picture while staying focused on execution. Key Features Realtime update: the current higher-timeframe candle is drawn live, updating every second. Select how many candles to display:
FREE
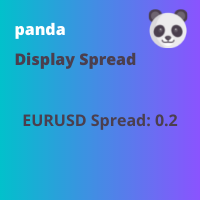
This indicator displays the spread Simple and easy to use and fully customisable: View as Pips or Pipettes Chart symbol can be hidden Text display can be changed Change color and text styles Add or hide a decimal point Spacing options between inputs Default screen positions Screen position inputs
How to use 1. Simply use the default settings; or 2. Choose to show pips or pipettes; 3. Choose to display symbol, text or decimal; 4. Choose where to place it on the screen; 5. Save settings or save
FREE

This is an OLD indicator which was rather efficient to be paired with MA Cross, Bollinger Bands, Dochian Channel and many other strategies and this provides you with market change of BEAR and BULL trends. Since there isn't much listed in MT5 Market, I would like to share my very own indicator for your usage. Please feel free to comment or criticize for better and improvement of the indicator listed.
FREE
This variant of the ZigZag indicator is recalculated at each tick only at the bars that were not calculated yet and, therefore, it does not overload CPU at all which is different from the standard indicator. Besides, in this indicator drawing of a line is executed exactly in ZIGZAG style and, therefore, the indicator correctly and simultaneously displays two of its extreme points (High and Low) at the same bar!
Depth is a minimum number of bars without the second max
FREE

RBM ATR PRO v1.10 Quem opera mercado volátil sabe como é ruim tomar stop por causa de uma violinada de pavio e ver o preço andar forte a favor logo depois. O RBM ATR PRO foi desenvolvido exatamente para resolver isso. Ele evolui o indicador clássico de volatilidade combinando a leitura do ATR com dois níveis independentes de suavização. A linha no gráfico fica limpa e objetiva: verde para estrutura de alta e vermelha quando o mercado vira para a baixa. Funciona perfeitamente para rastrear a ten
FREE

For Nasdaq trading, the most important principle is to know the trend of the fund.
This indicator with 6 green and red lights provides you with the daily path of this important indicator.
This indicator has been tested for 6 months and has a win rate of over 85%.
Be sure to contact me before purchasing to get the necessary instructions on how to use and set up this indicator.
You should use a broker that has dollar index, vix, and commodities. MT4 Version
You can contact us via Instagram, Teleg
FREE

Squeeze Momentum Pro — Volatility Compression and Momentum Indicator Squeeze Momentum Pro is a versatile MetaTrader 5 indicator designed to identify periods of market compression and the momentum that may follow. It compares two different views of market volatility to detect when price movement becomes unusually tight. These compression phases often indicate that energy is building before a larger market move. When the compression ends, the indicator helps traders observe whether momentum is de
FREE
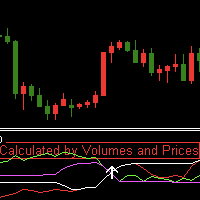
Indicator introduction:
The indicator is calculated by volumes and prices, It is a single side indicator, only has up arrow signals. It is better to use it in conjunction with other trend indicators, and you need to find the most efficient time to use it in order to acquire a high winning probability. The indicator can send emails, alerts and notifications to you when the indicator before k line has an up arrow. The indicator's parameters can be changed, including the computation period of the
FREE

SimpleMACD is a clean, configurable MACD indicator for MetaTrader 5. It computes the classic three-component output — main line, signal line, and histogram — using a transparent EMA implementation with an SMA seed that matches the standard MetaTrader behavior. Why traders use SimpleMACD SimpleMACD gives you a straightforward MACD with no hidden modifications. All EMA periods and the applied price are configurable, so you can match any published MACD setup exactly. The histogram color flips autom
FREE

Sierra Capital Session Sweep Scanner maps out the Asian, London, and New York trading sessions directly on your chart, then watches for a specific price-action pattern: a candle that spikes through the Asian session's high or low and closes back inside it — a classic liquidity sweep. What it shows: Colour-coded boxes marking the Asian, London, and NY session ranges, with the Asian high/low projected forward as reference lines Arrows marking each qualifying sweep-and-reject candle, with projected
FREE
O Mercado MetaTrader é o melhor lugar para vender robôs de negociação e indicadores técnicos.
Você apenas precisa desenvolver um aplicativo para a plataforma MetaTrader com um design atraente e uma boa descrição. Nós vamos explicar como publicar o seu produto no Mercado e oferecer a milhões de usuários MetaTrader.

Você está perdendo oportunidades de negociação:
- Aplicativos de negociação gratuitos
- 8 000+ sinais para cópia
- Notícias econômicas para análise dos mercados financeiros
Registro
Login
Você concorda com a política do site e com os termos de uso
Se você não tem uma conta, por favor registre-se