 MetaTrader 5
 Experts
 Indicadores
 Bibliotecas
 Utilitários
 Widgets
 Regras
Conheça o Mercado MQL5 no YouTube, assista aos vídeos tutoriais
Como comprar um robô de negociação ou indicador?
Execute seu EA na
hospedagem virtual
hospedagem virtual
Teste indicadores/robôs de negociação antes de comprá-los
Quer ganhar dinheiro no Mercado?
Como apresentar um produto para o consumidor final?
Expert Advisors e Indicadores para MetaTrader 4 - 348
 Os robôs de negociação irão ajudá-lo a fazer transações nos mercados automaticamente, por outro lado, graças aos indicadores você poderá analisar melhor as cotações e prever seu comportamento.
Com ajuda desses aplicativos, você poderá realizar transações no MetaTrader 4 de forma mais informada e melhorar seu potencial.
Os robôs de negociação irão ajudá-lo a fazer transações nos mercados automaticamente, por outro lado, graças aos indicadores você poderá analisar melhor as cotações e prever seu comportamento.
Com ajuda desses aplicativos, você poderá realizar transações no MetaTrader 4 de forma mais informada e melhorar seu potencial. 
The library is dedicated to help manage your trades, calculate lot, trailing, partial close and other functions
Orders CloseallSell CloseallBuy CloseallOpen DeletePending DeleteAll: Close All Market Orders and delete all pending orders. CheckOpenBuyOrders: return the count of buy orders. CheckOpenSellOrders: return the count of sell orders. CheckOpenOrders: return the count of market orders. ModifyOrder DeleteOrder CloseOrder OpenOrder
Lot Calculation Mode 0: Fixed Lot. Mode 1: Martingale Lot

This indicator is based on Market Profile methodology, which contains the Z-Zone , unlike the latter, allows visualization of multiple time frames on the same graph. This methodology has proven to be very effective for: Reduce the number of windows required to analyze or track a financial asset. Display important resistance areas (ROZ), support (SoZ) and average distribution (PoC) in different periods of time. Define areas to take profits as well locate technical stop loss. Analysis in the devel

The Navigator is a next-generation panel very easy to use. Apply this indicator on the chart to navigate very quickly through all the symbol and timeframes listed in input. The arrows manage the zoom and time frames. You can customize both the graphic colors and the list of symbols to display. A quick and easy tool that it will help to analyse the charts.
Input Values Show_TF_Panel (true/false) it permits to show/hide panel with TF and Arrows
32 symbols COLORS AND SIZE SETTINGS BUTTON_WIDTH But

The Illusion EA uses the probability theory - after a series of consecutive virtual losses - i.e. right during a flat the EA already starts trading in the trend. In addition, the EA considers the ratio of bullish/bearish candles on the higher timeframes to determine the greatest probability of the price movement direction. Only 1 order can be opened at a time. In case of a loss the following order will be placed with an increased lot (the multiplication coefficient is set in the parameters). The

Pipfinite creates unique, high quality and affordable trading tools. Our tools may or may not work for you, so we strongly suggest to try the Demo Version for MT4 first. Please test the indicator prior to purchasing to determine if it works for you. We want your good reviews, so hurry up and test it for free...we hope you will find it useful.
Combo Channel Flow with Strength Meter Strategy: Increase probability by confirming signals with strength Watch Video: (Click Here)
Features Detects chan
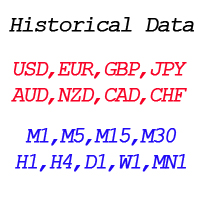
By applying this expert onto any char window, you are able to force download the historical data upon all time-frame (PERIOD_M1, PERIOD_M5, PERIOD_M15, PERIOD_M30, PERIOD_H1, PERIOD_H4, PERIOD_D1, PERIOD_W1, PERIOD_MN1) of 28 major pairs. The 28 major pairs are the combination of the 8 major currencies.
8 major currencies "USD", "EUR", "GBP", "JPY", "AUD", "NZD", "CAD", "CHF"
28 pairs "AUDCAD","AUDCHF","AUDJPY","AUDNZD","AUDUSD","CADCHF","CADJPY" "CHFJPY","EURAUD","EURCAD","EURCHF","EURGBP","E
FREE

The EA detects strong movements using the Parabolic indicator and opens a trade. The Commodity Channel Index (CCI) is used as an auxiliary indicator. The CCI levels may depend on the ADX indicator values, which allows for better trading with different volatility. Also, the trades are opened depending on the RSI indicator values on a certain timeframe. Recommended timeframes: M5, M15, M30. Make sure to optimize the parameters of the EA for your account before trading.
Input Parameters Lots - lot

A simplistic indicator informing a user on RSI divergence by sending messages to mobile device and email. The indicator draws 2 vertical lines, marking two RSI extrema that formed the divergence. You get the alert, open the charts and make a decision. The indicator does not show past divergences, thus when you attach it to a chart for the first time you see nothing. Graphics and alerts will appear as soon as divergences do. Drop it in Tester to see how it works. Parameters: RSIPeriod - number of

Taranus is a multifunctional EA, a universal assistant to a trader, designed to work under the control of a trader. The EA has a large set of tools and can work: by indicators, by trading levels, by trend lines, by martingale strategy, trade on news. It has: several filters to determine the trend, a multi-level risk management system, money management, virtual stop loss, universal trailing stop, can work with any type of orders. Set files and a guide to the Taranus EA can be found in the "Commen
Automatic lot calculation per stop level: calculates the lot considering the risk. It is possible to enter a percentage of the deposit and set the line to the planned stop level. As a result, the lot for entry will be calculated. Also, the TakeProfit level will be calculated taking into account the profit/loss ratio, and their profit/loss in the deposit currency. Thus, the final result of the trade can be seen, which is an integral part of successful trading.
Features The indicator displays the
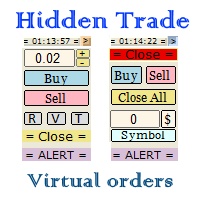
Small trading panel for managing orders and positions in 1 click for MetaTrader 4 Version for MetaTrader 5 here Set hidden TakeProfit, StopLoss and pending orders at lines placed on the chart Work on time on the news Backtesting manual strategies in the tester Placing virtual orders Playing a sound signal when the price reaches a level Automatic closing of all positions on the account or symbol by the total take profit in the deposit currency
Description Can be dragged to any part of the chart
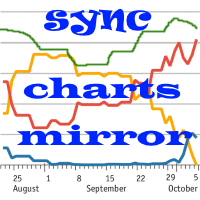
O indicador de correlação e divergência de pares de moedas - todos os pares na mesma tabela de preços. Exibe todos os pares que estão abertos no terminal.
Versão MT5
Vantagens Os negociantes que usam estratégias de negociação em várias moedas podem observar visualmente o movimento dos preços de pares selecionados no mesmo gráfico de preços, a fim de comparar os parâmetros de seus movimentos. Esta é uma versão avançada e estendida do indicador OverLay Chart
É um assistente bastante eficaz p

The CCI FIBO trend indicator displays the real sentiment of the market. Does not redraw. The CCI FIBO indicator is based on the processed values of the standard CCI indicator. The indicator is able to display the slowing\reversal of the price during the trend movement (for exiting the position, and with some experience to display the opening in the opposite direction, for example, to use in scalping). It shows spikes in a flat. The idea of the indicator was that there are indicators that are goo
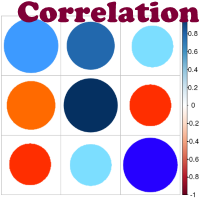
Advantage The analyzer provides an opportunity to examine correlation in history, for example, for the previous month excluding the current one, thus allowing you to evaluate symbol movement in history. It can be conveniently used in conjunction with LineSyncMirrorChart analyzer. Charts are synchronized by a market type: Forex, CFD, Futures, and Indices. The analyzer calculates the distance covered by the price on a specified period in points. The tool fits pairs and portfolio traders.
Descript
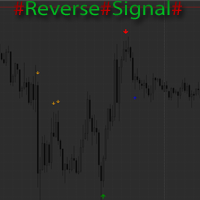
The indicator marks the estimated market reversals in the form of arrows. The indicator is able to detect 3 types of reversals. The primary reversal signal. It is a stronger and more important reversal. Denoted by the largest arrow. Alternative signal - additional signal without additional filters in contrast to the primary. Suitable for scalping on small timeframes. A mixture of the primary and alternate reversals, but with the addition of the trend filter. Also shows good results on small time

CIS is designed for trading a basket of correlating currencies, as well as single instruments: indicators
VSA indicator which draws arrows (does not redraw). Its signals indicate the price reversal on a calm market or decrease of the rise or fall rate during strong movements. Works fine in the flats. As the indicator uses volumes in its calculations, be careful during evenings and night times, when there are very small volumes. It is recommended to be used only on multiple currencies or at lea
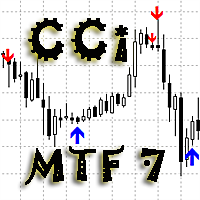
As the proper trading using CCI indicators requires the trader to monitor multiple timeframes and CCI indicators with different periods. For example - monitor the trend using CCI with the period of 100 or 200 ( slow CCI period ) on the H4 timeframe, and make entries based on the CCI with the period of 13 ( fast CCI period ) on the H1 timeframe. To facilitate this task, the Delta CCi MTF7 indicator was created, which implements monitoring the changes of the price movement trends as well as marks

The Z-Zone is part of a suite of four indicators called the Z-Tools Black you can buy separately in the MetaTrader Market. The Z-Zone is based on the Market Profile and includes three dynamic lines: At the top is the resistance of zone (that we´ll identify as RoZ ) In the center we find the average distribution of the area (that we´ll identify as PoC ) At the bottom is the support of zone (that we´ll identify as SoZ ) Together they make up what we call the value zone, meaning that the market mo
The Five Minutes indicator is a ready TRADING SYSTEM for binary options. The system is designed specifically for the EURUSD M5 currency market with at least 80% payout and for trades who operate on the web-terminals and the MetaTrader 4 platform. This is a counter-trend system, i.e. it expects the price of traded asset to reverse. Signals of the system are not redrawn, they appear once the formation of the previous bar is completed, and are equipped with a sound notification. For decision-making

The Z-Compass is part of a suite of four indicators called the Z-Tools Black you can buy separately in the MetaTrader Market. The Z-Compass is one of the most important indicators, because it serves as a compass in the market and is composed of the following elements A histogram and zero line. The histogram is plotted with each candle and changes depending on the selected time frame. When the histogram is above the zero line, we say the trend or momentum is bullish and when it is below the zero

The Z-Beat Zone is part of a suite of four indicators called the Z-Tools Black you can buy separately in the MetaTrader Market. The Z-Beat Zone is displayed as two lines. The main line is called SlowK. The second line, called SlowD. The SlowK line is a solid gross line and the SlowD line is a solid slim line. There are several ways to interpret a Z-Beat Zone. Three popular methods include: Buy when the Z-Beta Zone (The SlowK line) falls below of the level (e.g., -40) and then rises above that le
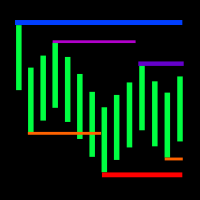
The indicator displays the fractal levels of one,two or three different higher timeframes starting with the current one. When a new fractal appears, a new level is plotted. The indicator can be used for visual analysis of the current chart and applied in an EA. If more levels are needed, start a new instance of the indicator.
Features Timeframes to choose from. For example: M1, M2, M3, M20, H2, H3, H12. If a timeframe smaller than the current one is selected in the settings, the level of the cu

It is good to know the presence of a trend on multiple timeframes at once. And even better - on multiple currency pairs at once. This indicator allows to quickly determine the presence of a trend or a flat on 8 timeframes and from 1 to 15 currency pairs at once. Multi Alligator Signals analyzes the signals of the Alligator indicator by Bill Williams on every timeframe (from M1 to W1) and multiple currency pairs (up to 15) simultaneously. If there is a buy signal, a green upward arrow is drawn, i

Two Dragon is an advanced indicator for identifying trends, which uses complex mathematical algorithms. It works in any timeframe and symbol. Indicator is designed with the possibility to customize all the parameters according to your requirements. Any feature can be enabled or disabled. When a Buy / Sell trend changes the indicator will notify using notification: Alert, Sound signal, Email, Push. МetaТrader 5 version: https://www.mql5.com/en/market/product/14906 Parameters Max_Bars_History —
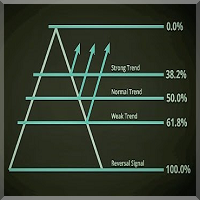
Introdução O indicador Fibonacci Level Professional é uma ótima ferramenta para a negociação do dia-a-dia como um complemento a outros indicadores para uma melhor confirmação das configurações de negociação e para onde o mercado tende a se mover. Este indicador é fácil de configurar e funciona em todos os pares de moedas e intervalos de tempo. M15-W1 é recomendado.
O objetivo deste indicador é mostrar os níveis de Fibonacci no gráfico, as linhas diárias, superior e inferior. Como uma função ad

Advanced and affordable momentum indicator that fade the fake move of market. It is smoothed because of special sophisticated exponential averaging calculation. It is also similar to special type of CCI with more tolerance to overbought or oversold conditions with built-in momentum indication. This indicator is able to empower your trading as a trend detector, CCI and market momentum scale measurement.
Features Smoothed to filter uncomfortable noises. Non-Lagging Exponential averaging. Line or
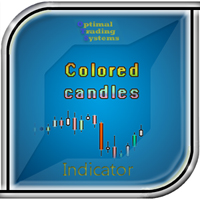
Some candles have a strong tendency to continue the movement or to revert it. With the help of the Colored candles indicator such movements are clearly visible. This indicator calculates the parameters of each candle, as well as its volume, and after that it paints the candles depending on its strength and direction. Bullish candles are colored green and bearish candles - red. The greater the power of the bulls or the bears, the brighter the color. You can change the colors if you want. The indi

Some experienced trades can tell where the price will go even without indicators, as the direction of the price can be found using the ordinary candlesticks. The EA compares several nearest bars and their volumes, and opens a trade based on that data. Also, it is able to analyze the candles on two timeframes at the same time to make the entry more accurate and less risky. In addition, the EA can automatically determine the take profit and stop loss size depending on the size of the previous cand
This innovative technical indicator was created to detect quiet market period before the beginning of the high volatile market. Like many good technical indicators, this Market Activity Index is very stable and it is widely applicable to many financial and non financial instruments without too much restriction. The Market Activity Index can be used best to visualize the alternating form of low and high volatile market. It is very useful tool to pick up the quiet market but ironically this is the

Smart Advisor Calculation is designed for a very interesting method that is able finally to give the martingale a new positive way! At startup the Expert Advisor sets virtual orders and trades like the real deal. As soon as the drawdown of virtual orders reaches the set number, the robot immediately enters the market for real orders! Thus the price is going without setbacks such as 30-70 pips, with great probability will kick back at the entrance to the market! This is used by a robot! If the pr
It is based on Surfing strategy. DOES NOT USE MARTINGALE. The EA catches the moments when the previous candle crosses the moving average indicator and eliminates the false breakouts using the RSI+MA indicator, and at the same time analyzes the trend direction. The EA trades pending orders, which also allows to avoid false movements. If the pending order was not triggered and the chart reversed, then the EA deletes the pending order. Also, according to the strategy, the EA uses the Trailing Stop,

Delta Pairs is an indicator for pair trading, it displays the divergence of two currency pairs. Does not redraw. A useful tool for the analysis of the behavior of two currency pairs relative to each other.
Purpose The Delta Pairs indicator is designed for determining the divergences in the movements of two currency pairs. This indicator is displayed as two line charts and the difference (delta) between these charts in the form of a histogram. The Delta Pairs indicator will be useful for those w
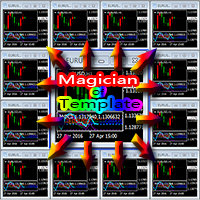
Everyone has their own style, for example, color of candle, color of chart blackground, used indicators, EAs, and script tools etc. If you often use a template to load your favorite style, you should already know that manual loading is cumbersome when using multiple charts. Now, you can use this tool to work better and faster. Magician Of Template (MOT) is a utility script tool for MetaTrader 4. After attaching the script to a chart, one template will auto load to all charts. The template should
With Symbol Switch you can easily change the symbol of all open charts without losing your analysis or template. Easily monitor many symbols with only one monitor. Auto save\load analysis separately for each symbol (including all graphical analysis and attached indicators). The indicator shows the symbols which are visible in your MT4 "Market Watch" window. To add\remove a symbol just add\remove it from MT4 "Market Watch" window. Monitoring all symbols profit with the panel. Works with all broke
The EA creates an order grid using labels. Opening and closing of the grid is done either automatically by the system signals or manually. In the same grid can be both Limit and Stop orders. It is possible to reverse the grid on specified condition. You can enter the breakdown/rebound from established levels. All types of Sell limit, Buy limit, Buy stop, Sell stop orders are supported. The grid is rebuilt with a single click. The stop loss and take profit lines can be easily modified You are fre

XMaya Scalp ZR Series is a fully automated Expert Advisor designed for Traders. XMaya Scalp ZR Series is a robot trader with multi-currency scalper Expert Advisor. This robot trades on any Time Frame, Can be use on all pairs but not for use on XAU/GOLD . The system is ready-to-use with the setup is simple, with simple optimization on Take Profit, Stop Loss, and Trailing.
User-Defined Variables OrderCmt - used for comments Magic - Magic Number to identify the order's mode for the EA. TargetProfi
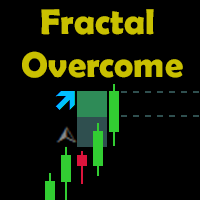
Indicator Description The indicator shows the breakout of the last fractal in real time. It considers the buy fractals above the balance line and sell fractals below the balance line (according to the Bill Williams' strategy), and also the fractals that are independent of the balance line. The direction and the distance of the fractal level breakout are displayed in real time. When a candle closes outside the suitable fractal, the levels of the specified offset, the distance to the candle closur

Master Trend Dashboard is a new generation indicator, compact, light and efficient. Each element of this Dashboard is designed to return specific signals as: Price Action, Breakout, Net Change (performance of the instrument), algorithmic studies, correlations and statistical calculations. This tool will change your way of trading allowing you to receive important information. See the Graphic Signals to understand every single signal below:
Graphic Signals Symbol name and arrow color Green = Cur
Volume Levels is a very important indicator for exchange trading. Most of the trades were performed on those levels. This indicator displays the price level that had the most trade volumes over a certain period of time. Often, the price bounces from those levels in the future, and it can be successfully used in trading. It works on any currency pair.
Parameters HistoryBars - the number of bars to determine the near volume levels; Range - the maximum distance above and below the current price to
The BOSS (Binary Option Super System) indicator is a ready TRADING SYSTEM for binary options. The system is designed specifically for the currency market and for the traders who operate on the web-terminals and the MetaTrader 4 platform. This is a counter-trend system, i.e. it is based on the assumption that the price of a traded asset revert sooner or later, and the final trade will cover the previously incurred losses and make a profit. Signals of the system are not redrawn, they appear once t
TMA Simplemartin Expert Advisor is based on TMA channel indicator, as well as Stochastic and CCI standard indicators. A market entry is performed according to indicators' aggregate signals using stop levels and trailing. A deposit is a part of the trading system. This is a martingale. Both arithmetic and geometric progressions are available. Besides, the EA features the function of recovery from a loss (TMA compiled into resources).
System settings averaging included – enable averaging. averagi
STOCH+RSI+CCI Expert Advisor is based on standard Stochastic, RSI, and CCI indicators. A market entry is performed according to indicators' aggregate signals using stop levels and trailing. A deposit is a part of the trading system. This is a martingale. Both arithmetic and geometric progressions are available. Besides, the EA features the function of recovery from a loss.
System settings averaging included – enable averaging.
averaging only on signal – average only by a signal.
averaging Type

Ultimatum Breakout - this trading system uses the strategy of valid breakouts, using multiple custom indicators for eliminating bad signals. The EA uses a very small SL so the account is always protected from equity drawdown with a very low risk-per-trade. The EA is fully adapted: calculates the spread — for pending orders, stop loss, trailing stop, breakeven. It was backtested and optimized using real ticks with 99,9% quality. It has successfully completed stress testing. No Martingale. No arbi

DS Arrow is a simple indicator for buying/selling in MetaTrader 4, This straightforward indicator shows the market entry points. Perfect for both beginners and professionals. Designed for working only with the H1 timeframe, the indicator will not be displayed on other timeframes. Recommended currency pairs: GBP-USD, EUR-USD, USD-CAD, AUD-USD, USD-JPY, NZD-USD. Works with both4-digit and 5-digit quotes. This indicator does not redraw its signals.
Features The entry is made when the hourly candle

This is a grid EA that trades on all timeframes, pairs and instruments. You are to desire where and how to use it. The EA uses a four level system for signal confirmation, which allows you to filter out false market entry signals. 3 indicators are used for trading. Having received a signal to enter the market, the EA opens a Market Execution order, which is closed by TP. The EA uses martingale, to reduce the risk it is possible to automatically decrease or increase of the martingale multiplier.
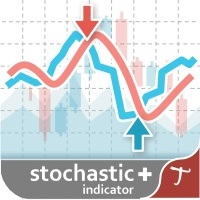
Tipu Stochastic is the modified version of the original Stochastic Oscillator published by MetaQuotes here .
Features Choose three types of signals (Reversals, Main Signal Cross, and Overbought/Oversold Cross). Customizable Buy/Sell alerts, push alerts, email alerts, and visual on-screen alerts. Marked overbought and oversold levels. Add Tipu Panel (found here ) and unlock the following additional features: An easy to use Panel that shows the trend + signal of the selected time frames. Show Sto
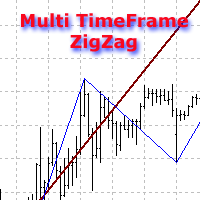
The indicator displays ZigZag lines from a higher timeframe (see the example in the screenshot). The red thin line is the current timeframe's ZigZag, while a thicker yellow line is the higher timeframe's one. The indicator is repainted as the data is updated.
Parameters
Depth, Dev, Back - ZigZag parameters; BarsCount - amount of processed bars (reduces the initial download time and decreases the load when using in an EA); TimeFrame - indicator timeframe (cannot be lower than the current one).

The indicator detects and displays 3 Drives harmonic pattern (see the screenshot). The pattern is plotted by the extreme values of the ZigZag indicator (included in the resources, no need to install). After detecting the pattern, the indicator notifies of that by a pop-up window, a mobile notification and an email. The indicator highlights the process of the pattern formation and not just the complete pattern. In the former case, it is displayed in the contour triangles. After the pattern is com
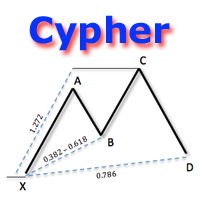
The indicator detects and displays Cypher harmonic pattern also known as Anti-Butterfly (see the screenshot). The pattern is plotted by the extreme values of the ZigZag indicator (included in the resources, no need to install). After detecting the pattern, the indicator notifies of that by a pop-up window, a mobile notification and an email. The indicator highlights the process of the pattern formation and not just the complete pattern. In the former case, it is displayed in the contour triangle

The indicator detects and displays Shark harmonic pattern (see the screenshot). The pattern is plotted by the extreme values of the ZigZag indicator (included in the resources, no need to install). After detecting the pattern, the indicator notifies of that by a pop-up window, a mobile notification and an email. The indicator highlights the process of the pattern formation and not just the complete pattern. In the former case, it is displayed in the contour triangles. After the pattern is comple

RSI Breakout Dashboard is a tool for multiple currency pairs analysis at the same time in terms of breakout (return) from Oversold or Overbought Zone to Neutral Zone.
All displayed and used by indicator symbols are free to choose and are specified using a space separated list in parameters, so you're able to analyze not only predetermined ones, but everything that your broker offers, also commodities, equities, indices, ones with prefixes, suffixes etc.
You can choose 3 types of aler

Found a great signal, but a provider's lot is too small? You need larger position volume, but terminal settings are too poor? SignalLotEnlarger will increase the provider's position volume by means of a duplicate order of the needed volume. Just set a lot size and a name of a signal for copying orders from. This is the version with extended functionality, the lite version can be found here: https://www.mql5.com/en/market/product/8117
With the Pro version you can:
disable copying new orders fro

The EA uses the strategy based on breakout. Breakout trading is one of the most popular and most frequently used strategies among Forex traders. This strategy has been developed a long ago and has been repeatedly tested on history data, showing superior results. The EA uses 3 types of trend breakouts, (support and resistance breakout, downtrend breakout, uptrend breakout). The EA uses a very small SL so the account is always protected from equity drawdown with a very low risk-per-trade. It uses
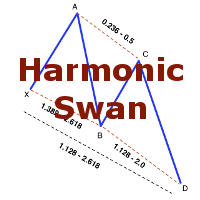
The indicator detects and displays the White Swan and Black Swan harmonic pattern on the chart according to the scheme provided in the screenshot. The pattern is plotted by the extreme values of the ZigZag indicator (included in the resources, does not require additional installation). After detecting the pattern, the indicator notifies of that by the pop-up window, a mobile notification and an email. The indicator highlights not only the complete figure, but also the time of its formation. Duri

Was: $99 Now: $49
Blahtech Daily Range indicator displays the average daily range alongside the individual session ranges. Using the daily open price as a reference the indicator shows fixed range and dynamic range targets as lines on the charts. These lines clearly show when the average range has been exhausted. Daily and session ranges can be useful for confirming entries or setting targets and is an excellent odds enhancer for many trading systems. Links [ Documentation | Install

The indicator detects and displays the AB=CD harmonic pattern on the chart according to the scheme provided in the screenshot. The pattern is plotted by the extreme values of the ZigZag indicator (included in the resources, does not require additional installation). After detecting the pattern, the indicator notifies of that by the pop-up window, a mobile notification and an email. The indicator highlights not only the complete figure, but also the time of its formation. During the formation the
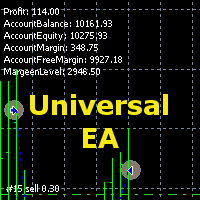
The Expert Advisor allows you to build a trading system based on a custom indicator. It performs automated opening/closing of deals based on the signals of an indicator that places values other than 0 and EMPTY_VALUE in the buffer. The EA polls the values of the specified indicator buffers, opens/closes and accompanies trades according to the specified parameters. The Expert Advisor implements the following trade support functions: - installation for the transaction SL and TP;
- calculation
Grid robot that maintains every open position opened by the trader. The buttons on the screen are used for opening the initial trade. The yellow labels display the price of total breakeven for each grid. The light blue labels display the level of total take profit for orders of each grid. The take profit is virtual. With each subsequent opened order the take profit of the grid is adjusted to get the total profit in the sum of the profit of the initial order, regardless of the size of all lots in

Be notified of every color change of Heiken Ashi (HA) candles. The indicator will trigger past and new signals every time that HA candles change their colors. Note : this tool is based on the code of Heiken Ashi indicator developed by MetaQuotes Software Corp.
Features The signals are triggered at closing of last bar/opening of a new bar; Any kind of alerts can be enabled: Dialog Box, Email message, SMS notifications for smartphones and tablets, and Sound alerts; By default, up arrows are plott
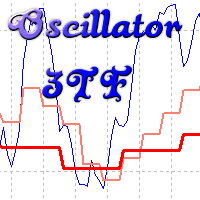
Oscillyator 3TF displays data on standard oscillators (RSI, MFI, STOCH, CCI, DeM, Momentum) on the current and two following timeframes. The modified version of Price Reversal oscillator is also added. The indicator allows you to track the situation on higher timeframes and select suitable entry points when oscillator lines are in oversold/overbought zones. The indicator may notify of all three lines located in specified zones via alerts, emails, and push notifications.
Parameters
Period – indi

High-speed trades duplicator, specially designed for copying trades with adjusted lot size and direction at same account. It can be aslo useful for subscribers of SIGNALS service. If you are a subscriber of trading signals then you can see that trading lot size could be different from signal provider to subscriber. Provider can use too big or too small lot size that can be inappropriate for your deposite amount (too risky). Another feature of this copier is a trading direction reverse. It can b

The indicator detects and displays the 5-0 harmonic pattern on the chart according to the scheme provided in the screenshot. The pattern is plotted by the extreme values of the ZigZag indicator (included in the resources, does not require additional installation). After detecting the pattern, the indicator notifies of that by the pop-up window, a mobile notification and an email. The indicator highlights not only the complete figure, but also the time of its formation. During the formation the f
The indicator calculation is based on the analysis of the price characteristics of bars and is adjusted by the ATR value. The degree of the ATR influence is determined by the ratio. The color scheme of the indicator depends on the direction of the current trend. A change in the trend is displayed by an arrow and a corresponding message. Depending on the strategy chosen by the trader, this indicator can be used to generate market entry signals, to place stop loss or close trades, and can also be

This indicator displays signals on the price chart based on the classic indicator, the Money Flow Index (MFI). Volume is taken into account when calculating MFI values. The MFI can be used to identify overbought and oversold zones in the market. This indicator allows you to display several types of signals on the price chart: MFI crossing the midpoint between the overbought and oversold zones; MFI exiting the overbought or oversold zone; MFI entering the overbought or oversold zone; fast MFI and

Volume Volatility is an indicator which analyzes currency pairs, indices, commodities etc. in terms of extremely high and extremely low accumulation to distribution ratio in comparison to values from past. The most important parameter is "Volume Volatility Factor" - this parameter, in big simplification, determines how far distance in the past is analyzed. The lower value of the parameter, the indicator analyzes less data from the past. I recommend you to set and test e.g. 3, 5, 15, 35, and 48 w

Ou "MAC". Este é um indicador projetado para ajudá-lo a capturar e negociar a tendência. A ideia por trás deste indicador pode ser explicada nas próximas etapas:
Desenhe um envelope médio de movimento rápido. Desenhe um envelope médio lento. A banda superior de MAC é o valor mais alto entre a alta de ambos os envelopes. A banda inferior de MAC é o valor mais baixo entre a baixa de ambos os envelopes. A nuvem do histograma MAC preenche a distância entre duas bandas para mostrar a mudança de dire

Gegatrade Pro EA is a Cost Averaging System with a Sophisticated Algorithm. It is secured by a built-in “ News WatchDog ” system that suspends trading during news events.
Trading Strategy Gegatrade Pro EA is based on the fact that most of the time the price usually moves between the upper and lower boundaries of the trading channel. Basing on this fact, Gegatrade Pro places its first trade, assuming that the price is going to return to its average value and take the profit which is defined. If

The indicator takes screenshots of the active terminal chart. Available image saving options: At the opening of a new bar (candlestick) depending on the currently selected timeframe; After a certain time interval, e.g. every 10 minutes after indicator launch on a chart; When trade orders are opened/closed both by an Expert Advisor and manually; Each time when a user clicks the "Screeshot" button.
Indicator Parameters Settings Screenshot time Start Time (hh:mm) - sets the start time of indicator
Universal adaptable indicator. It determines the estimated trading range for the current day based on the available history a real data, and displays the area of the probable price rollback on the chart. All this thanks to the built-in algorithm that automatically adapts to any behavior models of the market quotes. With the parameters adjusted, the indicator shows its effectiveness on most of the currency pairs, that have a rollback from the reached extremums during the current or the next tradi
This is a medium-term conservative system. It tracks quote movements and defines entry points. The Expert Advisor is completely automated and features the unique algorithm. It has been designed for trading CHFJPY and is based on a range trading strategy. Extreme levels are defined based on history, and the EA starts trading expecting a roll-back. Two limit orders are set in case the price moves further. This product continues the EA Permanent series. Dynamic incoming data filtration method is us
O Mercado MetaTrader é a única loja onde você pode baixar um robô demonstração de negociação gratuitamente para testes e otimização usando dados históricos.
Leia a visão geral e opiniões de outros clientes sobre os aplicativos, faça o download para o seu terminal e teste um robô de negociação antes de comprá-lo. Apenas no Mercado MetaTrader você pode testar um aplicativo de forma absolutamente gratuita.

Você está perdendo oportunidades de negociação:
- Aplicativos de negociação gratuitos
- 8 000+ sinais para cópia
- Notícias econômicas para análise dos mercados financeiros
Registro
Login
Você concorda com a política do site e com os termos de uso
Se você não tem uma conta, por favor registre-se