Conheça o Mercado MQL5 no YouTube, assista aos vídeos tutoriais
Como comprar um robô de negociação ou indicador?
Execute seu EA na
hospedagem virtual
hospedagem virtual
Teste indicadores/robôs de negociação antes de comprá-los
Quer ganhar dinheiro no Mercado?
Como apresentar um produto para o consumidor final?
Expert Advisors e Indicadores para MetaTrader 4 - 279
EZ.Fury Kite is judged based on the trend indicator MA. The general setting period is 15M, the trading time is about 1-2 hours, and 1 hour is the best. Multi-currency transactions that support ECN accounts. Use the default settings for compound interest mode, this EA will increase revenue by 20%-40% per month. Set the parameters manually and make a fixed profit model. This EA generates revenues of 10%-20% per month.
This EA gives time-limited attributes. In order to reduce the possibility of l

Specialized Binary Options Indicator. The name positive zone is inspired by how this indicator ultimately made me feel, which is "Positive". Not only from a emotional stand point but from a financial one. Once you start earning from this indicator it will give you that runners high, or that nice buzz after you finish a warm cup off coffee in the morning and blast on Cumbawamba's on hit wonder Tubthumping. The key to winning Binary Option is patience and controlling your emotion . This is why th

Recovery Scalper is a full automatic expert advisor. The mechanism of this system uses the principle of reversal and recovery strategy, which helps to reduce the risk of investment portfolios effectively through trade signal filters that use appropriate trading parameters. This EA has passed 12 years back test of real tick data (2008-2020).
Key Features
Timeframe: M15
Currency pairs: EURUSD
Use 4 or 5-digit accounts
Initial deposit: $ 500 up
It is recommended to use a low spread ECN Broker, 1:

A scalping indicator based on mathematical patterns, which on average gives signals with relatively small SL, and also occasionally helps to catch big moves in the markets (more information in the video)
This indicator has three main types of notifications: The first type warns of a possible/upcoming signal on the next bar The second type indicates the presence of a ready signal to enter the market/open a position The third type is for SL and TP levels - you will be notified every time price re

This expert is designed to catch up the last events in an hour time frame and compare it to previous hours and then make decisions, this hedging experts starts from 0.10 , 0.50 and 1.50 depending on conditions it moves from one level to the other This expert have proven his effeciency through currency pairs and metals as well it is adviced to use it with at least 10 pairs or different trades and the reason to get your investment back within few days i suggest to start with 500 EUR or USD

Signal indicator for scalping on any time frame and on any instrument All arrows remain in place and after closing the candle does not disappear. Can send notifications to your phone or email Works on any currency pairs, metals and cryptocurrency Suitable for working with binary options Distinctive features Does not redraw; Defines trend changes; Sends signals to a smartphone or email; Advanced settings for fine tuning; Works on all timeframes and on all symbols; Suitable for trading currencies,

This EA loads Support & Resistance Trend Lines and trade purely based on price action of Trend Reversal strategies. No effect with manual entry. It is possible to use this Expert Advisor as indicator. It also featuring both safe virtual Hedging as recovery method as well MANUAL entry by using control panel. Auto Strategy: Swing Reversal Patterns with trailing TP & Stop. Manual Strategy: BUY/SELL using Control Panel on chart with trailing TP & Stop. Operating Procedure Use 15 Minutes time frame
The Signal Strength Meter Lite is an which calculates the strength of buy and sell signals across many indicators, price action, and candlestick patterns, and displays a score for each symbol on a display board. Key Features: Analyses the signals from more than a dozen classic indicators Identifies Price Action and Candlestick patterns which are used in the calculation of the signals Returns a score of the Overall Signal Strength Ability to Change Smoothing Period to filter out small
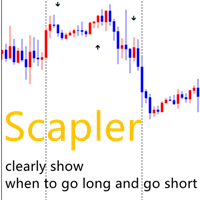
change the chart background color to white when you test! because the arrows are in black color!
ADVICE: 1,timeframe:I prefer H1,H4,D1. 2,profitable points: for the purpose of scalper ,less than 20 pipes for each trade is better. 3,currency:i prefer EURUSD,USDJPY,GBPUSD 4,how to place orders: up arrows means to go long and down arrows means to go short. one trade each time .close the trades in 120 hours if the trades hasn't been executed . 5,lots amount:0.0001 of your total capital. for example

The mechanism of this system is a technique to reduce unwanted risks by opening other positions in the same direction at different price levels. That is to reduce the average risk of more than one position that opens at different price levels. In the event that the order is opened, if the market changes in the opposite direction causing loss. In this scenario, the system will prevent the risk by using Averaging technique to minimize the risk by opening orders in the same direction. And if the ti
Gvs Trend Signal System is an indicator that generates trade arrows. It generates trade arrows with its own algorithm. These arrows give buying and selling signals. The indicator certainly does not repaint. Can be used in all pairs. Sends a signal to the user with the alert feature.
Trade rules Enter the signal when the buy signal arrives. In order to exit from the transaction, an opposite signal must be received. It is absolutely necessary to close the operation when an opposite signal is rece
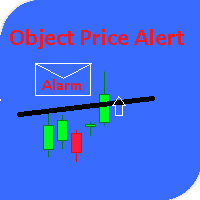
This utility gives a signal when the price crosses the graphical object. Also shows the distance to the object from the Bid price. It is possible to use not only with built by hand but also with those that draw other indicators. Use the filters by type and name. Works with most of the available constructions Trend Line, Horizontal Line, Vertical Line, Rectangle, Channel, Fibo Channel, Fibo, Expansion, Andrews Pitchfork, Gann Line, Trend By Angle, StdDev Channel, Regression Channel. It is possibl

Curiosity 4 Trend Colors It is an advanced trading system. This is a fully automatic Expert Advisor, which allows you to presize the trade according to the preferences of the trader. Curiosity 4 have more than 260 customization options for your trade. Different options for different styles of trade. Curiosity 4 Trend Colors is a Trend system of trade with different algorithm of trade mode. This EA using signals to place orders. Is a revolution in the customization of the trading. The algori

trading is not a game. trading is business. and the main thing to consider in business is to limit losses. Stop Loss is the lowest price limit set to limit losses. When price movements touch this value, the system will automatically close the order or position.
For most traders, the decision to put this stop loss is an uncomfortable choice. Why? because that means they have received the loss. However, every trader has the right to decide for himself which trading model is the most suitable for

Price rules :
Price increase 10USD by each positive review , however , price decrease 20 USD by each negative review , refresh by every 24 hours .
All free channels check in my profile here . Instruction : Here Inrex Indicator is our first Indicator which calculated by many unique data , as Inrex EA do not believe all the common indicators like RSI MACD . Those are replant indicator may cause a misconception to traders . it helps all Manual Traders and EA Traders about daily Range and

Hello dear friend! Here's my story. I'm fast. After many attempts to trade manually, I decided to use expert. I started writing my robot. But testing took a lot of time! In parallel, I tried other people's robots. And again I spent a lot of time testing. Night scalpers, news scalpers, intraday scalpers, and many other classes... you needed to know exactly when the robot was trading, when it was making a profit, and when it Was losing. Some robots have time-based trading features that are not
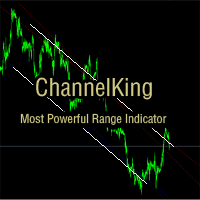
ChannelKing is an intelligent channel identification indicator. According to the high and low points formed by price fluctuations, combined with linear regression algorithm to get the approximate range of market fluctuations, it can give traders a good help in trend judgment and search for advantageous positions.
Indicator characteristics: 1. The index uses linear regression to calculate the trend line, which is more relevant than the ordinary high and low point line drawing trend line. 2. The
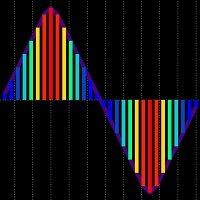
Markets Heat indicator can help you determine correct course of action at current market situation, by calculating market's "heat level". What is market's "heat level"? Well, it's my own way of simplifying complex market conditions to ease decision-making process. How does it work? Most of time market is moving in some narrow range and can't "decide" where to go -> flat market -> cold market. Other times, price goes Up or Down -> making trend movements -> heating the market. More powerful trends
이 제품은 한국에서 개발되었습니다. 대한민국에서 개발 된 서비스 제공 제품입니다.
제품의 개요 기능을 설명합니다. 매수 포지션 올 청산 매도 포지션 올 청산 실시간 TP,SL 설정 실시간 추적손절매 핍 설정 추적손절매 기능 통화 손익 전체 화면 모니터링 기능
제품 사용 환경 메타트레이더 4
입력변수 설정 Language : English,Korean BUYRiskPercent : 기본 2% (증거금에 대한 계약수 메니지먼트 설정, 입력값 1 ~ 100 정수로만 입력) SELLRiskPercent : 기본 2% (증거금에 대한 계약수 메니지먼트 설정, 입력값 1 ~ 100 정수로만 입력) HandBuyLot : 기본 셋팅 계약수 설정 매수 0.01 lot(로딩시 기본으로 설정할 계약수를 입력) HandSellLot : 기본 셋팅 계약수 설정 매도 0.01 lot TakeprofitPIP : 기본 셋팅 익절 값 PIP단위로 입력 StopLossPIP : 기본 셋팅 손절 값 PIP

STOCH and RSI EA This EA has been developed from the STOCH and RSI ALERT indicator ( https://www.mql5.com/en/market/product/32916 ). Please click the link to get a free download. It is a good tool many like to use it. Hence, with this EA, users will be able to put their strategy for automation. Input: Magic No: EA unique trade number. Trade Comment: custom order comment. Use Auto Lot: set to true -to use auto lot size. Auto Lot Size Percent(%): percent from balance to calculate money to ris

MegaBestPanel - is a panel that displays signal data on the three main timeframes. To display the results used a lot of currency pairs. This indicator is based on the MegaBest indicator. Now you can see a comprehensive picture of the market in one window! The indicator tracks the market trend with unsurpassed reliability, ignoring sharp market fluctuations and noises around the average price. The indicator does not redraw and is not late. The probability of a successful trend is 90%.

A fractal is a set that has the property of self-similarity (an object that exactly or approximately coincides with a part of itself, that is, the whole has the same shape as one or more parts).
Advisor works on the basis of the theory of self-similarity. The advisor algorithm determines similar fractal patterns on three timeframes at the same time (lower, current and upper). In the case of coincidences found, the adviser begins to work in the direction of the price following the fractal model.

This indicator is adding two sets of Bollinger Bands.
The "Double Bollinger Bands" trading strategy can help the trader find out and validate trend-based opportunities in especially volatile market conditions, explains Kathy Lien. More information, please get more explained by Kathy Lien in her Youtube. Double Bollinger Bands is one of the best method of following a trend. Settings Bands Period: 20 Bands Deviations 1: // Bollinger Bands as BB1 Bands Deviations 2: // Bollinger Bands as BB2 Pi
Optimized set files for 23 currency pairs - H1 SET FILES , for 17 currency pairs - M15 SET FILES , for 18 currency pairs - H4 SET FILES . You can read detail manual for learn how trade - MANUAL . For clients we have ready GIFT - UTILITY SIGNAL AGGREGATOR . Contact us to private message with purchase number. But only clients with Lifetime version of SIGNAL AGGREGATOR. Utility will manage to you open positions base on Indicator rules. SIGNAL AGGREGATOR - is not just an indicator which

Euro TEMA (EURUSD M15) This EA has been developed for EURUSD M15, e verything is tested and ready for immediate use on real account. Strategy is based on breakout of the TEMA (Triple Exponential Moving Average) indicator after some time of consolidation. It uses Stop pending orders with ATR Stop Loss and FIXED Take Profit . It also uses PROFIT TRAILING to catch from the moves as much as possible. For every candle the pending orders are modified to adapt the market behavior. Everything is al

Индикатор Profiter относится к стрелочному типу. Это значит, что торговые сигналы подаются в виде стрелочек . Голубая– вверх, на покупку, красная – вниз, на продажу. С помощью индикатора Profiter достаточно просто определять локальные пики и впадины цены, а также направление текущей тенденции. Дополняет определение high/low по тиковым объемам. Дополнительно в индикаторе реализованы звуковые и текстовые алерты, а также отправка оповещений на электронную почту. Входные параметры
Calculatio

The Netsrac Correlation Trade Indicator (NCTI) was created to trade correlations between different assets. NCTI offers five different strategies to do this. Five different correlation trading strategies with two or three assets Fast access your assets with one click via asset buttons Your profit/loss at a glance Configurable alerts via screen or mobile You can use the indicator with every timeframe. Higher timeframes give fewer but better signals. If you have some questions or suggestions - ple
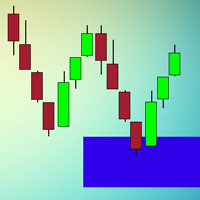
Индикатор "Buy Sell zones x2" основан на принципе "остановка/разворот после сильного движения". Поэтому, как только обнаруживается сильное безоткатное движение, сразу после остановки - рисуется зона покупок/продаж. Зоны отрабатывают красиво. Или цена ретестит зону и улетает в космос, или пробивает зону насквозь и зона отрабатывается с другой стороны так же красиво. Работает на всех таймфреймах.
Лучше всего выглядит и отрабатывает на Н1.
Может использоваться как: индикатор зон, где лучше вс

The indicator calculates volume profiles dynamically and displays the result as VAL, VAH and POC curves.
Indicator features The indicator uses the historical data of the lower (relative to the current) timeframes for calculations: M1 - for timeframes up to H1, M5 - for timeframe H1, M15 - for timeframe H4, H1 - for timeframe D1, H4 - for timeframe W1, D1 - for timeframe MN. The color of the DPOC curve sections is determined by comparing the volume of the POC levels of all profiles that make up
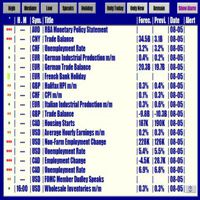
Forex News Alert Forex News Alert is an Expert Advisor that shows calendar news on the current chart and lets you set an Alarm individually for each news and choose how many seconds before the alarm is activated. It downloads calendar news from Forex Factory. Thanks to Forex Factory Inc. for this! You can set alarm individually for each news! Attention! Set WebRequest function for the EA operation. Open MetaTrader 4, in Menu select Tools -> Options, go to the Expert Advisor tab and activate
I speak in Hungarian. Magyarul beszélek benne. Első felvétel. https://www.youtube.com/watch?v=i2id5O1KPrI Második felvétel. https://www.youtube.com/watch?v=Zp2i7QN-IMc (Első felvétel. https://www.youtube.com/watch?v=h7UbTWiM-Lw Második felvétel. https://www.youtube.com/watch?v=y54q4Rasf2A&t=1s Harmadik felvétel. https://www.youtube.com/watch?v=13zYjsoe6ZQ Negyedik felvétel. https://www.youtube.com/watch?v=NGiB1AnxxfU ) Nice Day Signalos! If the Muving Average closes the candle over the candle.

Niubility RSI and Fibo The RSI will send an alert when the RSI value of the price gets to the level specified in the settings.
The input of the indicator can allow for change of RSI period, overbought and oversold.
The RSI will work for multi timeframe.
The RSI will scan different pairs.
This Fibo is designed to draw a Fibonacci retracement, using as a basis the ZigZag indicator.
Description:
'up' word means up trend.
'down' word means down trend.
' -- ' word means no trend.
'red br
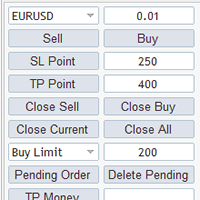
MG Panel The smart trader panel is very convenient to help users trading,it has a lot of features。
Introduction
The smart trader panel allow user to select difference symbol. The smart trader panel has Buy button and Sell button. The smart trader panel has Stoploss button and Takeprofit button. The smart trader panel has Close Orders buttons, Close Current button can close current symbol order, Close All button will close all orders. The smart trader panel can send BuyStop order and BuyLimi
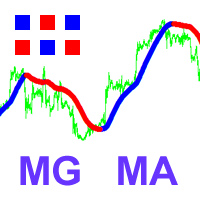
Niubility Moving Average Niubility Moving Average. Alternative usual Moving Average. Draws exponential Moving average with the specified period marking various colors movement upwards and downwards.This is a small tool to help visualize the difference between long and short period averages. I hope you enjoy!
Parameters TimeFrame1: Show the first timeframes. TimeFrame2: Show the second timeframes. TimeFrame3: Show the third timeframes. TimeFrame4: Show the fourth timeframes. period: Averaging p

The Advanced Bands indicator is a custom indicator based on the classic Bollinger Bands as created by John Bollinger. Generally, Bollinger Bands are created by adding/subtracting a number of standard deviations from the price. Advanced Bands also creates bands the same way and adds more features to be more useful for traders. FEATURES Three levels of bands (inside, outside, extreme) and a moving average can be plotted. Area between bands can be filled and highlighted. Number of deviations for
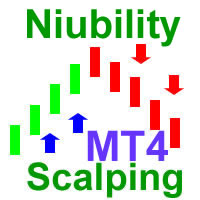
Niubility Scalping The Niubility Scalping indicator detects trend, give sell point and buy point. this indicator can use for scalping technique, and also use for trend technique.
Attention
Chart statistics will help you to optimize your trading, statistical accuracy to the hour.
It can works on every timeframe.
The indicator analyzes its own quality and performance.
Losing signals are highlighted and accounted.
The indicator is non-repainting.
It implements sound alerts.
Parameters
Pr

Oscillators are, by nature, exemple of any trend information. This indicator is "trended", meaning is it reacting to trend as well: if the oscillator is in the UPPER part of the window, then trade only BUYs. if the oscillator is in the LOWER part of the window, then trade only SELLs; You can also choose to start trading when the trend begins (see Alerts)
Parameter description: lookbackOsc : Period of the yellow line (the digital oscillator). (default = 14) DSFast : Fast Period of the oscillato

The Sextet Scalper Pro is an MT4 indicator that gives signals when new waves are starting in a trend. The trends are calculated using the original " The Sextet " indicator method. You get a free EA to trade with The Sextet Scalper Pro: Free EA . Default settings were optimized on GBPUSD H1 from 2017.
EA could be tested on free demo version of The Sextet Scalper Pro, before purchase. Key Features: Uses The Sextet Trend Detection Method which is already a good strategy in itself for detecting lo

[ZhiBi Dragon] baseia-se no princípio da oscilação, que pode prever o arranjo horizontal e forma de tendência do mercado e, em seguida, dar o sinal de ordem de acordo com a forma de mercado e também a probabilidade do sinal ea qualidade da tendência! O Verde e o Vermelho, O Verde, a corda para CIMA através Da Linha Amarela é a tendência para a Terceira corda, que Passa por baixo Da Linha Amarela é a tendência descendente. A probabilidade do sinal é dividida em três níveis: 25% ou 50% ou 75% Qua

Mars 4 TREND COLORS: is a Tren indicator. I s a powerful indicator of TREND for any par and any timeframe. It doesn't requires any additional indicators for the trading setup.The indicator gives clear signals about opening and closing trades, PAINTING THE CANDLES OF COLOR IN FUNCTION OF THE SENSE OF TREND .This Indicator is a unique, high quality and affordable trading tool.
Perfect For New Traders And Expert Traders Low risk entries. For MT4 Only Great For Scalping Great For Swing Trading

The strategy of the adviser determines the direction, the strength of the trend and the behavior of prices in the zone of "round" price levels. If several factors coincide, the adviser starts working in the direction of the most likely price movement.
The Expert Advisor uses a unique algorithm for tracking open positions.
Each position advisor has a stop loss and take profit.
Dangerous trading methods are NOT used. Recommended trading instruments (TF 5m): GBPUSD, EURUSD. For 24/7 advisor oper

* Who were the Turtle Traders? The Turtle Trader legend began with a bet between American multi-millionaire commodities trader, Richard Dennis and his business partner, William Eckhardt. Dennis believed that traders could be taught to be great; Eckhardt disagreed asserting that genetics were the determining factor and that skilled traders were born with an innate sense of timing and a gift for reading market trends. What transpired in 1983-1984 became one of the most famous experiments in tradin

SHL V1 The SHL V1 expert advisor is a scalping ea. For maximum results, we suggest using it only in a RAW Spread account.
TRADING TYPE: Market Trends Order Type: Pending & Market Time frame: Daily Risk Management: Yes Product: EURUSD Pending SL : Yes VPS : Proposed Fix Lot Size: Yes Platforms: MT4 Trailing Stop Loss: Yes Max Spread: 7 Max Open Orders: 1 Account Type : RAW/ECN Pending TP: Yes Max Stop Level: 15 STOP LOSS: VARIABLE
UPDATE: Works EXTREMELY well for EURJPY! --> more than 66% win rate monthly Guarantee! I want to introduce you the next-gen unique adaptive Binary options Indicator. This will destroy EURUSD & EURJPY The Raven is so sharp and efficient that it will pick the tops and bottoms of ANY type of market. Can also be used as a Forex Scalper. The Raven signal is based on multiple confirmation analysis. Gets confirmation from the most consistent signals known to man; Ichimoku, SMA, Bollinger Bands; and als

This Scanner scans moving average(MA) line across multi-currency pairs and multi-time frames and shows all the result in the dashboard. 1. Current bar is about to cross up the MA line - designated as "Xup". 2. Current bar is about to cross down the MA line - designated as "Xdn". 3. Previous bar that has just crossed up and closed the MA line - designated as "UP". 4. Previous bar that has just crossed down and closed the MA line - designated as "DN". Input parameters can be changed: MA, dashboa
Ultimate Simple - полностью автоматизированная торговая система. Торговый робот работает на любых валютных парах и на любом таймфрейме. Работа робота основана на принципе дивергенции(против основного тренда).
Объем входа в рынок и риски жестко контролируются на основе алгоритмов. Количество сделок ограничено уровнем свободной маржи в процентах, которое по умолчанию равно 1500% (во входных параметрах level = 1500.00). Объем входа в рынок зависит от количества свободных средств на счету, а если с

Niubility Trend Niubility Trend displays the trend direction for all time frames in real time.
You'll see at a glance at which direction the trends are running, how long they last and how powerful they are.
All this makes it an easy-to-use trend trading system for beginners, advanced and professional traders.
Features
Easy to trade Customizable colors and sizes It is non-repainting and non-backpainting It is fantastic as a trailing stop method It implements alerts of all kinds

This Expert Advisor will change how you manage your risk forever.
The EA automatically calculates your position size by either looking at your balance or equity. You need simply type in how much risk you want to have on that particular trade, move your TP line and SL line and it does the rest. Click buy or sell and it enters the position and places your TP/SL for you. It does the same thing for pending buy limits or sell stops. Feel confident knowing your risk before entering your trade! Most

VERY RELIABLE DAY TRADING AND SCALPING INDICATOR THAT CAN MAKE EVEN A NEWBIE PRODUCE TREMENDOUS RESULTS. IT IS SIMPLE AND FAST, NO FANCY ON-CHART OBJECTS. JUST BUY AND SELL ARROWS. IT TELLS YOU WHEN TO ADD TO A POSITION AND WHEN YOU SHOULD CONSIDER EXITING. THE BEST TIME TO EXIT ALL TRADES COMPLETELY IS ON OPPOSITE SIGNALS
GREAT PRODUCT FOR ALL TRADING STYLES (swing, day trading, scalping, etc). JUST TRY IT ON ALL TIME FRAMES AND CURRENCY PAIRS AND SETTLE ON THE ONE YOU FIND COMFORTABLE. Stric

Blockbuster
– автоматическая торговая система, разработанная для торговли на валютной паре GBPUSD. При появлении торгового сигнала робот открывает рыночный ордер и дополнительные лимитные ордера в количестве заданном в параметре OrderCount . Сетка ордеров не является торговой тактикой, но способствует значительному росту доходности. Торговля возможна и без дополнительных ордеров, для этого параметр OrderCount нужно перевести в значение 0. Торговля ведется внутри дня. Все ордера закрываются ка

The indicator shows the channel in which the price moves The algorithm for calculating the indicator is based on Fibonacci numbers, and also depends on the volatility of the instrument. Corrections and price reversals are most likely near the channel borders. Allows you to conduct trend and counter trend trade within the channel It works on all timeframes, on any currency pairs, metals and cryptocurrency Can be used when working with binary options
Distinctive features Shows clear boundaries of

Análise e gestão de um grande número de posições abertas. Tomada cumulativa, parada, parada móvel e muitos outros cenários de fechamento.
O Expert Advisor é executado em qualquer par e vê todas as posições abertas em todos os pares. A análise do lucro e de outros parâmetros pode fechar todas as posições ou as seletivas seguindo as configurações.
Ele pode trabalhar com todas as posições abertas, bem como levar em conta Magic, um par de negociação ou uma direção - LONG ou SHORT.
NÃO ABRE A PO

The BstMACD expert system works using the MACD indicator and sharp tick movements. Works with a deposit of $ 100! The method of trading scalping trend. With an acceptable level of spread, the bot passes any historical period on any currency pair. There is no point in testing at opening prices, either checkpoints or all tics. It is possible to work on accounts with a floating spread; entry into the market will occur only when the spread is lower than the level specified in the settings.
Settings

TrendSignal - projects one of the main market wisdom and says - "Trend is my friend." Using this indicator, you can develop a trading system in financial markets. Since the indicator is designed specifically to create a system for finding a market trend. Perhaps TrendSignal can be called the main one, since classic trading involves searching for trends. In principle, the indicator perfectly copes with its task. This indicator does not lag and show the trend in real time!
TrendSignal - Allows yo

MoveWave - Moving waves are very handy indicators for determining pivot levels. Most Forex traders make decisions based on technical analysis. This type of analysis determines patterns and trends in the market. With the help of complex mathematical equations that are combined and made out in the form of this indicator, the trader will be able to more accurately determine the price reversal levels. Wave theory mathematically represents various behavioral models of the market. It is used as the ba
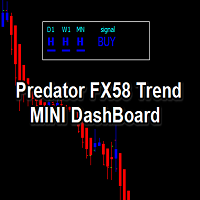
Heiken Ashi Bar Type based indicator: Enter Trades with the Confidence that higher timeframes agree. This tool will display the condition and direction bias all in one window, without need to look at the charts. Professional Traders who do trend trading or scalping with the trend, this is a great tool to be alerted by when the asset is ready. Example: Choose any MT4 timeframe you want Daily timeframe H4 timeframe H1 timeframe Choosing your favourite moving average method: EMA 50/ EMA 100 / EMA

Introdução. O indicador prevê o preço de acordo com a tendência prevalecente e as suas próprias pequenas flutuações estatísticas de preço. No StatPredict, você precisa definir o horizonte de tempo dos eventos previstos, que é definido pelas configurações de parâmetros do indicador « Length of forecast in bars» e determinado pela escala de tempo característica da tendência atual, que é melhor medida pelo indicador ProfitMACD . O cálculo final das leituras do i

Curiosity 3 Route 66 It is an advanced trading system. This is a fully automatic Expert Advisor, which allows you to presize the trade according to the preferences of the trader. Curiosity 3 have more than 260 customization options for your trade. Different options for different styles of trade. Curiosity 3 route 66 is a break system of trade with different algorithm of trade mode. This EA using signals to place orders. Is a revolution in the customization of the trading. The algorithms de
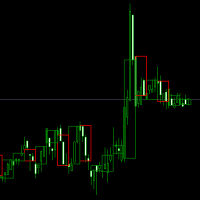
Get the bars from higher time frame on your main chart. You can be trading on M15 and watch H1 and H4 bars at the same time. Use the advantages by watching a single chart and keep track of Japanese candlesticks patterns from a higher time frame. You can no scalp on M1 or M5 without loosing sights of how much is it left for the M30 or H1 candle to close and if it bullish or bearish.

Unveiling WILD CYCLE EA: A Strategy for Dynamic Market Trends Adaptive Trading in Motion Embarking on the trading landscape from June 2021, the WILD CYCLE EA presents an evolutionary approach to market-trend following. Pioneering a relentless pursuit of profit, this EA deftly adapts to shifting market dynamics. Navigating the Core Strategy At its heart lies a fundamental approach—initiating positions in the direction of positive SWAP, such as the EURUSD SHORT. These positions are meticulously c

Vroom Vroom is a Trading Robot with no use of Classic martingale. Schedule scalping Options. it uses some Indicators as a filter to maximize Correct entries, Smarter than Hamster Pro! *StopLoss and TakeProfits are automatically updated by the EA during trading. user Not allowed to modify them! Recommendations : Lot = 0.01. ( if autolot enabled Allow (initial Lot) per (xx)USD = 100 ). Balance = 300 USD. Pair = EURUSD. TimeFrame = 5Min. Broker = Trusted Brokers
Inputs descriptions : Initial
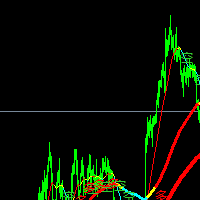
Based on the trend of more empty line. At present is version 1.03, with new later. Appear more prompt, can open more than single Empty message, can open an empty list The discoloration of three counties, represent different levels of The market at present there is an organization - the sea education, they are also more empty lines, but I more empty line is based on their changes, on the basis of identifying trend more accurately.
Trad duokong line is an automatic identification of long-short t

Vejamos a natureza das mudanças de preço no mercado Forex, não prestando atenção às razões pelas quais essas mudanças ocorrem. Essa abordagem nos permitirá identificar os principais fatores que afetam o movimento dos preços. Por exemplo, vamos considerar os preços de abertura das barras no par de moedas EUR-USD e no período de tempo H1. Por esses preços, construímos o diagrama de Lameray (Figura 1). Neste diagrama, pode-se ver que o movimento dos preços ocorre basicamente de acordo com uma equaç

Description:
- D ay Pattern - an indicator that helps to identify patterns of price changes for the development of trading algorithms and strategies.
For whom this tool?
- For developers of trading strategies and algorithms.
- Medium- and long-term traders. Time frames H1-W1.
Features of the indicator:
- There is a function of exporting indicator values to a file of the csv format.
- Using the information panel, you can conduct an express analysis of trading tool.
- The indicator is sui
This dashboard is a great tool for user who trade using Stochastic and Relative Strength Index(RSI). It is an upgrading from STOCH and RSI Alert product. For details and free download please click here . It monitors multi currency pairs on multi-time frame. It fires signal to mobile phone, pop-up alert and send email. Please go through all the pictures below for detail descriptions of the inputs and parameters.

The HORNET automated trading advisor was designed to work with the EURUSD pair, but with proper optimization it works successfully on many other currency pairs. The algorithm of work is based on several precise strategies, such as: regression channels on several timeframes, Price Action patterns, following the medium-term trend. The use of several filters, such as: control of the average daily deviation, reversible patterns on higher timeframes, determining the medium-term trend, allows you to

Fully automated Expert Advisor designed for the forex market. The main properties: - The number of characters in quotes is determined automatically.
- The EA works with standard accounts, cent, micro and ECN accounts.
- Timeframe of the chart does not matter. This parameter is defined in the settings.
- The EA uses a dynamically calculated lot size or fixed.
- The spread filter does not allow the expert advisor to open orders at a high value.
- The EA always uses Take Profit and thus it is

FV 4005 Stage II Представляю Вашему вниманию новый автоматический советник основанный на базе индикатора Bollinger Bands. Данный эксперт принимает торговые решения основываясь на показаниях линий Боллинжера. Торговые рекомендации: Тайм Фрейм - М15; Валютная пара - EURUSD (по мере тестирования и обновления валютные пары и настройки для них будут добавляться в комментариях); Настройки: Dynamic Lot - динамический лот; Start deposit - объем Вашего начального депозита; Lot - лот в расчете на Start

Euro Forecaster (EURUSD H1) This EA has been developed for EURUSD H1. Everything is tested for H1 timeframe . Strategy is based on breakout of the THIS BAR OPEN after some time of consolidation. It uses Stop pending orders with ATR Stop Loss . For locking profits the BE and TRAILING PROFIT functions are present. At 9:00 pm we are closing trading every Friday to prevent from weekly gaps. !!!Adjust these times to your broker time. Preset values are for UTC+2 only!!! For every candle the pendi

The cut release of Top Signals Strategy EA for less price. With default parameters EA works in Assian session and scalps market. EA opens trades by RSI indicator signals in a specified time interval. In the case of a repetition of the signal opens a unidirectional transaction. The number of transactions per day can be limited. Revolves trades on the opposite signal. Displays information on trade and its results. Also you can set virtual stop loss and take profit. Telegram channel for discation p
O Mercado MetaTrader é um site simples e prático, onde os desenvolvedores podem vender seus aplicativos de negociação.
Nós iremos ajudá-lo a postar e explicar como descrever o seu produto para o mercado. Todos os aplicativos no Mercado são protegidos por criptografia e somente podem ser executados no computador de um comprador. Cópia ilegal é impossível.
Você está perdendo oportunidades de negociação:
- Aplicativos de negociação gratuitos
- 8 000+ sinais para cópia
- Notícias econômicas para análise dos mercados financeiros
Registro
Login
Se você não tem uma conta, por favor registre-se
Para login e uso do site MQL5.com, você deve ativar o uso de cookies.
Ative esta opção no seu navegador, caso contrário você não poderá fazer login.