Conheça o Mercado MQL5 no YouTube, assista aos vídeos tutoriais
Como comprar um robô de negociação ou indicador?
Execute seu EA na
hospedagem virtual
hospedagem virtual
Teste indicadores/robôs de negociação antes de comprá-los
Quer ganhar dinheiro no Mercado?
Como apresentar um produto para o consumidor final?
Indicadores Técnicos para MetaTrader 4 - 96

Concept of Market Profile was created at Chicago Board of Trade (CBOT) by trader Peter Steidlmayer and first published during the 1980s as CBOT product. Market profile by itself is not a stand-alone strategy, but a different way how you can view the market and make better trading decisions.
They have seen a market as an auction process which is affected by supply and demand the same way as every other auction, for example, development of prices of food, gas etc.
The price goes up as long th

The indicator builds "psychological levels": levels of round numbers and intermediate levels of round numbers.
Round numbers play an important role in forming support and resistance levels. There is a pattern in which the decline or growth of the price can stop at round numbers.
The level whose price ends at 0 is the level of a round number of the first order. Intermediate level, this is the level between two round levels, for example, between 10 and 20 this is level 15.
In the " Num_Zeros "
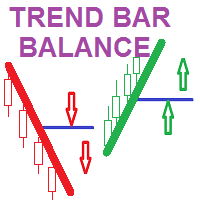
Trend Bar Balance Indicator Simple indicator based on trend detection and support resistance breakage It detects the major trend and the minor support and resistance levels *** a signal for UP /BUY is detected and alerted in a BULL trend and a resistance level break *** a signal for DOWN /SELL is detected and alerted in a Bear trend and a support level break THE POWER OF THIS INDICATOR I USE IT WHEN YOU COMBINE ITS DAILY SIGNALS FROM DIFFERENT CHART SYMBOLS AT SAME TIME AND CLOSE ALL ORDERS BY

DESCRIÇÃO: A teoria do indicador é que as moedas negociadas na sessão europeia dormem à noite. E quando acordam, vão para o meio dourado de Fibonacci, à sua maneira. À noite, forma-se um canal do qual querem sair, pela manhã com renovado vigor na estrada. O nível superior do canal é a zona de compra.
O nível inferior do canal é a zona de venda. Os objetivos da caminhada são marcados com cores na parte superior e inferior.
O indicador produz todos os parâmetros em oito buffers, que podem ser l
Here on some thoughts about the sl dash information and layout for strength indicators for clarity and view. We have Bid Ratio, Relative Strength, Currency Strength, Absolute Strength, Gap and Sync.
Bid Ratio is based on the current price as a percentage of the Day Range. This range can be based on the Day Bar (the time elapsed since the brokers open time) or Rolling (the last 24 hours).
Relative Strength is the Bid Ratio of a pair expressed in a range of gap diffrent value -9 to +9.
Currenc

Many forex traders spend their time looking for that perfect moment to enter the markets or a telltale sign that screams "buy" or "sell". And while the search can be fascinating, the result is always the same. The truth is… there is no guaranteed way to trade the forex markets. As a result, traders must learn that there are a variety of indicators that can help to determine the best time to buy or sell a forex cross rate. Our indicator definitely does this! This strategy is created by traders fo
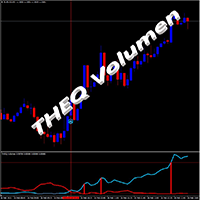
THEQ Volume é um oscilador de volume. Negocie seguindo tendências ou possível reversão. O Volume THEQ também inclui Setas de Volume THEQ, indicador com sinais e alertas e EA de Volume THEQ para real / demo, backtesting e otimização ou faça sua própria estratégia. O indicador adicional e o Robot EA são enviados separadamente após o pagamento. THEQ Volume não repinta, não tem lag e os sinais nunca desaparecem quando a vela fecha. Possui ainda um pré-sinal para estar pronto e entrar no mercado rapi
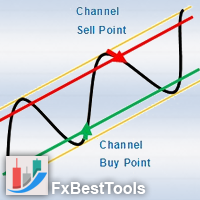
Channels Indicator is an All-In-One Indicator with a powerful calculation engine. The Indicator contains 4 different and usual methods for finding channels on the market. Indicator is powered by a visual interface and with various selections of alerts and notifications.
Testing Indicator : Strategy Tester does not respond to your clicks on panels (This is metatrader tester limitation). Thus input your desired settings on the indicator pre-settings and test.
Using Indicator :
Display 4 Typ
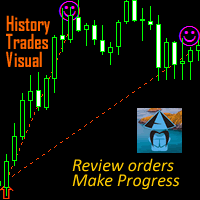
Name: History Trades Visual Purpose: Show history orders' open&close time&price ,drawing the route. You can review the trades, help analyzing and getting progress. Advantage: Easy to use, small and stable, no interference with other indicators and objects on charts.
Step of using: 1. List the history orders in account history page in MT4. 2. Click this indicator from the directory, then the history traders will be shown in the main chart for current symbol. 3. For better visual display acco

This indicator, Bull Bear Easy MTF, summarise the strength color graphic and percentage of power for both Bull and Bear in current market emotion stage which will show you in multi time frames and sum of the total Bull and Bear power strength which is an important information for traders especially you can see all Bull and Bear power in visualized graphic easily, Hope it will be helpful tool for you for making a good decision in trading.

Индикатор Trading Strategy призван помочь трейдерам в поиске оптимальных входов в сделку и выходов из неё. В его основе лежат показания технических индикаторов (MA, RSI, ATR и др.), а также авторский алгоритм, связывающий их сигналы в единое целое. Индикатор даёт сигналы на покупку и продажу в виде стрелочек: стрелочка вверх — сигнал на покупку, вниз — на продажу. В правом верхнем углу показаны сигналы индикатора на 6 таймфреймах (M1, M5, M15, M30, H1, H4) данной валютной пары.
Индикатор сво

This indicator Matrix X indicator.Indicator displays Stochastic oscillator,Williams Percent Range,DeMarker,Relative Strength Index,Matrix trend movement. Indicator helps to buy and sell.Matrix trend = (Stochastic+WPR+DeMarker+RSI)/4. Features
KPeriod - displays Stochastic K period. DPeriod - displays Stochastic D period. Slowing- displays Stochastic Slowing. Stochastic_Method - displays Stochastic Method. Stochastic_price - displays Stochastic Price. WPR_per - displays WPR period. Dem_per - disp

The Objective indicator can be viewed as a complete trading system. The indicator analyzes market dynamics for pivot points. Can be used as a channel indicator or level indicator!
The principle of operation of the indicator is to automatically determine the current state of the market when placed on a chart. Shows favorable moments for entering the market in stripes.
This indicator allows you to analyze historical data and, based on them, display instructions for further actions on the trader

The intelligent algorithm of the Ferbey indicator shows potential reversal points of the market with a high probability. The Ferbey indicator is perfect for trend trading! If you trade with the trend, then a trading strategy based on this indicator will suit you perfectly.
The indicator filters out market noise, practically all and all the necessary functions for working on a thread are built into one tool. Works on all currency pairs and on all timeframes, the indicator setting is at your req
O Indicador de Carrapato
é uma ferramenta muito poderosa para escalpelamento. Mostra o movimento de cima e para baixo no mercado.
Dessa forma, você pode identificar a direção muito mais rápido.
O indicador é muito fácil de instalar e pode ser usado em todos os prazos e todos os pares forex, bitcoin .....
Basta instalar o arquivo na pasta indicadora do terminal MT4, atualizar ou reiniciar o terminal e arrastá-lo para o gráfico que deseja negociar.
A melhor maneira é olhar para os crossovers

The Life Trend indicator can track a steady price movement in a specific direction. In this case, the movement itself can be downward, upward or sideways, when the market movement does not have a pronounced direction. The indicator works on the basis of two moving averages and an oscillator. Using the signal search algorithm, the indicator generates signals in the form of arrows.
Trading based on trend indicators is the simplest and often the most effective. If you correctly identify the begin

The Beautiful indicator shows potential market reversal points. The intelligent algorithm of the indicator detects the trend well, filters out market noise and generates input signals and exit levels. Uses just one parameter for settings. Simple, visual and efficient trend detection. The indicator does not redraw and does not lag. You can set up message alerts as sound or email. Works on all currency pairs and on all timeframes. Ready-made trading system.

This is an oscillator indicator unlike other. All the value is more than 0. Value between 0-20, trend are weak :- do not trade. When the value is more than 20 :- Open trade depend on color. Long Setup : DirectTrend is above 20 There are two consecutive Green histograms The second Green histogram is higher than the first A trader Long the third candlestick on the open Short Setup : DirectTrend is above 20 There are two consecutive Red histograms The second Red histogram is higher than the first

The indicator do have inside two a tehnical its "RSI" and "Aligator" indicators with histogram for technical analysis of the market, currencies, currency pairs, precious metals and oil, and you can also analyze various cryptocurrencies such as Bitcoin and Ethereum. The indicator analyzes quotes and, based on their data, displays its icons on the chart for trading analysis. The indicator works very well, does not freeze and does not slow down even a weak processor in the computer, and is also no

The indicator plots higher timeframe Kijun-sen (of Ichimoku ) on lower timeframes.
To change timeframes, in the timeframe field enter the number:
M1 PERIOD_M1 1 1 minute. M5 PERIOD_M5 5 5 minutes. M15 PERIOD_M15 15 15 minutes. M30 PERIOD_M30 30 30 minutes. H1 PERIOD_H1 60 1 hour. H4 PERIOD_H4 240 4 hour. D1 PERIOD_D1 1440 Daily. W1 PERIOD_W1 10080 Weekly. MN1 PERIOD_MN1 43200 Monthly.
By default, the Kijun is shifted 3 periods forward but if you wish to have it exactly as

交易是需要一个核心维度的,交易信号标准化机制,需求每一笔交易的开仓信号都是需要有依有据。比如我们这个单PINBAR交易策略。红色星星代表空头信号,蓝色星星代表多头信号。交易信号有实时提醒呈现,可以结合ZZ锯齿指标搭配的一起用希望我的这个指标帮你越早建立一个完善的交易信号指标---------------------------------------------------------------------------------------------------------------------------------------------------------------------------------------------------------------------------------------------------
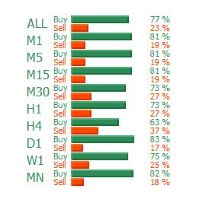
This MT4 indicator, Bull Bear Visual MTF (9 Time Frames), summarize the strength color graphic and percentages of power for both Bull and Bear in current market emotion stage which will show you in multi time frames and sum of the total Bull and Bear power strength which is an important information for traders especially you can see all Bull and Bear power in visualized graphic easily, Hope it will be helpful tool for you for making a good decision in trading.

Este indicador de painel com vários símbolos pode enviar um alerta quando uma tendência forte for identificada. Ele pode fazer isso construindo o painel usando os seguintes indicadores / osciladores (doravante mencionados apenas como indicadores): RSI, Stochastics, ADX, CCI, MACD, WPR (Williams Percent Range, também chamado de Williams% R), ROC (Price Taxa de variação) e oscilador final. Ele pode ser usado com todos os períodos de tempo de M1 a MN (pode mostrar apenas 1 período de tempo por vez)

This indicator shows the high volume zone. From the last minutes that you set yourself, the image of the volume zone is generated on an ongoing basis. The indicator also shows the V-Poc, Average Volumen and V-WAP lines. if you are using high intervals you must enter a large number of minutes. the zone builds itself up as the chart moves. if you want to build a zone from: last day - 1440 minutes, last week - 10080 minutes, ... etc. If you need an indicator that shows the constant volume zone
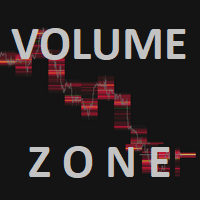
This is an indicator that shows high volume zones and very important points such as V-POC, Average Volume and V-WAP, its use is very similar to the volume Profile but has much more use, You can adjust the time interval in which the zone is to be built, I recommend high compartments type D1, W, M. But if you are using very low time intervals you can also use lower TF zones. If you need an indicator that shows the variable volume zone range frames there is ...HERE...
Volume Zone is an advan
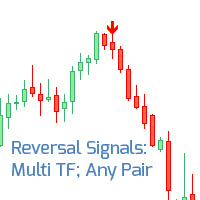
Indicador multimoeda de sinais de reversão Confira Meu #1 Assistente de trading : inclui 66 + recursos e indicadores | Entre em contato se tiver dúvidas Os sinais são calculados com base em níveis de sobrevenda e sobrecompra. O indicador funciona com qualquer instrumento de trading e em qualquer timeframe. Os sinais são filtrados adicionalmente por indicadores de tendência. //------ As cores das setas podem ser ajustadas nas configurações de entrada. Opções de notificação: alertas no ter
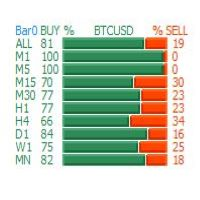
This MT4 indicator, Bull Bear Visual MTF V2, summarize the strength color graphic and percentages of power for both Bull and Bear in current market emotion stage which will show you in multi timeframes (9) and sum of the total Bull and Bear power strength which is an important information for traders especially you can see all Bull and Bear power in visualized graphic easily, Hope it will be helpful tool for you for making a good decision in trading.

https://www.mql4.com The price trend indicator
The price trend indicator accurately shows the changes in market prices , At the same time, this index also shows the future trend of the market price . The indicator does not redraw and does not lag. The recommended time frame is not less than H1 . When the market price is in the light green range, the market is in the rising range, and when the market price is in the light purple range, the market is in the falling range

Indicador Scalper projetado para entrada precisa em transações comerciais. Projetado para negociação intradiária e de médio prazo em qualquer instrumento. O indicador não é redesenhado e não fica atrasado. Existe a possibilidade de notificação visual e sonora do aparecimento de um sinal de entrada. O indicador também envia sinais para buffers digitais, o que possibilita a criação de sistemas de negociação automatizados a partir dele.

The uniqueness of the KN-13 Ind indicator allows you to see order books on the chart. It is based on the algorithm for order book traders. The MT4 terminal chart displays the depth of the order book and the time of its formation. The direction displays the color, this allows us to understand the market mood in the most informative way. The settings allow you to dynamically adjust to any trading mode both for scalping and for medium and long-term trading.

The uniqueness of the Draga KN MIX Ind indicator allows you to see the order books on the chart. It is based on an algorithm for order book traders. The MT4 terminal chart displays the depth of the order book and the time of its formation. Direction reflects color, this allows us to most informatively understand the mood of the market. The settings allow you to dynamically adjust to any trading mode, both for scalping and for medium-term and long-term trading.

A "Volume Profile" is an advanced charting indicator that displays total volume traded at every price level over a user specified time period. The main components of the volume profile are POC ( Point Of Control - the price level, at which the maximum number of contracts were executed during a selected period), VAH ( Value Area High - the highest price in the Value Area) and VAL ( Value Area Low - the lowest price in the Value Area).
When we settled on the original indicator, we spent a lot of

" A trading range occurs when a financial instrument trades between constant high and low prices over a period of time. The upper part of the trading range of a financial instrument often provides price resistance, while the lower part of the trading range usually offers price support. Traders can enter in the direction of a breakout or breakdown from a trading range... "
This is the "Classical Theory" understanding of ranges. We have a different understanding of the nature of ranges and the

O indicador encontra ondas de impulso no gráfico. Analisa a quebra do canal fractal e constrói os níveis de impulso. Além disso, ele encontra supostos locais de falsas avarias e captura de liquidez. Nas configurações, você pode ativar o painel de várias moedas e selecionar quaisquer instrumentos e prazos. Alerta escolha entre a programação atual ou a lista inteira. Existem sinais separados de pulso e falso colapso. Blog-Link - Retest and Fake Breakout with UPD1 .
Padrões de negociação: + Re

TRENDIEST TREND LINE ️️️️️ Do you want to become a constantly profitable 5-star forex trader? ️️️️️
Trendiest Trend Line is a one of a kind trend line indicator, Trend lines work until the market reverses or consolidates. Easily stay out of the chop and stay in the long trends!
Key Features of Trendiest Trend Line Stay in strong trends longer with confidence Clearly shows you when the market is ranging to save you money Entry signals help you get in at a good price 100% reliable re

The Trend Display is a nice additional Tool to identify the current trend of the pair you want to trade.
It shows you the direction of the trend in the separate charts.
That way you have a nice overview of the direction in one chart.
You do not need to swap between each time frame to identify the trend.
I wish everyone the most possible success when trading FX. Thank you for using that Indicator.
Reborn master
The MT4 indicator finds turning points for entering trades. Works without redrawing and delays!
The indicator ideally determines the points of the beginning of a trend or correction for entering trades for currencies, crypts, metals, stocks, indices.
The first 10 sales will be with a 40% discount, then the price will be without a discount
Benefits: Signals are not redrawn! and are shown at the moment of appearance, and since the signal can appear at any time, the indicator d

This MT4 indicator, Stochastic Visual MTF, summarize the oscillator values in color graphic for both Main and Signal in current market emotion stage which will show you in multi timeframes (9) and sum of the total Main and Signal oscillator values which is an important information for traders especially you can see all oscillator values in visualized graphic easily, You can add more by Shift, Hope it will be helpful tool for you for making a good decision in trading.

The Point Transition trend indicator is based on price divergence. If you do not have your own trading strategy yet, you can use our ready-made trading strategy. The indicator will help in finding entry points when analyzing the price chart. The indicator displays information in a visual form. Has one Length parameter. It can be used as a filter in trading. The indicator can work both for entry points and as a filter. Do not forget that the approach to trading must be complex, additional informa
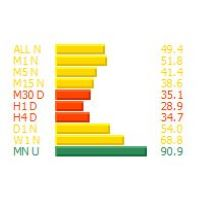
This MT4 indicator, Rsi Visual MTF, summarize the oscillator values in color graphic in current market emotion stage which will show you in multi timeframes (9) and sum of the total Rsi oscillator values which is an important information for traders especially you can see all oscillator values in visualized graphic easily, Hope it will be helpful tool for you for making a good decision in trading.

Active Channel is a non-redrawing channel indicator based on moving averages. The key difference between the Active Channel indicator and other channel indicators (for example, from the same Bollinger) is that the Active Channel takes into account not simple moving averages, but twice smoothed ones, which, on the one hand, makes it possible to more clearly determine the market movement, and on the other hand makes the indicator less sensitive.

The Arrows Forecasters indicator is simple, visual and effective trend detection. The intelligent algorithm of the indicator determines the trend with a good probability. Uses just one parameter for settings. The indicator shows the points of potential market reversal. Ready-made trading system.
The indicator does not redraw and does not lag. Works on all currency pairs and on all timeframes. You should remember that using a combination of forecasting tools, it is advisable to choose 2-3 indic

The Trend Goblin indicator identifies the mainstream trend. They help to analyze the market on a selected time frame. Easy to set up and works on all pairs and all time frames. Trend indicators provide an opportunity to classify the direction of price movement by determining its strength. Solving this problem helps investors enter the market on time and get good returns.
It is extremely important for any trader to correctly determine the direction and strength of the trend movement. Unfortunat

Schrodinger Channel is a non-redrawing channel indicator based on moving averages, it takes into account not simple moving averages, but twice smoothed ones, which, on the one hand, makes it possible to more clearly determine the market movement, and on the other hand, makes the indicator less sensitive. Signals are not redrawn and can be used immediately after they appear. This means that there is no need to wait for a new confirming bar. The lower and upper bands are used as support / resista

Most often, a good trend is visible on a price chart visually. But an experienced trader should clearly understand the current balance of power in the market before entering. The Trend Regulator indicator will help the trader to make decisions by helping him with the appropriate signals. The intelligent algorithm of the Trend Regulator indicator shows the points of potential market reversal. A strategy for trading with the trend, filtering market noise and all the necessary features built into o

Fibonacci Retracements Pro The Fibonacci Retracements Pro is a powerful yet easy to use indicator. It automatically plots all the important Fibonacci retracement and extension levels for you. FRP is dynamic powerful and seamlessly adjusts to whatever timeframe you are analyzing. Fibonacci Retracement Pro is optimized for ALL timeframes and ALL Currency pairs, Indices, Commodities, and Cryptocurrency pairs. Trade with improved confidence and maximize your success rate. Benefits Dynamic and Power

This FX indicator shows exactly when you need to buy or sell a position and is based on moving average indicator (golden cross and dead cross). If a golden cross or dead cross is detected, arrows will appear and an alert will sound. If you see the up arrow , the price will go up . When there appear down arrow , the price will go down . So you can decide easily buy or sell based on the information which you can gain from moving average! You can adjust the period in parameter settings. Default nu

The indicator works on the principle of the difference between two oscillators. You can set the periods for the fast and slow oscillator, as well as the position relative to the given level. This indicator will take your trading to a whole new level.
Settings: FastPeriod - fast oscillator period. SlowPeriod - the period of the slow oscillator. LevelSignal - signal level. Index - the bar from which to take data, 0 - the current bar, 1 - the previous one.
The indicator works on all timeframes a

The indicator works on the principle of drawing buy and sell arrows, based on the signals of the built-in algorithm. The indicator definitely needs a flat filter. This indicator will take trading to a new level. Works on all timeframes and currency pairs. It is advisable to use the indicator in conjunction with other tools for more reliable signals and making a more balanced decision.

The Secret Channel is an extended version of the Bolinger Bands. For those who use konals when trading. For this indicator to work, a moving average with a MAPeriod period is taken - the number of bars for analysis. As a result, two channels will be built, one shows the limit of the price in 70% of the time for the selected number of bars, the other shows the limits of the price 90% of the time for the selected number of bars. The channel calculates the limits within which any indicator or price

Indicador para trabalhar com uma tendência.A tendência é sua amiga!O indicador digital ajuda a encontrar os melhores pontos de entrada no mercado, para ficar o máximo possível na tendência.Quando a tendência e a direção mudarem, saia da posição a tempo.O indicador é recomendado para uso em períodos H4 e superiores.Funciona em qualquer instrumento comercial.O menu do indicador contém opções para o ajuste fino dos sinais e gama de cores.Boas negociações!
Fundamental Signals Indicator is a Non-Repaint Indicator with a powerful calculation engine that can predict market movement over 3000 pips (30000 points). The indicator does not analyze the market fundamentally, it is named fundamental because it can predict trends with large movements, no complicated inputs and low risk. Also Indicator can alert on market trend changes.
Using Indicator :
The Indicator is very simple and without complicated input parameters. (No need to optimize anything.)T

VR Pivot é um indicador de pontos pivôs importantes (pivot). Os Pontos Pivôs são um tipo especial de suporte (support) e níveis de resistência (resistance) que são usados para identificar as zonas de preço mais fortes. Os comerciantes profissionais usam os níveis de pivôs para determinar os preços em que há uma alta probabilidade de uma reversão de preço. Os níveis são calculados de acordo com fórmulas matemáticas especiais, os preços de fechamento, abertura, máximo, mínimo do período anterior s

Trade Zone SupDem - индикатор служит для определения зон спроса/предложения. В возможности входят такие функции, как отображение зон уже пробитых, зон к которым цена еще не доходила с момента определения, и подтвержденным, к которым цена уже доходила, но не пересекала полностью. Сами зоны можно определять, как с текущего таймфрейма, так и со старшего. Важно помнить, что если необходимо отображения зон с нескольких таймфреймов, то придется прикреплять к графику несколько копий индикатора, и при э

This is Command Prompt(CP) for MT4. By using this,you can access info that only brokers and programmers can access. For example,do you know your freeze level,margin mode,or how much memory used by MT4? Knowing these info,you can improve your trading.
How to Use Type following commands into command prompt box(Shown in photos.) and press Enter. For example,if you want to know maximum permitted amount of a lot,then type "maxlot". By typing "info",CP will show all commands available. By typing "hel

GT_Volume - это универсальный индикатор подходящий для всех валютных пар. Показывает текущий объем на горизонтальных уровнях. Объемы рисуются по мере движения цены. Все просто и нет ни чего лишнего. Индикатор очень помогает быстро определить сильные уровни сопротивления и поддержки, работает шустро! Есть возможность поменять цвет и выбрать день на котором отображать объемы.

Order Squeeze These levels are calculated in the lowest time frame with candle details. Ind calculates the quantity of market tick, volume per tick, and orders per candle. So with this statistical data, you catch the important price levels that supply and demand in the market are attractive for sellers and buyers. Institutes and banks trade with huge order lots and they need a lot of sellers for their BUY or need a lot of buyers when they want to sell an asset. They do that in special levels ful

The Search for Reversal trend indicator can be used both for pipsing on small periods and for long-term trading. Indicator showing signals for entry. Displays both entry points and the trend itself. Shows statistically calculated times to enter the market with arrows. Using the indicator, you can optimally distribute the risk coefficient.
Uses all one parameter for settings. When choosing a parameter, it is necessary to visually resemble so that the corresponding graph has an excellent project

The key difference between the Real Channel indicator and other channel indicators (for example, from the same Bollinger) is that the Real Channel takes into account not simple moving averages, but twice smoothed ones, which, on the one hand, makes it possible to more clearly determine the market movement, and on the other hand makes the indicator less sensitive. Real Channel is a non-redrawing channel indicator based on moving averages.

The Direction Arrows indicator tracks the market trend while ignoring the sharp market fluctuations and noise around the average price. The indicator implements a kind of technical analysis based on the idea that the market is cyclical in nature. It catches the trend and shows favorable moments of entering the market with arrows. The indicator can be used both for pipsing on small periods and for long-term trading.

Индикатор Adapter определяет господствующую тенденцию, помогает анализировать рынок на выбранном временном интервале. Прост в настройке и работает на всех парах и всех временных интервалах.
Индикаторы тренда дают возможность классифицировать направление ценового движения, определив его силу. Решение этой проблемы помогает инвесторам вовремя войти в рынок и получить хорошую отдачу. Для любого трейдера крайне важно правильно определить направление и силу трендового движения. К сожалению, единств

Balanced Costing - shows signals - can be used with an optimal risk factor. The indicator can be used both for pipsing on small periods and for long-term trading. The Balanced Costing trend indicator uses reliable algorithms in its calculations. Shows favorable moments for entering the market with arrows, that is, using the indicator is quite simple.
Works on all currency pairs and on all timeframes. Of course, the approach to trading should be complex and in order to make a decision, you shou

The indicator of tick volumes Better Volume MT4 allows you to assess the general mood of the market and quite accurately catch the moments of the formation of large movements. The indicator is a color arrows on chart window. In the calculation of Better Volume MT4 the Price Action combinations are taken into account, the values of the volumes with the height of columns and color marking are displayed. Input parameters: MAPeriod - period for calculating the moving average for volume; Right_Valu

Matrix Price Action Scalper (MT4 Indicator) Master Price Action: Precise Scalping & Re-Entry Signals for MT4 Traders! The Matrix Price Action Scalper is an advanced trading indicator meticulously crafted for MetaTrader 4 (MT4) , empowering you to identify high-probability buy and sell entries and re-entries purely based on raw price action . This powerful forex tool cuts through market noise, providing incredibly fast and accurate signals without relying on lagging indicators or oscillators. Wh

Ichimoku Map (instant look at the markets) - built on the basis of the legendary Ichimoku Kinko Hyo indicator.
The task of the Ichimoku Map is to provide information about the market strength on the selected time periods and instruments, from the point of view of the Ichimoku indicator. The indicator displays 7 degrees of buy signal strength and 7 degrees of sell signal strength.
The stronger the trend, the brighter the signal rectangle in the table. The table can be dragged with the mouse.
The

Clidro FX is a complete trading system designed and developed by Auxrum Analytics targeting the EURUSD, USDJPY, and GBPUSD FX pairs. It is currently available to MetaTrader 4 users. The Clidro FX algorithm, along with the optimized money-management and order-management rules sets up the basis for excellent trading results consistently over an extended period of time. The fundamental premise of the system is that each FX pair displays its unique quantitative characteristics while oscillating thro

Sometimes we need convincing data to make sure our robot, or our indicator goes exactly the way it should be. Sometimes we find out that the data is inaccurate , it can be void , or it has the same data as the previous one . that is why sometimes we find a message on the screen " Waiting for Update ". The system is trying to refresh and reload the data.
The Refresh Charts indicator. This Indicator Utility will solve those problems with just one click . It will refresh and extract data from

Versão estendida do indicador de mesmo nome. Ordem de serviço otimizada. Adicionadas configurações ao menu do indicador para encontrar sinais precisos. Existem configurações separadas para Compra e Venda.
Indicador Scalper projetado para entrada precisa em transações comerciais. Projetado para negociação intradiária e de médio prazo em qualquer instrumento. O indicador não é redesenhado e não fica atrasado. Existe a possibilidade de notificação visual e sonora do aparecimento de um sinal de en

️️ Attention: New updated version at 20-10-2024.
What's new in this update? -* New strategy integration. -* The trade is with the price trend only. -* The success rate of trades has increased by a very large percentage. No more losses with this indicator, test it for years ago and see if there is losses in one day results. but before testing it please see the explaining video down here. FxBears Powers is working on all forex pairs, metals, commodities, futures, indices, energies, c

Este indicador indica a tendência com LINHA grossa em azul e vermelho com base na Cruz dourada, Cruz morta e MACD.Você pode ajustar o número livremente nas configurações dos parâmetros (período MA, valor MACD). Portanto, você pode ajustar esse indicador ao tipo de moeda de negociação, período e assim por diante. O número padrão deste indicador é adequado para negociações de USD / JPY M30 ou H1 . O número padrão deste indicador é definido para USDJPY. Portanto, se você quiser usar este indicador
O Mercado MetaTrader oferece um local conveniente e seguro para comprar aplicativos para a plataforma MetaTrader. Faça download de versões de demonstração gratuitas de Expert Advisors e indicadores a partir do seu terminal para testes no Testador de Estratégia.
Teste os aplicativos em diferentes modos para monitoramento do desempenho e assim fazer um pagamento para o produto que você deseja, usando o sistema de pagamento MQL5.community.
Você está perdendo oportunidades de negociação:
- Aplicativos de negociação gratuitos
- 8 000+ sinais para cópia
- Notícias econômicas para análise dos mercados financeiros
Registro
Login
Se você não tem uma conta, por favor registre-se
Para login e uso do site MQL5.com, você deve ativar o uso de cookies.
Ative esta opção no seu navegador, caso contrário você não poderá fazer login.