Evgeniy Zhdan / 프로필
- 정보
|
13+ 년도
경험
|
194
제품
|
260
데모 버전
|
|
1
작업
|
0
거래 신호
|
0
구독자
|
➖➖➖➖➖➖➖➖➖➖➖➖➖➖➖➖➖➖➖➖➖➖
📢 텔레그램 채널: https://t.me/algotrdr
➖➖➖➖➖➖➖➖➖➖➖➖➖➖➖➖➖➖➖➖➖➖
💬 채널: https://www.mql5.com/ru/channels/algotrader
➖➖➖➖➖➖➖➖➖➖➖➖➖➖➖➖➖➖➖➖➖➖
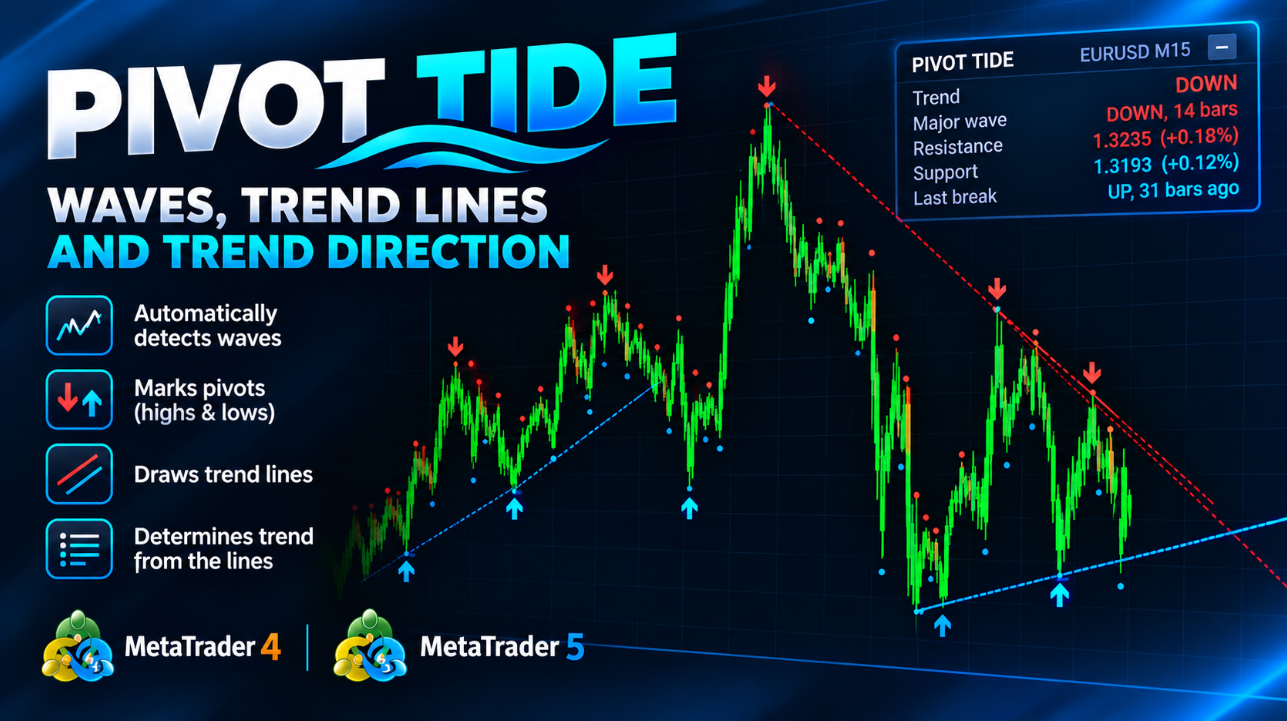
Pivots are joined into automatic trend lines: resistance through two falling peaks, support through two rising troughs. A line counts as broken when a candle closes beyond it, and live lines can extend to the right.
Trend comes from the lines. If both support and resistance are intact, it is a range. If only support survives, the trend is up. If only resistance survives, it is down. If neither survives, the last breakout decides. An optional draggable panel shows the trend, wave length, key levels and the last breakout, and alerts or push notifications fire on every trend change.
MT5-version: https://www.mql5.com/en/market/product/199662
MT4-version: https://www.mql5.com/en/market/product/199656
Pivot Tide — 파동 피벗, 자동 추세선, 추세선 기반 추세 방향 판단 Pivot Tide 는 MetaTrader 4용 인디케이터입니다. 차트를 자동으로 파동 단위로 나누고, 각 파동의 고점과 저점에 마커를 표시하며, 이를 이어 추세선을 그리고, 추세선의 상태로 추세 방향을 판단합니다. 모든 내용은 차트 위에 바로 표시되며, 간결한 정보 패널도 함께 제공됩니다. 모든 종목, 모든 시간 프레임에서 사용할 수 있습니다. MT4-version: https://www.mql5.com/en/market/product/199656 기능 파동을 감지합니다. 파동은 두 이동평균선의 관계로 정의됩니다. 빠른 SMA와 느린 LWMA입니다. 빠른 선이 느린 선 위에 있는 동안은 상승 파동, 아래에 있는 동안은 하락 파동입니다. 피벗을 표시합니다. 파동이 끝나면(이동평균선이 교차하면) 그 극값에 마커를 놓습니다. 상승 파동의 고점 또는 하락 파동의 저점입니다. 추세선을 그립니다. 연속된
Pivot Tide — 파동 피벗, 자동 추세선, 추세선 기반 추세 방향 판단 Pivot Tide 는 MetaTrader 4용 인디케이터입니다. 차트를 자동으로 파동 단위로 나누고, 각 파동의 고점과 저점에 마커를 표시하며, 이를 이어 추세선을 그리고, 추세선의 상태로 추세 방향을 판단합니다. 모든 내용은 차트 위에 바로 표시되며, 간결한 정보 패널도 함께 제공됩니다. 모든 종목, 모든 시간 프레임에서 사용할 수 있습니다. MT5-version: https://www.mql5.com/en/market/product/199662 기능 파동을 감지합니다. 파동은 두 이동평균선의 관계로 정의됩니다. 빠른 SMA와 느린 LWMA입니다. 빠른 선이 느린 선 위에 있는 동안은 상승 파동, 아래에 있는 동안은 하락 파동입니다. 피벗을 표시합니다. 파동이 끝나면(이동평균선이 교차하면) 그 극값에 마커를 놓습니다. 상승 파동의 고점 또는 하락 파동의 저점입니다. 추세선을 그립니다. 연속된
Confluence Meter: 26개 지표를 하나의 종합 레이팅으로 Confluence Meter 는 인기 있는 26개 지표의 신호를 계산해 "매도 / 중립 / 매수"라는 간단한 레이팅으로 종합해 줍니다. 수십 개의 창을 열어 수치를 직접 비교할 필요가 없습니다. 패널을 한 번만 보면 선택한 시간대에서 시장이 어느 쪽으로 기울어 있는지 알 수 있습니다. MT5-version: https://www.mql5.com/en/market/product/199466 Our products: https://www.mql5.com/en/users/trendhunter/seller 차트에 표시되는 내용 Oscillators 게이지. 11개 오실레이터의 레이팅입니다. RSI, Stochastic, CCI, ADX, Awesome Oscillator, Momentum, MACD, Stochastic RSI, Williams %R, Bulls/Bears Power, Ultimate
Confluence Meter: 26개 지표를 하나의 종합 레이팅으로 Confluence Meter 는 인기 있는 26개 지표의 신호를 계산해 "매도 / 중립 / 매수"라는 간단한 레이팅으로 종합해 줍니다. 수십 개의 창을 열어 수치를 직접 비교할 필요가 없습니다. 패널을 한 번만 보면 선택한 시간대에서 시장이 어느 쪽으로 기울어 있는지 알 수 있습니다. MT4-version: https://www.mql5.com/en/market/product/199466 Our products: https://www.mql5.com/en/users/trendhunter/seller 차트에 표시되는 내용 Oscillators 게이지. 11개 오실레이터의 레이팅입니다. RSI, Stochastic, CCI, ADX, Awesome Oscillator, Momentum, MACD, Stochastic RSI, Williams %R, Bulls/Bears Power, Ultimate
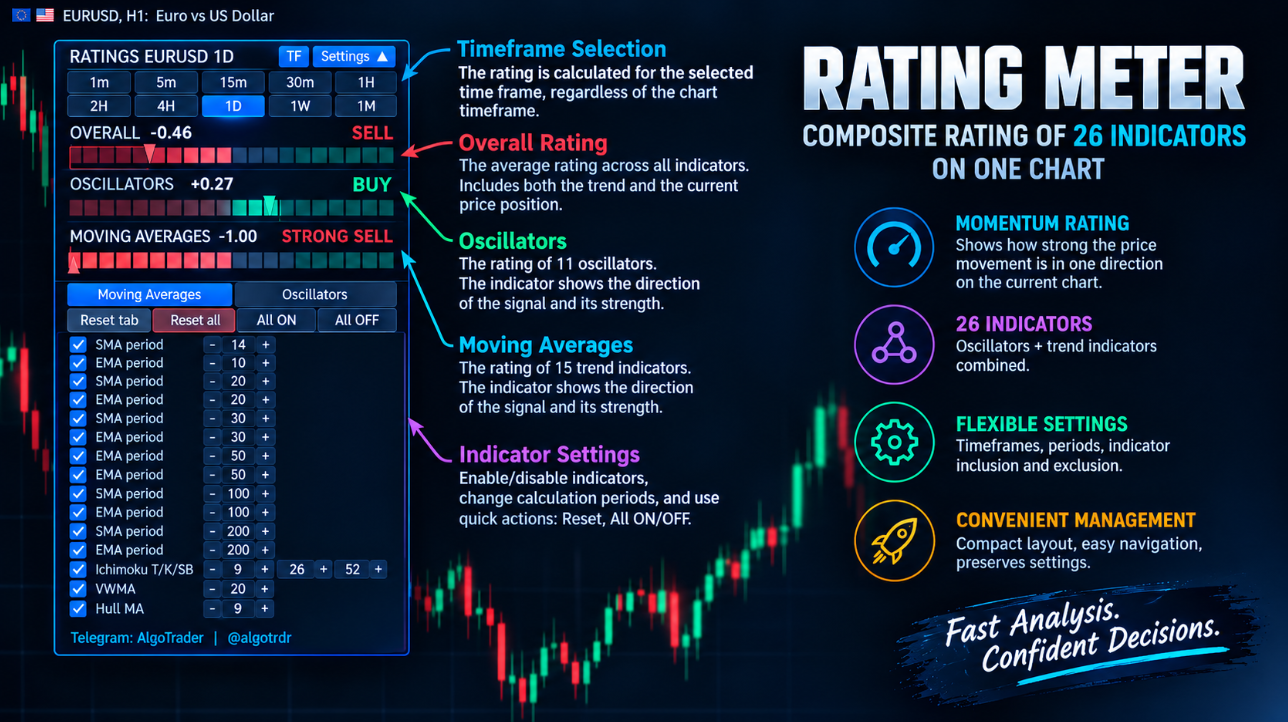
Rating Meter is a technical analysis panel for MetaTrader 5 that reads 26 popular indicators for you: 15 trend indicators (SMA and EMA on six periods, Ichimoku, VWMA and Hull MA) and 11 oscillators (RSI, Stochastic, MACD, CCI, ADX and others).
Each indicator casts a simple buy, neutral or sell vote, and the votes are averaged into a single rating from STRONG SELL to STRONG BUY. Two gauges show the oscillator and moving-average ratings separately, and an overall bar combines them. Each gauge has a needle and a vote counter, so you can see at a glance which way the market is leaning.
The panel is fully interactive. You can switch the rating between timeframes from 1 minute to 1 month, turn individual indicators on or off, and adjust their periods with plus and minus buttons, with the rating updating instantly.
The panel can be dragged anywhere on the chart, collapsed to show only the gauges, and it remembers your settings between restarts. It draws nothing on the price chart and opens no trades. It is a decision-support tool to use alongside your own strategy and risk management.
https://www.mql5.com/en/market/product/199402
Rating Meter: 26개 지표를 하나의 종합 레이팅으로 Rating Meter 는 인기 있는 26개 지표의 신호를 자동으로 계산해 "매도 / 중립 / 매수"라는 간단한 레이팅으로 종합해 줍니다. 지표 창을 하나하나 열어 수치를 직접 비교할 필요가 없습니다. 패널을 한 번만 보면 선택한 시간대에서 시장이 어느 쪽으로 기울어 있는지 알 수 있습니다. Our products: https://www.mql5.com/en/users/trendhunter/seller 패널에 표시되는 내용 Oscillators 게이지: 11개 오실레이터 그룹의 레이팅입니다. RSI, Stochastic, CCI, ADX, Awesome Oscillator, Momentum, MACD, Stochastic RSI, Williams %R, Bulls/Bears Power, Ultimate Oscillator가 포함됩니다. Moving Averages 게이지: 15개 추세 지표 그룹의 레이팅입니다. 기간
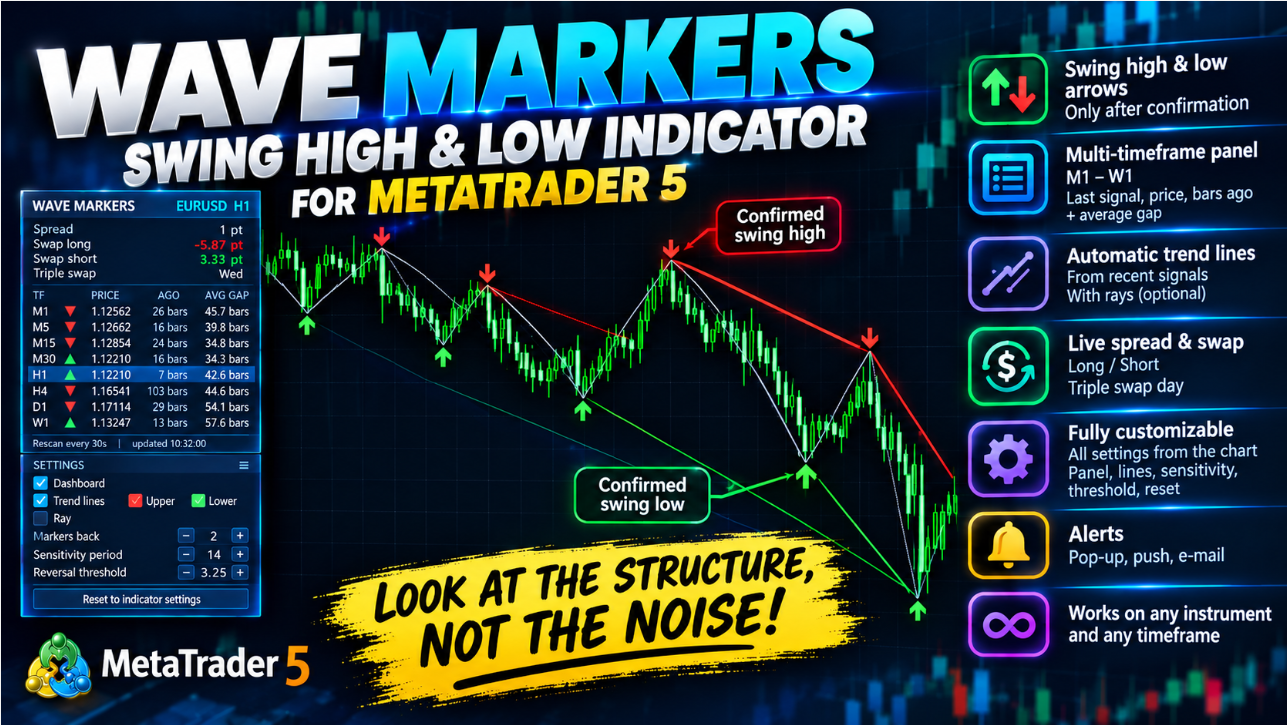
Wave Markers: 적응형 웨이브 맵과 멀티 타임프레임 대시보드 노이즈가 아닌 시장의 진짜 구조를 보세요. 확정된 스윙 고점과 저점, 이를 잇는 추세선, 그리고 M1부터 W1까지 모든 시간대의 상황을 하나의 패널에서 확인할 수 있습니다. 이 인디케이터는 무엇인가요 Wave Markers는 MetaTrader 5용 차트 구조 인디케이터입니다. 가격의 전환점(스윙 고점과 스윙 저점)을 찾아 깔끔한 화살표로 표시하고, 그 주변에 실용적인 도구를 제공합니다. 추세선, 전체 시간대 표, 그리고 실시간 스프레드와 스왑 표시입니다. "매수"나 "매도" 지시는 내리지 않으며, 어떤 결과도 약속하지 않습니다. 한 가지 일을 꼼꼼하게 합니다. 시장이 실제로 어디에서 반전했는지 보여 주어, 구조를 더 빠르고 일관되게 읽을 수 있도록 돕습니다. MT5-version: https://www.mql5.com/en/market/product/199158 흔한 ZigZag와 다른 이유 전통적인
Wave Markers: 적응형 웨이브 맵과 멀티 타임프레임 대시보드 노이즈가 아닌 시장의 진짜 구조를 보세요. 확정된 스윙 고점과 저점, 이를 잇는 추세선, 그리고 M1부터 W1까지 모든 시간대의 상황을 하나의 패널에서 확인할 수 있습니다. 이 인디케이터는 무엇인가요 Wave Markers는 MetaTrader 5용 차트 구조 인디케이터입니다. 가격의 전환점(스윙 고점과 스윙 저점)을 찾아 깔끔한 화살표로 표시하고, 그 주변에 실용적인 도구를 제공합니다. 추세선, 전체 시간대 표, 그리고 실시간 스프레드와 스왑 표시입니다. "매수"나 "매도" 지시는 내리지 않으며, 어떤 결과도 약속하지 않습니다. 한 가지 일을 꼼꼼하게 합니다. 시장이 실제로 어디에서 반전했는지 보여 주어, 구조를 더 빠르고 일관되게 읽을 수 있도록 돕습니다. 흔한 ZigZag와 다른 이유 전통적인 ZigZag는 무엇을 전환으로 볼지 고정된 거리(포인트 또는 퍼센트)로 결정합니다. 이 하나의 숫자는 대부분의 경우
https://www.mql5.com/en/market/product/186530
That's the starting point for Smart Phase Box.
Indicator for
MT5: https://www.mql5.com/en/market/product/186516
MT4: https://www.mql5.com/en/market/product/186530
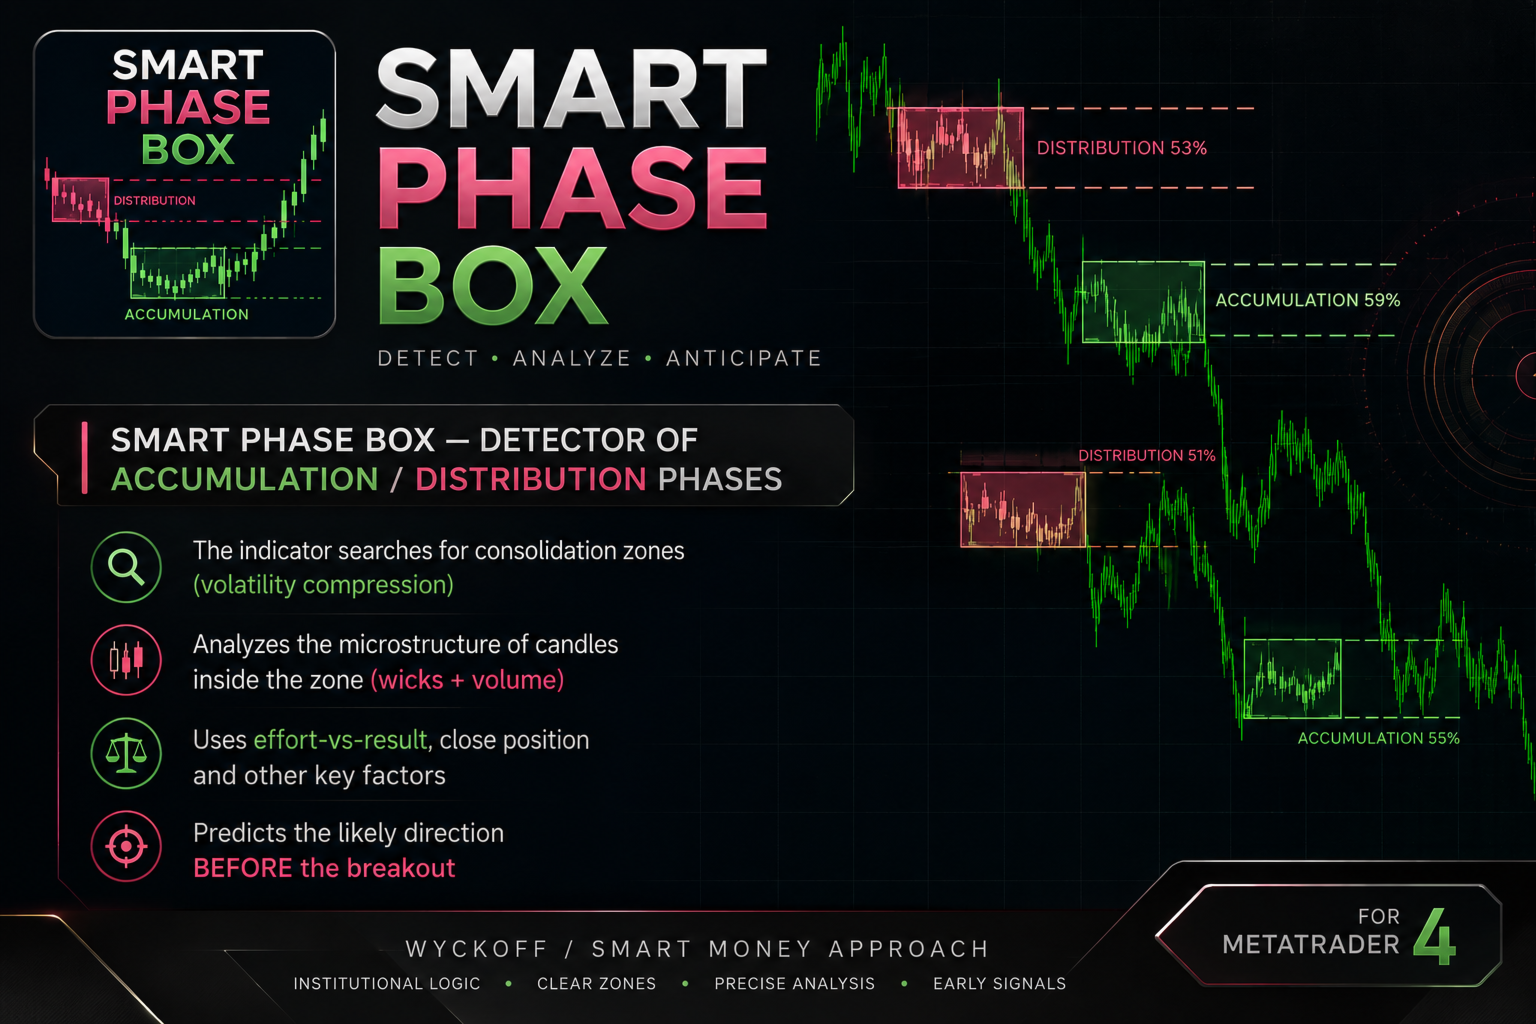
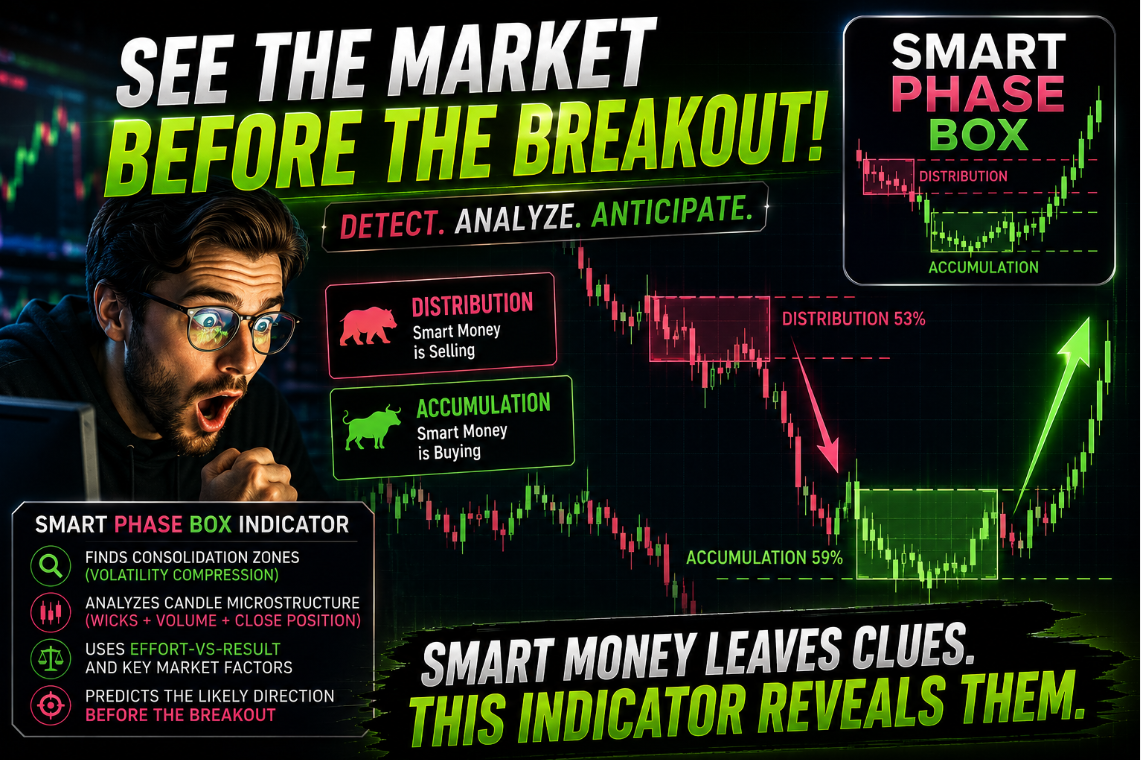
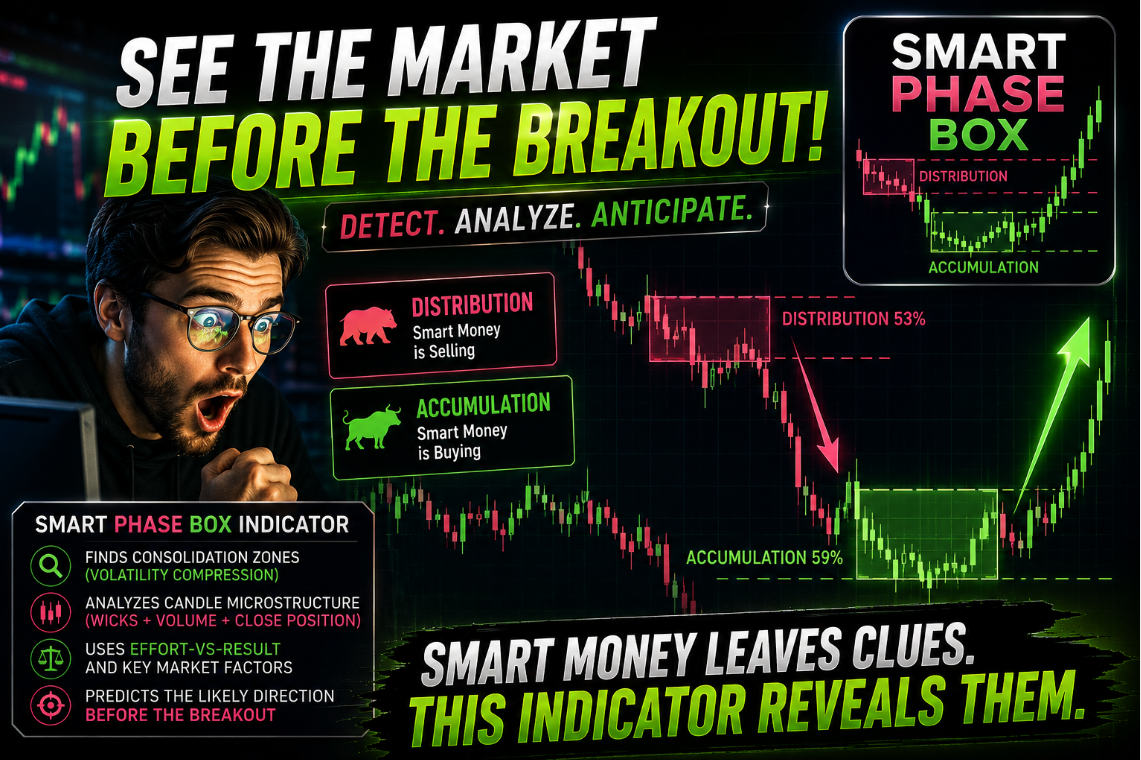
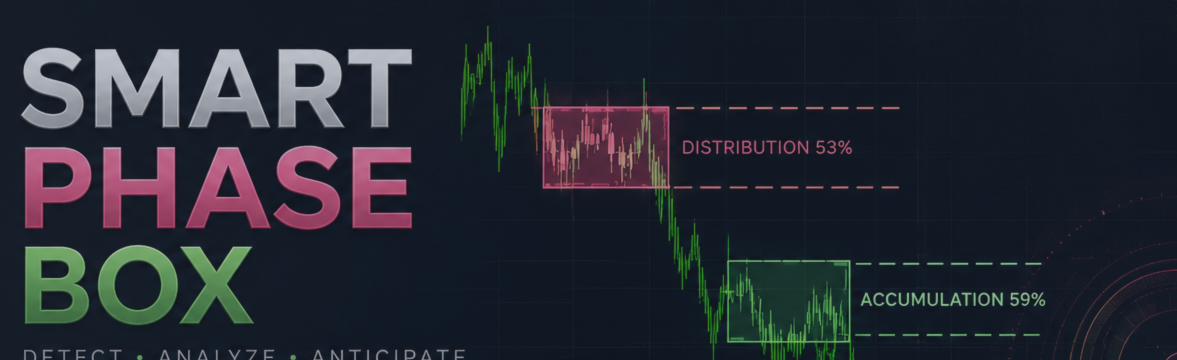
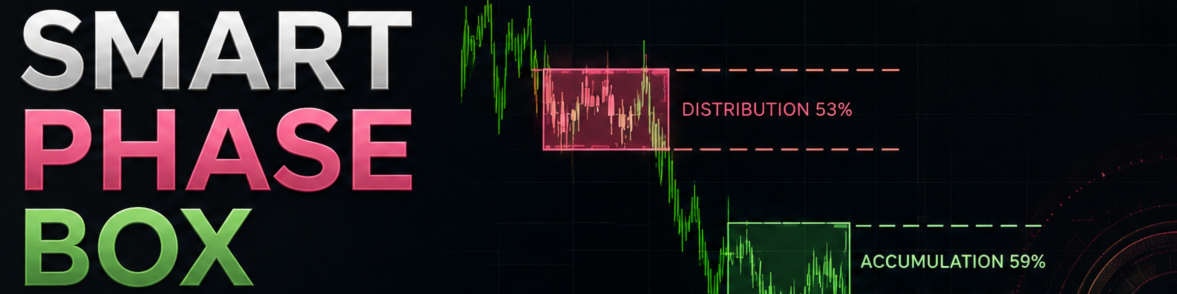
Smart Phase Box automatically locates consolidation zones (bases, flats) on the chart and analyzes the candle microstructure inside each zone — wicks, tick volume, body-to-range ratio, and where price closes relative to the zone — to estimate whether the zone looks more like accumulation (buyers absorbing supply) or distribution (sellers absorbing demand), based on classic Wyckoff / Smart Money concepts.
MT5: https://www.mql5.com/en/market/product/186516
MT4: https://www.mql5.com/en/market/product/186530
Smart Phase Box (SPB) — Indicator Description Smart Phase Box automatically locates consolidation zones (bases, flats) on the chart and analyzes the candle microstructure inside each zone — wicks, tick volume, body-to-range ratio, and where price closes relative to the zone — to estimate whether the zone looks more like accumulation (buyers absorbing supply) or distribution (sellers absorbing demand), based on classic Wyckoff / Smart Money concepts. MT5-version:
Smart Phase Box (SPB) — Indicator Description Smart Phase Box automatically locates consolidation zones (bases, flats) on the chart and analyzes the candle microstructure inside each zone — wicks, tick volume, body-to-range ratio, and where price closes relative to the zone — to estimate whether the zone looks more like accumulation (buyers absorbing supply) or distribution (sellers absorbing demand), based on classic Wyckoff / Smart Money concepts. MT4-version:
🧩 AlphaCore System MT5: https://www.mql5.com/en/market/product/152374
🧩 AlphaCore System MT4: https://www.mql5.com/en/market/product/154043
Книга Ждана Стерлинга рассказывает как маркетмейкеры бреют хомяков и как это использовать в своих целях.
https://ridero.ru/books/treiding_kak_birzhi_strigut_ovec_stan_volkom/?srsltid=AfmBOopzYTYOFjsXODyot--jNB9NNyV8iGk7Y5tNQwgdlwXLI6mf0sis
🔗 LINKS:
🧩 AlphaCore System MT5: https://www.mql5.com/en/market/product/152374
🧩 AlphaCore System MT4: https://www.mql5.com/en/market/product/154043
myfxbook.com/members/drivermql/alphacore-mt4-tickmill/11777167