RsiAver Mt5
- 지표
-
Nikolay Kositsin
 В мире, которым правят судебные приставы, не бывает и не может быть в принципе бесплатных интернет-нянек!!!
 - 버전: 1.1
- 업데이트됨: 20 8월 2022
- 활성화: 5
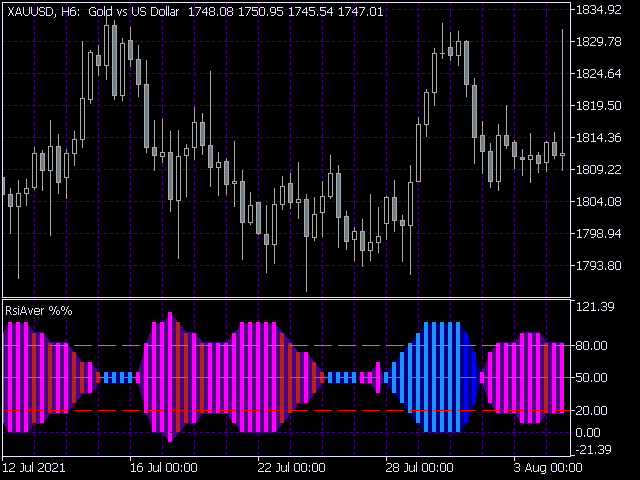
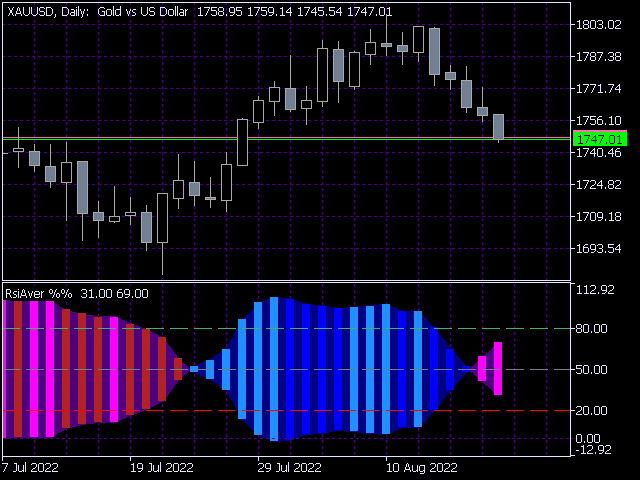
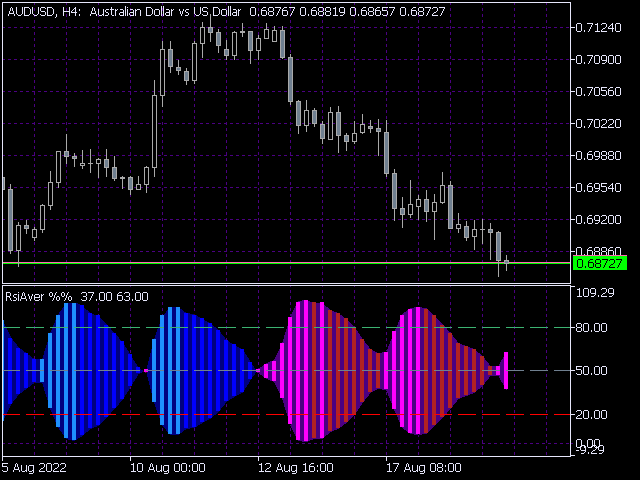
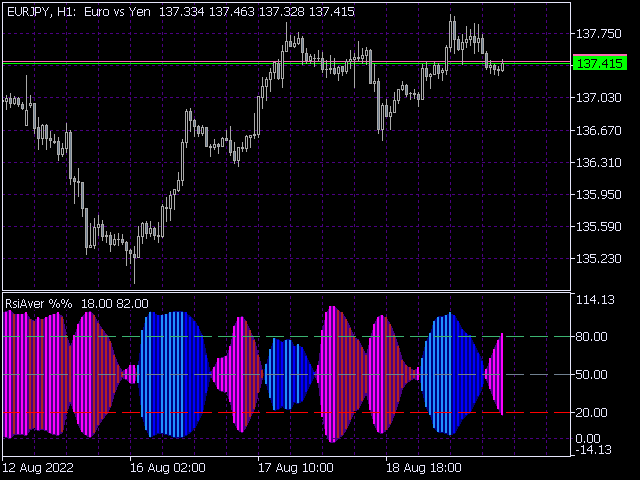
В основу алгоритма этого осциллятора положен анализ веера сигнальных линий технического индикатора RSI.
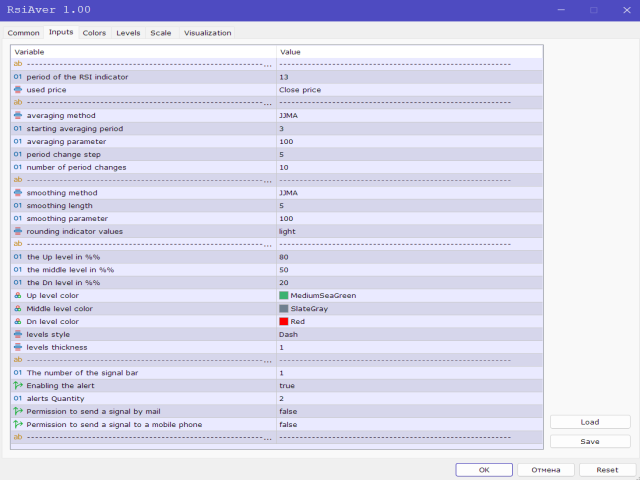
Алгоритм вычисления сигнальных линий выглядит следующим образом. В качестве исходных данных имеем входные параметры индикатора:
- StartLength - минимальное стартовое значение первой сигнальной линии;
- Step - шаг изменения периода;
- StepsTotal - количество изменений периода.
Любое значение периода из множества сигнальных линий вычисляется по формуле арифметической прогрессии:
SignalPeriod(Number) = StartLength + Number * Step,
где значение переменной Number изменяется в пределах от нуля и до StepsTotal.
Направление тренда в данном индикаторе определяется цветом гистограммы, а сила тренда - высотой баров гистограммы. Растущие бары окрашены в светлые тона, уменьшающиеся бары имеют тёмную окраску. Диапазон изменения значений индикатора от нуля и до ста процентов.
Индикатор имеет возможность подавать алерты, отправлять почтовые сообщения и push-сигналы при смене направления тренда.