Vortex MT4
- 지표
-
KEENBASE SOFTWARE SOLUTIONS
 Keenbase Trading은 트레이더가 더욱 정확하고 신뢰할 수 있는 거래 결정을 내릴 수 있도록 MetaTrader 4 및 MetaTrader 5용 전문 지표와 Expert Advisor(EA)를 개발합니다.
당사의 제품은 실전에서 활용할 수 있는 거래 로직과 직관적인 사용자 경험을 결합하여 안정성, 사용 편의성, 그리고 체계적인 리스크 관리에 중점을 두고 설계되었습니다. 모든 도구는 철저한 테스트를 거쳐 실제 시장 환경에서도 일관되고 안정적인 성능을 제공할 수 있도록 개발됩니다. - 버전: 1.1
- 활성화: 10
The Vortex Indicator was first presented by Douglas Siepman and Etienne Botes in January 2010 edition of Technical Analysis of Stocks & Commodities. Despite its based on a complex implosion phenomenon, the vortex is quite simple to interpret.
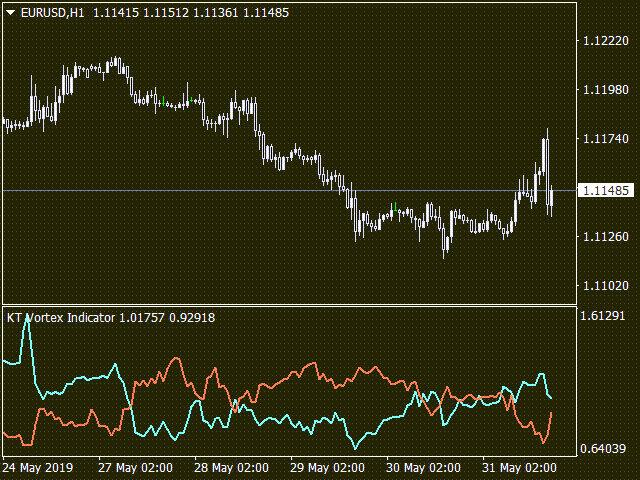
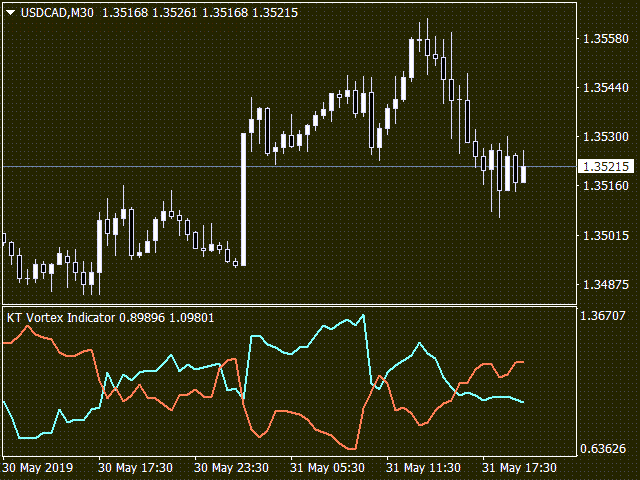
A bullish signal is generated when +VI line cross above the -VI line and vice versa. The indicator is mostly used as a confirmation for trend trading strategies.
The Vortex was inspired by the work of Viktor Schauberger, who studied the flow of water in turbines and rivers. Etienne Botes and Douglas Siepman found that movements in financial markets are similar to the vortex motion found in water.
Features
- Seamlessly pick the market trend using the position of positive and negative line concerning each other.
- It works great as a filter for trend trading strategies — only long trades when +VI line is above the -VI line and vice versa.
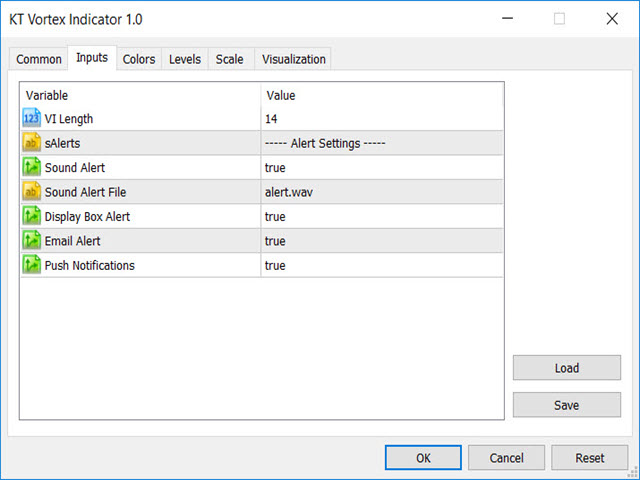
- Receive alerts on each crossover of plus VI and minus VI lines.
Vortex Formula
+VM = Current Period’s High – Previous Period’s Low (absolute value)
-VM = Current Period’s Low – Previous Period’s High (absolute value)
+VM14 = 14-period Sum of +VM
-VM14 = 14-period Sum of -VM
Calculating the true range of last 14 periods
TR14 = 14-period Sum of TR
Normalizing the positive and negative trend movement:
+VI14 = +VM14/TR14
-VI14 = -VM14/TR14