Bollinger Stop

bollinger  Stop Alert Indicator is one of the simplest trend-following indicators you may have ever experienced. Besides defining the market trends it also determines possible trend reversal points which are interpreted as trade signals. The bollinger stop can be applied to trade all kinds of forex currency pairs.

bollinger  Stop Alert Indicator suits all sorts of timeframe charts available within your forex MT4 trading platform thus supports both scalping and day trading. You can also easily customize this indicator for e-mail alerts so that you never miss a trade signal.


bollinger  Stop Alert Indicator Explanation

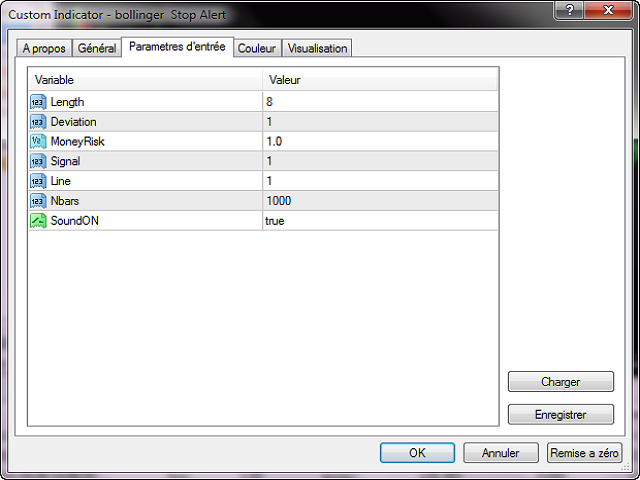
bollinger  Stop Alert uses an 8-day period price monitoring system that collects the highs and lows of the price over the selected period of time for plotting the trend signals.

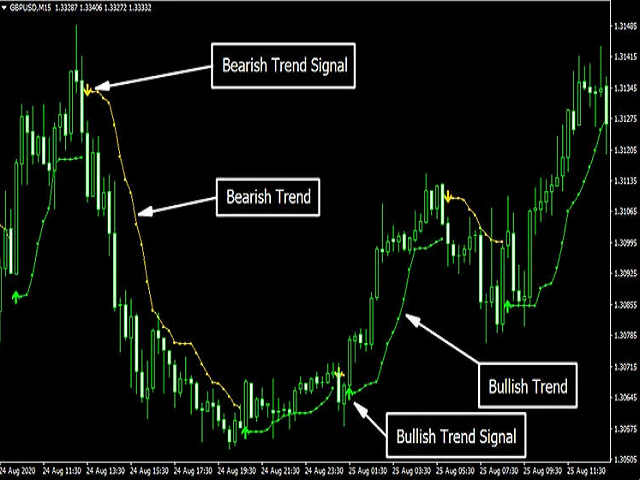
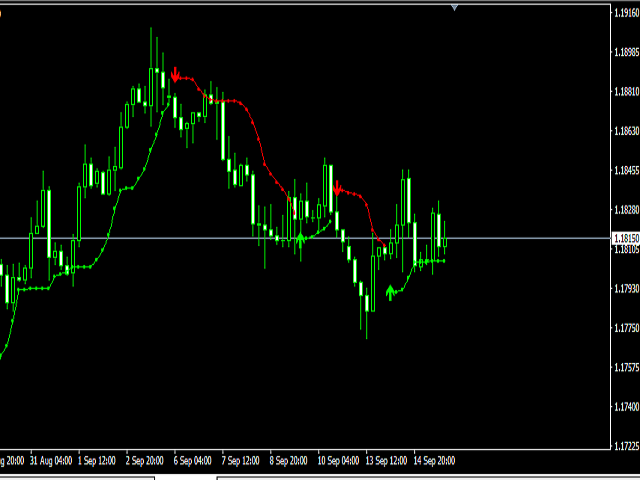
It also includes a Standard Deviation Period 1 and NBars applied to the last 1000 bars for backtesting its performance. According to the general concept, the price hits below the bollinger Stop level and keeps closing below the indicator level signals for the bearish trend of the market.

Contrarily, price moves above the bollinger Stop level and remains above the indicator level is interpreted as a bearish trend signal. For better understanding, the indicator includes arrow signals pointing to the possible direction of the upcoming trend.


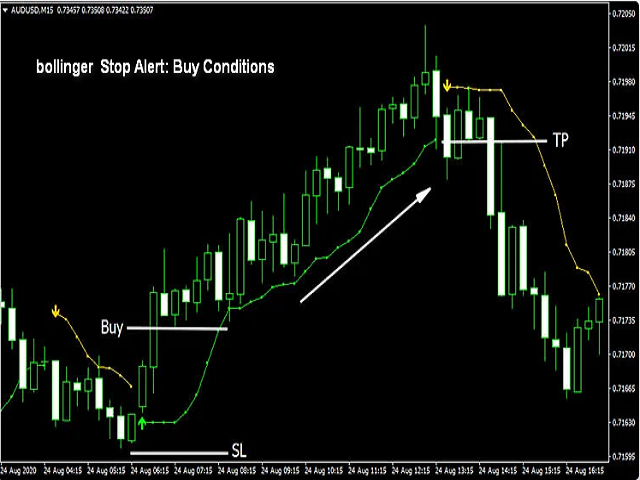
bollinger  Stop Alert: Buy Conditions

  • Price breaks above the bollinger Stop level
  • An arrow signal is plotted below the current price candle pointing upwards
  • Buy triggers after the above conditions are done
  • Set stop loss below the low of the current bollinger Stop level
  • Exit long/take profit whenever an arrow appears above the price candle pointing downwards.

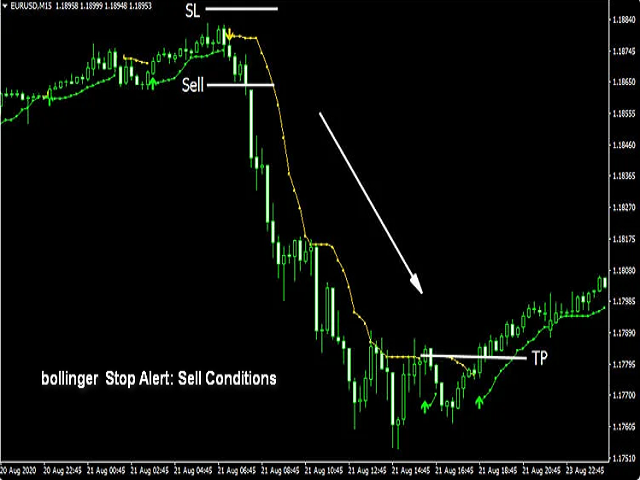
bollinger  Stop Alert: Sell Conditions

  • Price breaks below the bollinger Stop level
  • An arrow signal is plotted above the current price candle pointing downwards
  • Sell triggers after the above conditions are done
  • Set stop loss above the high of the current bolinger Stop level
  • Exit short/take profit whenever an arrow appears below the price candle pointing upwards.


추천 제품
Owl smart levels
Sergey Ermolov
4.24 (37)
MT5 버전  |   FAQ Owl Smart Levels Indicator 는   Bill Williams 의 고급 프랙탈, 시장의 올바른 파동 구조를 구축하는 Valable ZigZag, 정확한 진입 수준을 표시하는 피보나치 수준과 같은 인기 있는 시장 분석 도구를 포함하는 하나의 지표 내에서 완전한 거래 시스템입니다. 시장과 이익을 취하는 장소로. 전략에 대한 자세한 설명 표시기 작업에 대한 지침 고문-거래 올빼미 도우미의 조수 개인 사용자 채팅 ->구입 후 나에게 쓰기,나는 개인 채팅에 당신을 추가하고 거기에 모든 보너스를 다운로드 할 수 있습니다 힘은 단순함에 있습니다! Owl Smart Levels   거래 시스템은 사용하기 매우 쉽기 때문에 전문가와 이제 막 시장을 연구하고 스스로 거래 전략을 선택하기 시작한 사람들 모두에게 적합합니다. 전략 및 지표에는 눈에 보이지 않는 비밀 공식 및 계산 방법이 없으며 모든 전략 지표는 공개되어 있습니다. Owl Smart Leve
The Th3Eng PipFinite indicator is based on a very excellent analysis of the right trend direction with perfect custom algorithms. It show the true direction and the best point to start trading. With StopLoss point and Three Take Profit points. Also it show the right pivot of the price and small points to order to replace the dynamic support and resistance channel, Which surrounds the price. And Finally it draws a very helpful Box on the left side on the chart includes (take profits and Stop loss
The indicator displays the data of the Stochastic oscillator from a higher timeframe on the chart. The main and signal lines are displayed in a separate window. The stepped response is not smoothed. The indicator is useful for practicing "manual" forex trading strategies, which use the data from several screens with different timeframes of a single symbol. The indicator uses the settings that are identical to the standard ones, and a drop-down list for selecting the timeframe. Indicator Paramet
Trend Monitor
Pavel Zamoshnikov
4 (4)
The indicator generates early signals basing on ADX reading data combined with elements of price patterns. Works on all symbols and timeframes. The indicator does not redraw its signals. You see the same things on history and in real time. For better visual perception signals are displayed as arrows (in order not to overload the chart). Features Easy to use. Filter configuration only requires selection of sensitivity in the " Sensitivity of the indicator " input. Signals can be filtered using
Wave Wolf MT4
Andrei Salanevich
거래 단말기의 현재 창에 늑대 파도를 검색하여 표시하도록 설계되었습니다. 거래에 늑대 파도를 사용하는 상인을위한 훌륭한 지표. 거래 전략에서의 적용은 효율성과 수익성을 크게 증가시킬 것입니다. 표시기에 대한 정보 다른 늑대 웨이브 지표와는 달리,웨이브 고원지 외환 지표는 크게 그 효과를 증가 기능을 가지고 있습니다: 첫 번째는 열린 창 5 점 매개 변수(진정한 값)정보 지원을 제공합니다,즉 늑대 파도가 나타난 차트의 창을 확장합니다. 예를 들어,유로화 차트가 열려 있고 각각에 웨이브 월드 표시기가 설치되어있는 경우 유로화 모델이 감지되면 해당 차트가 자동으로 다른 차트의 맨 위에 포 그라운드로 가져 오므로 많은 상품을 거래 할 때 매우 편리합니다.  두 번째 기능은 맥 디에 내장 된 발산 분석,사용자가 자신을 선택할 수있는 매개 변수(기본 설정(12,26,9))입니다. 그런데 일반적인 오실레이터의 값은 작업 창에 표시되지 않으며 점을 형성 할 때 가격 라벨의 색상에만 반영됩니다
Rainbow Price Visualizer
Vincent Jose Proenca
Rainbow Price Visualizer v1.21 See where the market really breathes. Turns your MT4 chart into an ultra-precise heatmap that highlights price zones favored by big players. Why it matters 300 price levels at 0.2‑pip resolution — microscopic detail. 8 visual themes (Rainbow, Fire, Ocean…) for instant readibility. Smart opacity: low noise fades, real zones pop. Lightweight rendering with automatic cleanup. Fully customizable: saturation, opacity, resolution, history depth. Bands project into the f
Trend Oscillator mw
DMITRII GRIDASOV
Trend Oscillator - 고급 맞춤형 Crypto_Forex 지표, 효율적인 거래 도구입니다! - 고급 새로운 계산 방법 사용 - 매개변수 "계산 가격"에 대한 20가지 옵션. - 지금까지 개발된 가장 매끄러운 오실레이터. - 상승 추세는 녹색, 하락 추세는 빨간색. - 과매도 값: 5 미만, 과매도 값: 95 이상. - 이 지표로 표준 전략도 업그레이드할 수 있는 기회가 많습니다. - PC 및 모바일 알림. ................................................................................................................................................ 여기를 클릭하여 고품질 트레이딩 로봇과 지표를 확인하세요! 이 MQL5 웹사이트에서만 제공되는 오리지널 제품입니다.
Auto Fibo Pro m
DMITRII GRIDASOV
"Auto FIBO Pro" Crypto_Forex 지표 - 거래에 유용한 보조 도구입니다! - 지표는 자동으로 Fibo 수준과 로컬 추세선(빨간색)을 계산하여 차트에 배치합니다. - Fibonacci 수준은 가격이 반전될 수 있는 주요 영역을 나타냅니다. - 가장 중요한 수준은 23.6%, 38.2%, 50%, 61.8%입니다. - 역전 스캘핑이나 존 그리드 거래에 사용할 수 있습니다. - Auto FIBO Pro 지표를 사용하여 현재 시스템을 개선할 수 있는 기회도 많습니다. - Info Spread Swap Display가 있습니다. 현재 Spread와 Swap이 부착된 외환 쌍을 표시합니다. - 디스플레이에는 계정 잔액, 자본 및 마진도 표시됩니다. - 차트의 어느 모서리에서나 Info Spread Swap Display를 찾을 수 있습니다. 0 - 왼쪽 상단 모서리, 1 - 오른쪽 상단, 2 - 왼쪽 하단, 3 - 오른쪽 하단. 여기를 클릭하여 고품질 트레이딩 로봇과
Are you tired of the uncertainty that arises when your orders fail to stop at a specific line due to the spread? Look no further! Introducing our  indicator that plots candlesticks based on the Ask price instead of the traditional bid-based chart commonly used in MQL4. With this indicator, you can say goodbye to the frustrations caused by the bid-based chart, as it provides you with a more accurate representation of market movements. By utilizing the Ask price, which represents the price at whic
Trendiness Index
Libertas LLC
5 (3)
"The trend is your friend" is one of the best known sayings in investing, because capturing large trendy price movements can be extremely profitable. However, trading with the trend is often easier said than done, because many indicators are based on price reversals not trends. These aren't very effective at identifying trendy periods, or predicting whether trends will continue. We developed the Trendiness Index to help address this problem by indicating the strength and direction of price trend
PipFinite Trend PRO
Karlo Wilson Vendiola
4.88 (2248)
Breakthrough Solution For Trend Trading And Filtering With All Important Features Built Inside One Tool! Trend PRO's smart algorithm detects the trend, filters out market noise and gives entry signals with exit levels. The new features with enhanced rules for statistical calculation improved the overall performance of this indicator. Important Information Revealed Maximize the potential of Trend Pro, please visit www.mql5.com/en/blogs/post/713938 The Powerful Expert Advisor Version Automatin
Alpha Trend sign has been a very popular trading tool in our company for a long time. It can verify our trading system and clearly indicate trading signals, and the signals will not drift. Main functions: Based on the market display of active areas, indicators can be used to intuitively determine whether the current market trend belongs to a trend market or a volatile market. And enter the market according to the indicator arrows, with green arrows indicating buy and red arrows indicating se
Line Magnit
Aleksey Trenin
The LineMagnit Indicator for MT4 is a highly precise tool that builds support and resistance levels which magnetically attract prices. This feature allows traders to easily determine the most probable entry and exit points in the market, as well as identify the market's directional forces, as levels are based on capital inflows into the instrument. Equipped with an intuitively understandable graphical interface, the LineMagnit Indicator enables users to quickly locate and analyze support and res
Crypto_Forex 지표 HTF Ichimoku for MT4. - Ichimoku 지표는 가장 강력한 트렌드 지표 중 하나입니다. HTF는 - Higher Time Frame을 의미합니다. - 이 지표는 트렌드 트레이더와 가격 액션 항목과의 조합에 탁월합니다. - HTF Ichimoku 지표를 사용하면 더 높은 타임프레임의 Ichimoku를 현재 차트에 첨부할 수 있습니다. - 상승 추세 - 파란색 선 위에 빨간색 선(두 선 모두 클라우드 위에 있음) / 하락 추세 - 파란색 선 아래에 빨간색 선(두 선 모두 클라우드 아래에 있음). - 가격이 Ichimoku 클라우드 상단 테두리를 돌파했을 때만 BUY 주문을 엽니다. - 가격이 Ichimoku 클라우드 하단 테두리를 돌파했을 때만 SELL 주문을 엽니다. - HTF Ichimoku 지표는 큰 트렌드를 포착할 수 있는 기회를 제공합니다. 여기를 클릭하여 고품질 트레이딩 로봇과 지표를 확인하세요! 이 MQL5 웹사이트에서만
Noize Absorption Index MT4
Ekaterina Saltykova
5 (1)
Noize Absorption Index - is the manual trading system that measures the difference of pressure between bears forces and bulls forces. Green line - is a noize free index that showing curent situation. Zero value of index shows totally choppy/flat market.Values above zero level shows how powerfull bullish wave is and values below zero measures bearish forces.Up arrow appears on bearish market when it's ready to reverse, dn arrow appears on weak bullish market, as a result of reverse expectation. S
RSI Speed mp
DMITRII GRIDASOV
MT4용 Crypto_Forex 지표 "RSI SPEED" - 훌륭한 예측 도구, 재도색 불필요 - 이 지표는 물리학 방정식을 기반으로 계산됩니다. RSI SPEED는 RSI 자체의 1차 미분값입니다. - RSI SPEED는 주요 추세 방향으로 스캘핑 진입에 유용합니다. - HTF MA(그림 참조)와 같은 적절한 추세 지표와 함께 사용하세요. - RSI SPEED 지표는 RSI 자체의 방향이 얼마나 빨리 변하는지를 보여주며, 매우 민감합니다. - 모멘텀 거래 전략에는 RSI SPEED 지표 사용을 권장합니다. RSI SPEED 지표 값이 0보다 작으면 가격 모멘텀이 하락하고, 0보다 크면 가격 모멘텀이 상승합니다. - 모바일 및 PC 알림 기능이 내장되어 있습니다. 여기를 클릭하여 고품질 트레이딩 로봇과 지표를 확인하세요! 본 제품은 MQL5 웹사이트에서만 제공되는 정품입니다.
Laser Trend
Nicolas Zouein
The trend is your friend! This is what this indicator is all about. Follow this famous saying and be safe. Characteristics: Buy/Sell signals fixed on the close of a bar. Works on all symbols and all timeframes. Clear visual market trend laser line, Buy/Sell signal arrows, market strength meter, TP1 & TP2 boxes. Visual signals when to enter, when to exit the market. No repainting. Compatible with Flexible EA for trading automation. (Ask for a free set file optimized to perform 2010-2018) Parame
An indicator of pattern #31 ("Long Island") from Encyclopedia of Chart Patterns by Thomas N. Bulkowski. The second gap is in the opposite direction. Parameters: Alerts - show alert when an arrow appears   Push - send a push notification when an arrow appears (requires configuration in the terminal) GapSize - minimum gap size in points ArrowType - a symbol from 1 to 17 ArrowVShift - vertical shift of arrows in points   ShowLevels - show levels ColUp - color of an upward line ColDn - color of a
RenkoMaStoch
Sergey Deev
1 (1)
The indicator displays renko bars on a chart, uses them to plot the fast and slow moving average and Stochastic, as well as it provides buy/sell signals: a buy signal is generated when the fast moving is above the slow one, and the signal line of Stochastic crosses the lower level from bottom up; a sell signal is generated when the fast moving is below the slow one, and the signal line of Stochastic crosses the upper level from top to bottom; Renko is a non-trivial price display method. Instead
Crypto_Forex 지표 "Morning Star pattern" for MT4. - 지표 "Morning Star pattern"은 가격 액션 거래에 매우 강력한 지표입니다. 다시 칠할 필요 없고 지연도 없습니다. - 지표는 차트에서 강세 Morning Star 패턴을 감지합니다. 차트에 파란색 화살표 신호가 있습니다(그림 참조). - PC, 모바일 및 이메일 알림이 있습니다. - 또한 형제인 약세 "Evening Star pattern" 지표도 사용할 수 있습니다(아래 링크를 따라가세요). - 지표 "Morning Star pattern"은 지지/저항 수준과 결합하기에 매우 좋습니다. 여기를 클릭하여 고품질 트레이딩 로봇과 지표를 확인하세요! 이것은 이 MQL5 웹사이트에서만 제공되는 오리지널 제품입니다.
Trade with Gann on your side!! MASTER CIRCLE 360 CIRCLE CHART, originally created by Gann admitted that this is “The Mother of all charts”. It is one of the last studies that this great trader left for us. The numeric tab le is apparently quite simple like all the tables and is based on square numbers, the SQUARE OF 12 and is by evolution, one of the most important square numbers. Here we can find CYCLE, PRICE AND TIME thanks to angles and grades, to show past and future support and resistance.
Super Reversal Pattern
Parfait Mujinga Ndalika
Super Reversal Pattern Indicator Unlock the power of advanced pattern recognition with our Super Reversal Pattern Indicator. Designed for traders seeking precision and reliability, this indicator identifies one of the most effective reversal patterns in technical analysis, offering a significant edge in your trading strategy. Key Features: Non-Repainting Accuracy: Enjoy the confidence of non-repainting technology. Once a Super Reversal Pattern is detected, it remains static, providing consiste
메타트레이더 4(MT4)의 "두 이동평균 크로스오버" 인디케이터는 두 이동평균을 표시하고 이동평균이 서로 교차할 때 알려주는 차트 분석 도구입니다. 이 인디케이터는 두 개의 이동평균을 계산하여 표시하는데, 하나는 더 빠르고 다른 하나는 느립니다. 더 빠른 이동 평균이 더 느린 이동 평균 위로 교차하면 강세 신호로 간주되어 잠재적 인 추세 반전 또는 새로운 상승 추세의 시작을 나타냅니다. 반대로 빠른 이동평균이 느린 이동평균 아래로 교차하면 하락 신호로, 추세 반전 또는 새로운 하락 추세의 시작을 나타냅니다. 이 인디케이터는 단순이동평균(SMA), 지수이동평균(EMA), 평활이동평균(SMMA) 또는 선형가중이동평균(LWMA) 등 다양한 유형의 이동평균을 사용하도록 사용자 지정할 수 있습니다. 트레이더는 자신의 트레이딩 스타일과 선호도에 맞게 각 이동평균의 주기를 조정할 수도 있습니다. 이동 평균을 표시하는 것 외에도 인디케이터는 크로스오버가 발생하면 알림을 생성합니다. 트레이더는 크
PABT Pattern Indicator - it's classical system one of the signal patterns. Indicator logic - the Hi & Lo of the bar is fully within the range of the preceding bar, look to trade them as pullback in trend. In the way if indicator found PABT pattern it's drawing two lines and arrow what showing trend way.  - First line - it's entry point and drawing at: 1. On the high of signal bar or on middle of the signal bar (depending from indicator mode) for buy; 2. On the low of signal bar or on middle of t
ZhiBiCCI MT4
Qiuyang Zheng
[ZhiBiCCI] indicators are suitable for all cycle use, and are also suitable for all market varieties. [ZhiBiCCI] Green solid line is a reversal of bullish divergence. The green dotted line is a classic bullish divergence. [ZhiBiCCI] The solid line to the red is a reverse bearish divergence. The red dotted line is a classical bearish divergence. [ZhiBiCCI] can be set in the parameters (Alert, Send mail, Send notification), set to (true) to send instant signals to the alarm window, email, insta
"다이내믹 플로우 오실레이터"는 MT4를 위한 고급 맞춤형 암호화폐/외환 지표이자 효율적인 트레이딩 도구입니다! - 차세대 오실레이터 - 사용 방법은 그림을 참조하세요. - 다이내믹 플로우 오실레이터는 적응형 과매도/과매수 영역을 제공합니다. - 지표는 가격 및 거래량 데이터를 사용하여 과매도 및 과매수 영역을 식별합니다. - 오실레이터는 과매도/과매수 영역에서 정확한 진입 시점을 찾는 보조 도구입니다. - 과매도 값: 녹색선 아래, 과매수 값: 빨간색선 위. - 일반 오실레이터보다 훨씬 정확합니다. 적합한 시간대: M30, H1, H4, D1, W1. - PC 및 모바일 알림 기능 제공. // 훌륭한 트레이딩 로봇과 지표는 다음 링크에서 확인하실 수 있습니다: https://www.mql5.com/en/users/def1380/seller MQL5 웹사이트에서만 제공되는 오리지널 제품입니다.
Magical Arrow
Ranguni Abdulsamir Abdulmajid
Magical Arrow Indicator – Clear & Reliable Signals The Magical Arrow Indicator is a non-repainting, trend-following tool that gives you crystal-clear Buy and Sell signals . It  high-probability reversals and entries . No more guesswork – just follow the arrows on your chart! The Magical Arrow Indicator is a powerful, easy-to-use trading tool that helps you catch the most profitable Buy and Sell opportunities in the Forex market. It is designed for beginners and professional traders , giving y
Kangaroo Tailz
Brenden Caleb Luebeck
Looking for an indicator that identifies high-probability price action patterns? Love counter-trend trading? The Kangaroo Tailz indicator might be just for you. This indicator is meant to be used as a reversal detector. I personally would rather enter a position at the beginning of a trend rather than catch the last couple of moves. This indicator does a good job of alerting when price may reverse by identifying price action patterns that occur frequently in markets. Even though this indicator i
Spartan Mr Beast
Luis Mariano Vazquez Marcos
El Asesor de Experto "Spartan Mr Beast" es una herramienta avanzada y robusta diseñada para traders que buscan capitalizar las oportunidades del mercado aprovechando los rechazos de precios. Este asesor se especializa en identificar y explotar los momentos en los que el mercado muestra una resistencia o soporte significativo, sugiriendo posibles reversiones o cambios de tendencia. Características Principales: Detección de Rechazos de Mercado : "Spartan Mr Beast" utiliza algoritmos de última gene
이 제품의 구매자들이 또한 구매함
Gann Made Easy
Oleg Rodin
4.83 (150)
Gann Made Easy 는 mr.의 이론을 사용하여 최고의 거래 원칙을 기반으로 하는 전문적이고 사용하기 쉬운 Forex 거래 시스템입니다. W.D. 간. 이 표시기는 Stop Loss 및 Take Profit Levels를 포함하여 정확한 BUY 및 SELL 신호를 제공합니다. PUSH 알림을 사용하여 이동 중에도 거래할 수 있습니다. 거래 팁, 보너스, GANN MADE EA를 무료로 받으시려면 구매 후 저에게 연락주세요! 아마도 Gann 거래 방법에 대해 이미 여러 번 들었을 것입니다. 일반적으로 Gann의 이론은 초보자 거래자뿐만 아니라 이미 거래 경험이 있는 사람들에게도 매우 복잡한 것입니다. Gann의 거래 방식은 이론적으로 적용하기 쉽지 않기 때문입니다. 나는 그 지식을 연마하고 Forex 지표에 최고의 원칙을 적용하기 위해 몇 년을 보냈습니다. 표시기는 적용하기가 매우 쉽습니다. 차트에 첨부하고 간단한 거래 권장 사항을 따르기만 하면 됩니다. 지표는 지속적으로 시장
현재 20% 할인 ! 초보자 또는 전문가 트레이더를 위한 최고의 솔루션! 이 대시보드 소프트웨어는 28개의 통화 쌍에서 작동합니다. 2가지 주요 지표(Advanced Currency Strength 28 및 Advanced Currency Impulse)를 기반으로 합니다. 전체 Forex 시장에 대한 훌륭한 개요를 제공합니다. 고급 통화 강도 값, 통화 이동 속도 및 모든(9) 시간대의 28 Forex 쌍에 대한 신호를 보여줍니다. 추세 및/또는 스캘핑 기회를 정확히 파악하기 위해 차트의 단일 지표를 사용하여 전체 시장을 볼 수 있을 때 거래가 어떻게 개선될지 상상해 보십시오! 잠재적인 거래를 식별하고 확인하면서 강력한 통화와 약한 통화를 더욱 쉽게 식별할 수 있도록 이 지표에 기능을 내장했습니다. 이 표시기는 통화의 강세 또는 약세가 증가 또는 감소하는지 여부와 모든 시간대에서 수행되는 방식을 그래픽으로 보여줍니다. 추가된 새로운 기능은 현재 시장 조건 변화에 적응하는
Smc Blast Signal
Mohit Dhariwal
5 (2)
NEW YEAR 2026 SALE OFFER PRICE AT JUST 75 DOLLARS FEW COPIES ONLY From 1st Jan -5th Jan MIDNIGHT GRAB YOUR COPY ON THIS New Year EVE Full Fledged EA will also be provided in this offer along with the purchase of Indicator. Limited copies only at this price and Ea too. Grab your copy soon SMC Blast Signal with FVG, BOS and trend Breakout The SMC Blast Signal  is a  Precise trading system for Meta Trader 4 that uses Smart Money Concepts (SMC) , including Fair Value Gaps (FVG) and Break of Structu
Game Changer Indicator
Vasiliy Strukov
4.67 (9)
Game Changer는 모든 금융 상품에 사용하도록 설계된 혁신적인 추세 지표로, 메타트레이더를 강력한 추세 분석기로 탈바꿈시켜 줍니다. 이 지표는 재작성이나 지연 현상이 발생하지 않습니다. 모든 시간대에서 작동하며 추세 파악을 지원하고, 잠재적 반전 신호를 제공하며, 트레일링 스톱 메커니즘으로 활용되고, 신속한 시장 반응을 위한 실시간 알림을 제공합니다. 숙련된 투자자, 전문가, 또는 우위를 점하려는 초보자 등 누구나 이 도구를 통해 자신감과 원칙을 바탕으로, 그리고 근본적인 추세 역학에 대한 명확한 이해를 바탕으로 거래할 수 있습니다. 구매 후 바로 연락 주시면 개인 보너스를 드립니다! 강력한 지지선과 추세 스캐너 지표를 무료로 받으실 수 있습니다. 개인 메시지로 알려주세요 저는 텔레그램에서 EA나 특별 세트를 판매하지 않습니다. Mql5에서만 사용 가능하며, 세트 파일은 제 블로그에서만 볼 수 있습니다 . 사기꾼을 조심하시고 다른 사람에게서 세트를 구매하지 마세요 설정 추세
M1 Sniper
Oleg Rodin
4.89 (18)
M1 SNIPER 는 사용하기 쉬운 거래 지표 시스템입니다. M1 시간대에 맞춰 설계된 화살표 지표입니다. 이 지표는 M1 시간대 스캘핑을 위한 단독 시스템으로 사용할 수 있으며, 기존 거래 시스템의 일부로도 사용할 수 있습니다. 이 거래 시스템은 M1 시간대 거래용으로 특별히 설계되었지만, 다른 시간대에도 사용할 수 있습니다. 원래는 XAUUSD와 BTCUSD 거래를 위해 이 방법을 설계했지만, 다른 시장 거래에도 유용하다는 것을 알게 되었습니다. 이 지표의 신호는 추세 방향과 반대로 거래될 수 있습니다. 저는 지표의 신호를 활용하여 양방향으로 거래할 수 있도록 돕는 특별한 거래 기법을 알려드립니다. 이 방법은 특별한 동적 지지선과 저항선 가격 영역을 활용하는 것을 기반으로 합니다. 구매하시면 M1 SNIPER 화살표 지표를 바로 다운로드하실 수 있습니다. 또한, 아래 스크린샷에 표시된 Apollo Dynamic SR 지표는 M1 SNIPER 도구를 사용하는 모든 사용자에게 무료로
Scalper Inside PRO
Alexey Minkov
4.74 (69)
An exclusive indicator that utilizes an innovative algorithm to swiftly and accurately determine the market trend. The indicator automatically calculates opening, closing, and profit levels, providing detailed trading statistics. With these features, you can choose the most appropriate trading instrument for the current market conditions. Additionally, you can easily integrate your own arrow indicators into Scalper Inside Pro to quickly evaluate their statistics and profitability. Scalper Inside
Advanced Currency Strength28 Indicator
Bernhard Schweigert
4.91 (657)
현재 26% 할인 초보자 또는 전문가 트레이더를 위한 최고의 솔루션! 이 지표는 우리가 독점 기능과 새로운 공식을 통합했기 때문에 독특하고 고품질이며 저렴한 거래 도구입니다. 단 하나의 차트로 28 Forex 쌍의 통화 강도를 읽을 수 있습니다! 새로운 추세 또는 스캘핑 기회의 정확한 트리거 포인트를 정확히 찾아낼 수 있기 때문에 거래가 어떻게 개선될지 상상해 보십시오. 사용 설명서: 여기를 클릭  https://www.mql5.com/en/blogs/post/697384 그것이 첫 번째, 원본입니다! 쓸모없는 지망생 클론을 사지 마십시오. 더 스페셜  강력한 통화 모멘텀을 보여주는 하위 창의 화살표 GAP가 거래를 안내합니다! 기본 또는 호가 통화가 과매도/과매도 영역(외부 시장 피보나치 수준)에 있을 때 개별 차트의 기본 창에 경고 표시가 나타납니다. 통화 강도가 외부 범위에서 떨어질 때 풀백/반전 경고. 교차 패턴의 특별 경고 추세를 빠르게 볼 수 있는 다중 시간
Dynamic Forex28 Navigator
Bernhard Schweigert
4.43 (7)
Dynamic Forex28 Navigator - 차세대 외환 거래 도구. 현재 49% 할인. Dynamic Forex28 Navigator는 오랫동안 인기 있는 지표의 진화형으로, 세 가지의 힘을 하나로 결합했습니다. 고급 통화 Strength28 지표(695개 리뷰) + 고급 통화 IMPULSE with ALERT(520개 리뷰) + CS28 콤보 신호(보너스). 지표에 대한 자세한 정보 https://www.mql5.com/en/blogs/post/758844 차세대 Strength 지표는 무엇을 제공합니까?  원래 지표에서 좋아했던 모든 것이 새로운 기능과 더 높은 정확도로 강화되었습니다. 주요 기능: 독점적인 통화 Strength 공식.  모든 시간대에 걸쳐 부드럽고 정확한 강도선. 추세와 정확한 진입을 식별하는 데 이상적입니다. 역동적인 시장 피보나치 수준(시장 피보나치).  이 지표에만 있는 고유한 기능. 가격 차트가 아닌 통화 강도에 피보나치가 적용됩니다.
Trend indicator AI
Ramil Minniakhmetov
4.95 (76)
트렌드 인공 지능 지표는 실행 가능한 진입 점 및 반전 경고와 추세 식별을 결합하여 상인의 시장 분석을 향상시킬 훌륭한 도구입니다. 이 표시기는 사용자가 자신감과 정밀도로 외환 시장의 복잡성을 탐색 할 수 있도록 지원합니다 기본 신호 외에도 트렌드 인공 지능 지표는 풀백 또는 되돌림 중에 발생하는 2 차 진입 점을 식별하여 거래자가 기존 트렌드 내에서 가격 수정을 활용할 수 있도록합니다. 중요한 장점: ·작동 4 및 5 *명확한 구매 또는 판매 신호 *다시 칠하지 않습니다 *모든 자산에서 작동 나는 전보 사기에 개 또는 세트를 판매하지 않도록주의. 모든 설정은 블로그에 여기에 무료.  중요! 지침 및 보너스를 얻기 위해 구입 후 즉시 저에게 연락! 진짜 가동 감시는 뿐 아니라 나의 다른 제품 여기에서 찾아낼 수 있습니다: https://www.mql5.com/en/users/mechanic/seller&nbsp ; 설정 및 입력: 모든 자산에 대해 기본 설정을 권
Katana Scalper Pro
Yuki Miyake
5 (3)
Special Launch Offer: Available at a limited-time price to celebrate the new release. [Concept: Cutting Through the Noise] In a market filled with chaotic movements and lagging indicators, clarity is the ultimate weapon. KATANA Scalper is engineered with a singular philosophy: to cut through market noise like a precision blade. By filtering out non-essential fluctuations, it reveals the pure "Momentum Structure" hidden within the price action, allowing you to execute with surgical precision. 5
Trend Screener
STE S.S.COMPANY
4.79 (95)
트렌드 표시기, 트렌드 트레이딩 및 필터링을 위한 획기적인 고유 솔루션, 하나의 도구 안에 내장된 모든 중요한 트렌드 기능! Forex, 상품, 암호 화폐, 지수 및 주식과 같은 모든 기호/도구에 사용할 수 있는 100% 다시 칠하지 않는 다중 시간 프레임 및 다중 통화 표시기입니다. 기간 한정 특가: 지원 및 저항 스크리너 지표는 단 100달러에 평생 제공됩니다. (원래 가격 50 달러) (제안 연장) Trend Screener는 차트에 점이 있는 화살표 추세 신호를 제공하는 효율적인 지표 추세 추종 지표입니다. 추세 분석기 표시기에서 사용할 수 있는 기능: 1. 트렌드 스캐너. 2. 최대 이익 분석이 있는 추세선. 3. 추세 통화 강도 측정기. 4. 경고가 있는 추세 반전 점. 5. 경고가 있는 강력한 추세 점. 6. 추세 화살표 Trend Screener Indicator가 있는 일일 분석 예, 일일 신호 성능...등은 여기에서 찾을 수 있습니다.   여기를 클릭하십시오. L
RFI levels PRO
Roman Podpora
사전 지표       시장 반전 수준과 영역을 파악하여   가격이 해당 수준으로 되돌아올 때까지 기다렸다가 새로운 추세의 시작점에서 진입할 수 있도록 해줍니다. 즉, 추세의 끝에서 진입하는 것이 아닙니다. 그는 보여준다       반전 수준       시장이 방향 전환을 확인하고 추가적인 움직임을 형성하는 지점입니다. 이 지표는 차트를 다시 그릴 필요 없이 작동하며, 모든 금융 상품에 최적화되어 있고, 특정 금융 상품과 함께 사용할 때 최대의 잠재력을 발휘합니다.       트렌드 라인즈 프로       지시자. 모든 계측기에 적용 가능한 가역 구조 스캐너 모든 거래 상품을 자동으로 추적하고 모든 R-반전 패턴을 즉시 식별하여 LOGIC AI 신호가 이미 존재하는 위치와 기타 유용한 정보를 표시합니다. 로직 AI – 진입점을 표시해주는 도우미 시장 진입에 가장 적합한 시점을 판단하는 지능형 신호입니다. TPSproSYSTEM 알고리즘을 사용하여 가격 변동, 추세 및 주요 시장 참
GOLD Impulse with Alert
Bernhard Schweigert
4.64 (11)
이 지표는 Advanced Currency IMPULSE with ALERT  +   Currency Strength Exotics  의 2가지 제품의 슈퍼 조합입니다. 그것은 모든 시간 프레임에 대해 작동하며 8개의 주요 통화와 하나의 기호에 대한 강약의 충동을 그래픽으로 보여줍니다! 이 표시기는 금, 이국적인 쌍, 상품, 지수 또는 선물과 같은 기호에 대한 통화 강도 가속을 표시하는 데 특화되어 있습니다. 금, 은, 오일, DAX, US30, MXN, TRY, CNH 등의 진정한 통화 강도 가속(충동 또는 속도)을 표시하기 위해 9번째 줄에 모든 기호를 추가할 수 있습니다. 새로운 기본 알고리즘을 기반으로 구축되어 잠재적인 거래를 훨씬 더 쉽게 식별하고 확인할 수 있습니다. 이는 통화의 강세 또는 약세가 가속되는지 여부를 그래픽으로 표시하고 가속 속도를 측정하기 때문입니다. 자동차의 속도계처럼 생각하면 됩니다. 가속화할 때 Forex 시장에서 동일한 일이 분명히 더 빠르
Advanced Supply Demand
Bernhard Schweigert
4.91 (296)
현재 33% 할인! 초보자나 전문 트레이더를 위한 최고의 솔루션! 이 보조지표는 우리가 다수의 독창적 기능과 새로운 공식을 통합한 독특하고 고품질이며 저렴한 거래 도구입니다. 이 업데이트를 통해 이중 시간대를 표시할 수 있습니다. 더 높은 TF를 표시할 수 있을 뿐만 아니라 차트 TF와 더 높은 TF 모두를 표시할 수 있습니다: 중첩 영역 표시. 모든 Supply Demand 트레이더들이 좋아할 것입니다. :) 중요한 정보 공개 Advanced Supply Demand의 잠재력을 극대화하려면 다음을 방문하십시오. https://www.mql5.com/ko/blogs/post/720245   진입 또는 목표의 명확한 트리거 포인트를 정확히 찾아냄으로 해서 거래가 어떻게 개선될지 상상해 보십시오. 새로운 알고리즘을 기반으로 매수자와 매도자 간의 잠재적인 불균형을 훨씬 더 쉽게 분간할 수 있습니다. 왜냐하면 가장 강한 공급영역과 가장 강한 수요 영역과 과거에 어떻게 진행 되었는지를(이전
Volatility Trend System - a trading system that gives signals for entries. The volatility system gives linear and point signals in the direction of the trend, as well as signals to exit it, without redrawing and delays. The trend indicator monitors the direction of the medium-term trend, shows the direction and its change. The signal indicator is based on changes in volatility and shows market entries. The indicator is equipped with several types of alerts. Can be applied to various trading ins
Quantum Breakout Indicator PRO
Bogdan Ion Puscasu
4.96 (26)
소개       Quantum Breakout PRO   , 브레이크아웃 존 거래 방식을 변화시키는 획기적인 MQL5 지표! 13년 이상의 거래 경험을 가진 숙련된 트레이더 팀이 개발한   Quantum Breakout PRO는   혁신적이고 역동적인 브레이크아웃 영역 전략으로 거래 여정을 새로운 차원으로 끌어올리도록 설계되었습니다. Quantum Breakout Indicator는 5개의 이익 목표 영역이 있는 브레이크아웃 영역의 신호 화살표와 브레이크아웃 상자를 기반으로 한 손절 제안을 제공합니다. 초보자 거래자와 전문 거래자 모두에게 적합합니다. Quantum EA 채널:       여기를 클릭하세요 MT5 버전 :   여기를 클릭하세요 중요한! 구매 후 설치 매뉴얼을 받으려면 개인 메시지를 보내주십시오. 추천: 기간: M15 통화쌍: GBPJPY, EURJPY, USDJPY,NZDUSD, XAUUSD 계정 유형: 스프레드가 매우 낮은 ECN, Raw 또는 Razo
Trend Lines PRO
Roman Podpora
5 (1)
트렌드 라인즈 프로       이 지표는 시장이 실제로 어떤 방향으로 전환되는지 파악하는 데 도움이 됩니다. 실제 추세 반전 지점과 주요 시장 참여자들이 다시 진입하는 지점을 보여줍니다. 보시다시피       BOS 라인       복잡한 설정이나 불필요한 노이즈 없이 더 높은 시간대의 추세 변화와 주요 레벨을 확인할 수 있습니다. 신호는 차트에 다시 그려지지 않고 캔들이 마감된 후에도 계속 표시됩니다. 지표가 보여주는 내용: 실제 변화       추세(BOS 라인) 한 번 신호가 나타나면 그 신호는 계속 유효합니다! 이는 신호를 발생시킨 후 변경될 수 있는 리페인팅 방식의 지표와 중요한 차이점입니다. 리페인팅 방식의 지표는 잠재적으로 자금 손실로 이어질 수 있습니다. 이제 더욱 높은 확률과 정확도로 시장에 진입할 수 있습니다. 또한 화살표가 나타난 후 목표가(익절)에 도달하거나 반전 신호가 나타날 때까지 캔들스틱 색상이 계속 바뀌는 기능도 있습니다. 반복 항목          
Meravith
Ivan Stefanov
5 (1)
이 인디케이터는 각 지점에서 볼륨을 분석하고 해당 볼륨에 대한 시장의 피로 레벨을 계산합니다. 이 인디케이터는 세 개의 라인으로 구성됩니다: 강세 볼륨 피로 라인 약세 볼륨 피로 라인 시장 추세를 나타내는 라인. 이 라인은 시장이 강세인지 약세인지에 따라 색이 변합니다. 원하는 시작 지점에서 시장을 분석할 수 있습니다. 볼륨 피로 라인에 도달하면 다음 분석을 시작할 새 지점을 식별하세요. 트렌드와 수정 모두 분석할 수 있습니다. 좋은 접근 방법은 트렌드 라인에 도달하거나 고점 또는 저점에 도달할 때마다 인디케이터를 이동시키는 것입니다. 트렌드 라인과 볼륨 피로 라인 간의 거리가 클수록 해당 방향의 볼륨이 더 큽니다. 트렌드 라인은 주문을 열기 위한 장소로 사용할 수 있으며, 피로 라인은 수익을 얻는 데 사용됩니다. 이 시스템은 정말 독특하지만 매우 직관적입니다. 시장에는 비슷한 제품이 없습니다. 사용에 제한이 없습니다. 모든 시장과 모든 시간 프레임에서 적용할 수 있습니다. 중요:
현재 26% 할인!! 이 지표는 두 주요 지표( Advanced Currency Strength 28   &  Advanced Currency IMPULSE with ALERT )의 슈퍼 조합입니다. TICK-UNITS에 대한 통화 강도 값과 28개 Forex 쌍에 대한 경고 신호를 보여줍니다. 11개의 다른 틱 단위를 사용할 수 있습니다. 1, 2, 3, 4, 5, 6, 10, 12, 15, 20, 30초입니다. 두 번째 타이머 내에 최소 1틱이 있으면 하위 창의 Tick-Unit 막대가 표시되고 왼쪽으로 이동합니다. 단 하나의 차트로 28 Forex 페어를 스캘핑할 수 있습니다! 스캘핑 기회의 정확한 트리거 포인트를 정확히 찾아낼 수 있기 때문에 스캘핑이 어떻게 개선될지 상상해 보십시오. 그것은 1분보다 낮은 기간에 작동하는 시장의 첫 번째 통화 강도 지표입니다! 그것은 시장에 빠르게 들어오고 나가고 시장에서 작은 핍을 잘라내기를 원하는 빠른 스캘퍼를 위한 것입니다. 사
Currency Strength Exotics
Bernhard Schweigert
4.88 (33)
현재 20% 할인! 초보자 또는 전문가 트레이더를 위한 최고의 솔루션! 이 표시기는 Exotic Pairs Commodities, Indexes 또는 Futures와 같은 기호에 대한 통화 강도를 표시하는 데 특화되어 있습니다. 금, 은, 석유, DAX, US30, MXN, TRY, CNH 등의 진정한 통화 강도를 보여주기 위해 9번째 줄에 모든 기호를 추가할 수 있습니다. 이것은 독특하고 고품질이며 저렴한 거래 도구입니다. 우리는 많은 독점 기능과 새로운 공식을 통합했습니다. 새로운 추세 또는 스캘핑 기회의 정확한 트리거 포인트를 정확히 찾아낼 수 있기 때문에 거래가 어떻게 개선될지 상상해 보십시오. 사용 설명서: 여기를 클릭 https://www.mql5.com/en/blogs/post/708876 모든 시간대에 작동합니다. TREND를 빠르게 확인할 수 있습니다! 새로운 기본 알고리즘을 기반으로 설계되어 잠재적인 거래를 더욱 쉽게 식별하고 확인할 수 있습니다. 8개의
Apollo SR Master
Oleg Rodin
5 (1)
Apollo SR Master는 지지/저항 구간에서의 거래를 더욱 쉽고 안정적으로 만들어 주는 특수 기능을 갖춘 지지/저항 지표입니다. 이 지표는 지역 가격의 고점과 저점을 감지하여 시간 지연 없이 실시간으로 지지/저항 구간을 계산합니다. 새롭게 형성된 저항 구간을 확인하기 위해 지표는 해당 저항 구간을 실제 매도 또는 매수 신호로 활용할 수 있음을 나타내는 특수 신호를 표시합니다. 이 경우, 저항 구간의 강도가 높아지고, 따라서 저항 구간에서의 성공적인 거래 가능성도 높아집니다. 이것이 바로 이 지표의 핵심 아이디어입니다. SR 존은 손절매와 이익실현을 더욱 쉽게 할 수 있도록 해줍니다. 신호 방향에 따라 SR 존 위 또는 아래 공간을 손절매로 활용할 수 있습니다. 또한, 반대쪽 SR 존은 잠재적 이익실현 영역으로 활용할 수 있습니다. 또한 Apollo SR Master 지표를 사용하는 모든 사용자에게 "Apollo Price Action System" 지표를 무료로 제공합니다.
Day Trader Master
Oleg Rodin
5 (15)
Day Trader Master 는 데이 트레이더를 위한 완벽한 거래 시스템입니다. 시스템은 두 개의 지표로 구성됩니다. 하나의 지표는 매수 및 매도를 위한 화살표 신호입니다. 얻을 수 있는 화살표 표시기입니다. 2차 지표를 무료로 드립니다. 두 번째 지표는 이러한 화살표와 함께 사용하도록 특별히 설계된 추세 지표입니다. 표시기는 반복하지 않고 늦지 않습니다! 이 시스템을 사용하는 것은 매우 간단합니다. 2색 선으로 표시되는 현재 추세 방향의 화살표 신호를 따라가기만 하면 됩니다. 파란색은 구매 추세입니다. 빨간색은 판매 추세입니다. 파란색 화살표는 매수 신호입니다. 빨간색 화살표는 매도 신호입니다. 추세선의 색상과 일치하려면 화살표의 색상과 신호의 방향이 필요합니다. 화살표 표시기는 주로 시간 간격 M5 및 M15에서 일중 거래를 위해 만들어졌습니다. 그러나 기술적으로 시스템은 다른 시간 간격으로 사용할 수 있습니다. 표시기에는 PUSH 메시지 기능이 있는 팝업 경고가 장착되어 있
SMC Easy Signal
Mohamed Hassan
4.73 (15)
3 copies left at $65, next price is $120 SMC Easy Signal was built to remove the confusion around the smart money concept by turning structural shifts like BOS (Break of Structure) and CHoCH (Change of Character) into simple buy and sell trading signals. It simplifies market structure trading by automatically identifying breakouts and reversals as they happen, allowing traders to focus on execution rather than analysis. Whether the market is continuing its trend or preparing to reverse, the i
BlueDigitsFx Easy 1 2 3 System
Ziggy Janssen
4.87 (299)
MT5 버전은 여기에서 이용 가능합니다: https://www.mql5.com/en/market/product/50048 텔레그램 채널 & 그룹: https://t.me/bluedigitsfx V.I.P 그룹 접속: 유료 제품 구매 증빙을 메시지로 보내주세요 추천 브로커: https://bit.ly/BlueDigitsFxStarTrader BlueDigitsFx Easy 123 System — MT4용 강력한 반전 및 돌파 감지 시스템 초보자와 전문가 모두를 위한, 시장 구조 변화, 돌파 및 추세 반전을 쉽고 명확하게 감지할 수 있는 올인원 논리 재도색 방지(Non-Repaint) 인디케이터입니다. 이 인디케이터는 "123" 패턴을 따릅니다: 1단계: 잠재적 과매수/과매도 지점에서 큰 화살표로 새로운 고점 또는 저점을 식별 2단계: 구조가 깨졌음을 신호로 보내 추세 반전 가능성을 확인 3단계: 작은 화살표와 지지/저항 점으로 진입 신호를 확정 참고: 큰 화살표는 봉이 종료될
캔들의 종가를 예측하는 지표입니다. 지표는 주로 D1 차트에서 사용하기 위한 것이. 이 지표는 전통적인 외환 거래와 바이너리 옵션 거래 모두에 적합합니다. 지표는 독립형 거래 시스템으로 사용하거나 기존 거래 시스템에 추가로 사용할 수 있습니다. 이 표시기는 현재 양초를 분석하여 양초 본체 내부의 특정 강도 요인과 이전 양초의 매개변수를 계산합니다. 따라서 지표는 시장 움직임의 추가 방향과 현재 양초의 종가를 예측합니다. 이 방법 덕분에 지표는 단기 및 중장기 거래 모두에 적합합니다. 지표를 사용하면 시장 상황을 분석하는 동안 지표가 생성할 잠재적 신호의 수를 설정할 수 있습니다. 표시기 설정에는 이를 위한 특별한 매개변수가 있습니다. 또한 인디케이터는 새로운 신호에 대해 차트의 메시지 형태, 이메일 및 PUSH 알림 형태로 알릴 수 있습니다. 구매 후 저에게 꼭 써주세요! 나는 당신에게 지표와 거래에 대한 나의 추천을 줄 것입니다! 또한 보너스를 받으세요!
추측을 멈추세요. 통계적 우위로 트레이딩을 시작하세요. 주식 지수는 외환과 다르게 거래됩니다. 정해진 세션이 있고, 야간에 갭이 발생하며, 예측 가능한 통계적 패턴을 따릅니다. 이 지표는 DAX, S&P 500, 다우존스와 같은 지수를 자신 있게 거래하는 데 필요한 확률 데이터를 제공합니다. 무엇이 다른가 대부분의 지표는 무엇이 일어났는지 보여줍니다. 이 지표는 다음에 무엇이 일어날 가능성이 있는지 보여줍니다. 매 거래일마다 지표는 100일간의 과거 데이터를 기준으로 현재 설정을 분석합니다. 유사한 갭, 유사한 시가 위치를 가진 날을 찾고, 가격이 주요 레벨에 도달한 빈도를 정확히 계산합니다. 갭이 메워질지, 어제 고점이 테스트될지 더 이상 추측할 필요가 없습니다. 실제 데이터에 기반한 정확한 백분율을 얻게 됩니다. 모든 입력 설명이 포함된 전체 매뉴얼: https://www.mql5.com/en/blogs/post/766370 훌륭한 설정을 찾는 데 도움이 되는 전략 가이드: ht
PZ Mean Reversion MT4
PZ TRADING SLU
3 (4)
평균 회귀 거래에 대한 전문적이고 정량적인 접근 방식을 구현하는 고유한 지표입니다. 이는 가격이 예측 가능하고 측정 가능한 방식으로 평균으로 전환되고 반환된다는 사실을 이용하여 비정량적 거래 전략을 훨씬 능가하는 명확한 진입 및 퇴장 규칙을 허용합니다. [ Installation Guide | Update Guide | Troubleshooting | FAQ | All Products ] 명확한 거래 신호 놀랍도록 쉬운 거래 사용자 정의 가능한 색상 및 크기 성능 통계 구현 대부분의 거래 전략을 능가합니다. 적절한 SL 및 TP 레벨을 표시합니다. 이메일/음향/시각 알림을 구현합니다. 작동 원리 이 지표는 더 높은 기간에서 완전히 사용자 정의 가능한 이동 평균 주변의 표준 편차를 측정하고 추세 추종 접근 방식을 사용하여 정확하게 거래를 찾습니다. 거래는 현재 차트의 가격 동작을 살펴보고 선택한 더 높은 기간에서 계산된 평균 가격대로 가격이 돌아오면 닫힙니다. 코딩 방식 때문에 지
PZ Divergence Trading
PZ TRADING SLU
5 (2)
Unlock hidden profits: accurate divergence trading for all markets Tricky to find and scarce in frequency, divergences are one of the most reliable trading scenarios. This indicator finds and scans for regular and hidden divergences automatically using your favourite oscillator. [ Installation Guide | Update Guide | Troubleshooting | FAQ | All Products ] Easy to trade Finds regular and hidden divergences Supports many well known oscillators Implements trading signals based on breakouts Display
FX Power MT4 NG
Daniel Stein
4.95 (20)
FX Power: 통화 강세 분석으로 더 스마트한 거래 결정을 개요 FX Power 는 어떤 시장 상황에서도 주요 통화와 금의 실제 강세를 이해하기 위한 필수 도구입니다. 강한 통화를 매수하고 약한 통화를 매도함으로써 FX Power 는 거래 결정을 단순화하고 높은 확률의 기회를 발견합니다. 트렌드를 따르거나 극단적인 델타 값을 사용해 반전을 예측하고자 한다면, 이 도구는 귀하의 거래 스타일에 완벽히 적응합니다. 단순히 거래하지 말고, FX Power 로 더 스마트하게 거래하세요. 1. FX Power가 거래자에게 매우 유용한 이유 통화와 금의 실시간 강세 분석 • FX Power 는 주요 통화와 금의 상대적 강세를 계산하고 표시하여 시장 역학에 대한 명확한 통찰력을 제공합니다. • 어떤 자산이 앞서고 있고 어떤 자산이 뒤처지는지 모니터링하여 보다 현명한 거래 결정을 내릴 수 있습니다. 포괄적인 멀티 타임프레임 뷰 • 단기, 중기 및 장기 타임프레임에서 통화와 금의 강세를
Hidden Cycles
Lev Vladimirovic Marushkin
5 (1)
Christmas Sale! – The Only 100% Universal Tool Grab Hidden Cycles for only $129 (regular price $179). Stop trading against nature! This is your chance to secure the only indicator rooted in the absolute laws that govern the entire universe. Most tools guess—this one reveals the truth. Offer ends soon — Buy another toy or buy the truth. Your choice... Based on Universal Laws — NOT Some Guy’s Algorithm: Let the market adjust to the Hidden Cycles Geometry — not the other way around. Most indicat
제작자의 제품 더 보기
MaxProfitDZ
Hafis Mohamed Yacine
5 (1)
Expert adviser MaxProfitDz v1.3   Recommendations EA Settings : Use  setting below  Time Frame :1M. Brokers : ALL  brokers, low spread/commission Minimum Deposit Recommended  : $500 USD Lot Size for 500$   :     0.01 Use a broker with good execution and with a  low spread  . A very fast VPS is required Parameters MMType :2 LotMultiplikator = 1.0 LotConst_or_not = TRUE Take profit : 5---20 pips  for accounts with five-digit Take profit is 50---200 pips Step : 40 pips        for accounts with f
MaxProfitDz v4
Hafis Mohamed Yacine
MaxProfitDZ Expert adviser MaxProfitDz v1.4     Recommendations Symbol: ALL PAIRS ..i Recommended    EURUSD. Time Frame:1M. Brokers: ALL brokers .  low spread/commission, 1:500 leverage Minimum Deposit Recommended :   $500 USD  Lot Size for 500$   : 0.01  Use a broker with good execution and with a spread of 0.1-2 points. A very fast VPS is required Parameters EA TrendON=true (Read the  note ) MMType = 2 LotMultiplikator = 1 LotConst_or_not = TRUE Take profit :5-10 pips  for accounts with five
CloseDelet Orders
Hafis Mohamed Yacine
CloseDelet_Orders CloseAtProfit is an EA that I use only to close orders after defined profit, or loss,  close all orders  ,  also delete pending orders.  I am using it in live trading.  The speed of closing depends on time when it trades, on broker you are using and symbols you are trading. INPUTS: win_USD_All   =    close all orders (sell+buy)  when the profit is greater than defined profit to close; win_USD_BUY =    close only orders buy   when the profit is greater than defined profit to cl
GridProfit
Hafis Mohamed Yacine
Grid Profit  Grid Profit EA Working with all pairs. TimeFrame - 5-15-30-1H Minimum Deposit Recommended : $1000 USD lot 0.01  Grid Profit EA  V 1.00  would probably come about in the event the volatility to your commodity begins to diminish. In the case some sort of examine benefits are generally in the beginning to travel sideways, that ATR profit would probably figure out how to drop off of. This can trigger that trailing terminate to travel in excess since examine benefits began to be way
Trend MagicX
Hafis Mohamed Yacine
A trending market is one in which price is generally moving in one direction. ... When trading a trend-based strategy, traders usually pick the major currencies as well as any other currency utilizing the dollar because these pairs tend to trend and be more liquid than other pairs.  Best Trend Indicator That Tells You the Direction of the Trend   Trend MagicX_v1.1 displays the trend direction, duration, intensity and the resulting trend rating for all time frames in real time. You'll see at a
MA Cross Signal Alerts
Hafis Mohamed Yacine
MA Cross Signal Alerts_v1.0 The Moving Average Cross displays a fast and a slow moving average (MA). A signal arrow is shown when the two MAs cross. An up arrow is displayed if the fast MA crosses above the slow MA and a down arrow is given if the fast MA crosses below the slow MA. The user may change the inputs (close), methods (EMA) and period lengths.  When two Moving Averages cross the indicator will alert once per cross between crosses and mark the cross point with down or up arrow. Ale
Modify SELL orders
Hafis Mohamed Yacine
Modify SELL orders v1.0    Managing Orders   During trading, you may need to modify   orders, i.e.   to change stop levels or  take profit. This can be done with one click with  the script Modify SELL orders v1.0 The script modifies all orders (market )  with specified Take Profit and Stop Loss.(pip or price) If the take profit or(and) stop loss is incorrect, then the value is not changed. Parameters script : Take Profit (PIP) Stop Loss (PIP) Take Profit (price) Stop Loss (price)
Modify BUY order
Hafis Mohamed Yacine
Modify BUY orders_v1.0 Managing Orders   During trading, you may need to modify   orders, i.e.   to change stop levels or  take profit. This can be done with one click with  THE SCRIPT Modify BUY orders v1.0 The script modifies all orders (market )  with specified Take Profit and Stop Loss.(pip or price) If the take profit or(and) stop loss is incorrect, then the value is not changed. Parameters SCRIPT; Take Profit (PIP) Stop Loss (PIP) Take Profit (price) Stop Loss (price)
Bollinger Bands Alert
Hafis Mohamed Yacine
Bollinger Bands are a very common indicator in the world of online trading, this indicator gives very useful information for many forex trading strategies, but also for all other styles of strategies such as scalping and even trading medium and long term. It is calculated from a moving average calculated over n periods (20 by default). From this moving average, a standard deviation calculation is defined. By adding this standard deviation in real time to the basic moving average, we obtain the u
CandleEA1
Hafis Mohamed Yacine
Expert adviser candle_EA1_DZ1 The pending order strategy has gained high popularity among Forex traders. This situation was caused by the high efficiency of such a work tactic, which allows to reduce the psychological pressure on the market participant and to open profitable positions in the situation of the sharp price changing.   EA Settings: Use default settings  Symbol :  Recommended   EURUSD. Time Frame:   15-30 -    Recommended  1h Deposit Recommended : $1000 USD for lout 0.10 Use a brok
Triploea
Hafis Mohamed Yacine
TRIPLO EA Working with all pairs. TimeFrame - 5-15-30-1H Minimum Deposit Recommended : $1000 USD lot 0.01  TRIPLO EA  V 1.00  would probably come about in the event the volatility to your commodity begins to diminish. In the case some sort of examine benefits are generally in the beginning to travel sideways, that ATR profit would probably figure out how to drop off of. This can trigger that trailing terminate to travel in excess since examine benefits began to be way less hazardous. would pro
Green Zone
Hafis Mohamed Yacine
Zone Recovery Hedging Strategy What to do when the market goes against you? No matter how good you are at taking the entry points, no matter how good you are at predicting the market, it is a matter of time before the market goes against your trade. What do you do when the market goes against you? Do you just take the loss and try to recover the loss later from other trades? Or, do you just sit there and watch in dismay as this one bad trade eats up your hard earned profit and the money you inv
Profit XHunter
Hafis Mohamed Yacine
Many traders, especially the beginners, get tired of manual trading and start using robots. Of course, advertising plays a significant role in choosing the algorithm. Often, system and EA vendors hide information about their product until the customer buys it. Profit Hunter EA is no exception, so in our review we will try to find out whether this robot is efficient or you should better search for its counterparts. Profit Hunter EA  A variation of the "martingale" technique used in the EA is a
Market XVolatility
Hafis Mohamed Yacine
Market Volatility Why Use Volatility Indicators For Options? Binary options traders can profit from volatility indicators more than traders of conventional assets. There are two main reasons for this statement: Some Trades Win On Volatility Alone Traders of conventional assets are unable to win a trade on volatility alone. Stock traders, for example, can use volatility indicators as one factor in the decision-making process, but volatility indicators say little about whether an asset’s price wi
XVolatility Alert
Hafis Mohamed Yacine
Market XVolatility  /   is an indicator that analyzes and visualizes momentum and price strength. The MXV is a confirmation indicator that analyzes buying and selling pressure by looking at price movements and whether volume is falling or rising. Therefore, the MXV is used by trend-following traders who want to know if a trend is strong enough to enter and by counter-trend traders who look to fade trends. RED  color in up  A red color means that there is indecision in the market and that price
Opposite market
Hafis Mohamed Yacine
Opposite market “Always go with the trend. Education is imparting of information to the mind and the shaping of the mind and of the personality” – Richard Weaver When many of us started trading Forex several years ago there was very little information about Forex trading systems available on the Internet. But thanks to the internet, we can now download this strategies that are inculcated within this different systems  Opposite market V.1.0, will surely give you what you desire for you investme
MatrixEA
Hafis Mohamed Yacine
///  Trade smart Good profit And continuous with low risk /// Matrix EA Working with all pairs.   TimeFrame - 1m Deposit Recommended :  If you have an account under $ 100-200, it is best to work with a         Micro account lot=0.1   MICRO  If you have an account under $ 500, it is best to work with a               Micro account lot=0.2  MICRO If you have an account  standard  with 1000  $ , it is best to work with a          lot=0.01    ///  Trade smart Good profit And continuous with
AutoPivot
Hafis Mohamed Yacine
This indicator will draw monthly, weekly, and daily pivot. Pivot line will be calculated automatically again when the period ends. Auto Pivot Metatrader 4 Indicator The Auto Pivot indicator for Metatrader 4 automatically updates the pivot point (PP), support (S1,S2,S3) and resistance levels (r1,r2,r3) every day. Price above the pivot point means positive while price below the pivot point means negative. S3 indicates extremely oversold while price above resistance r3 means extremely overbought.
Supply Demand
Hafis Mohamed Yacine
While most traders use various technical indicators, the price action is basically determined by the buying and selling activity. This is how support and resistance levels, which are commonly used terms in technical analysis is formed. Traders know that when price reaches a support level, price can bounce off this support. This is also known as a level where this is high demand. A high demand area forms when there are more buyers than sellers. In trading, investors tend to buy at the support
TripleStoch Divergence
Hafis Mohamed Yacine
The "Preface" Input-      Broker time is required by the code that features PivotsTz and vLines.  When data feed      is live the broker time is available.  When data feed is not live it is not available.      The purpose of this "Preface" section is to find and input the Clock location that has      the same time as the broker server.  Then, even without live data feed we will still      have the equivalent of the broker server time to work with, generated by the Clock, and      the PivotsTz
FIBOChannels
Hafis Mohamed Yacine
Fibonacci Channel What is a Fibonacci Channel? The Fibonacci channel is a technical analysis tool that is used to estimate support and resistance levels based on the Fibonacci numbers. It is a variation of the Fibonacci retracement tool, except with the channel the lines run diagonally rather than horizontally. It can be applied to both short-term and long-term trends, as well as to uptrend and downtrends. Lines are drawn at 23.6, 38.2, 50, 61.8, 78.6, 100, 161.8, 200, 261.8, 361.8 and 423.6 p
CurrencySt Alerts
Hafis Mohamed Yacine
CurrencySt Alerts  Metatrader 4 Forex Indicator The CurrencySt Alerts  MT4 forex indicator displays the trend strength for the 8 major currencies: NZD, EUR, GBP, USD, JPY, AUD, CAD and CHF. It ranks the 8 currencies from very strong to very weak in a table directly visible on the MT4 activity chart. How to trade with the Currency Strength indicator? As a general rule, always trade the strongest currency versus the weakest currency. For example, as shown in the NZD/USD chart below, the NZD
Levels ATR
Hafis Mohamed Yacine
The ATR Levels Indicator For MT4 is an indicator that is built specifically for traders who use the Meta Trader 4 for their trading analysis, charting of different currency pairs and trading assets, doing their technical analysis and making trading decisions all through the trading day as they work. One of the first major advantages of using the ATR Levels Indicator For MT4 is that it automatically helps the trader to spot very important levels in the markets based on the Average True Range Ind
Dynamic channel
Hafis Mohamed Yacine
DYNAMIC CHANNEL Forex is a Metatrader 4 (MT4 (MT4)) indicator and the essence of this technical indicator is to transform the accumulated historical data. Forex DYNAMIC CHANNEL Indicator provides for an opportunity to detect various peculiarities and trends in price dynamics which are invisible to the naked eye. Based on this information, traders can assume further price movements and adjust their strategy accordingly. Dynamic channel, which is calculated based on the maximum distance between
Currency StrengtT
Hafis Mohamed Yacine
What Is Currency StrengtT Indicator? A currency strengthT indicator is a graphical tool that shows the strength of a currency. Common indicators usually show the strength of a currency in relation to another currency, however, with some calculations it is possible to find the absolute strength of each individual currency. Therefore, a currency strength matrix indicator (or meter) is a tool that tries to express the absolute strength of a currency, so that you can compare this strength with the
Action Alerts
Hafis Mohamed Yacine
Action Alert    indicator  generates and writes data on the chart when performing any modification to the dead process. Expertise Properties: An audible alert is issued in the name of the operation and the labor that has been made You only need one chart Writes the processed operations in clear handwriting The font color can be controlled on the chart Setting  Action Alert    indicator  What is meant by it is to alert me any change in my deals of , it will reverse if any new deal comes out, al
MA Cross Alerts
Hafis Mohamed Yacine
MA Cross Signal Alerts MA Cross Signal Alerts_v2.0 The Moving Average Cross displays a fast and a slow moving average (MA). A signal arrow is shown when the two MAs cross. An up arrow is displayed if the fast MA crosses above the slow MA and a down arrow is given if the fast MA crosses below the slow MA. The user may change the inputs (close), methods (EMA) and period lengths.  When two Moving Averages cross the indicator will alert once per cross between crosses and mark the cross point with
Multip RSA
Hafis Mohamed Yacine
The EA  use a strategy of the Relative Strength Index (RSI)  RSI Expert Advisor automatically analyzes RSI-values. Each time the RSI comes from the overbought zone crossing the given upper level the robot will open sell-orders automatically. The lot-size will be increased exponentially with the editable multiplier. If the RSI enters the oversold zone all open sell-orders will be closed. This strategy is used in long- and short direction. Basic EA settings are already configured for EURUSD (1h)
Stochastic EA mt
Hafis Mohamed Yacine
About the Stochastic Oscillator The Stochastic Oscillator Indicator was developed in the late 1950s by Dr. George Lane . The term stochastic refers to the point of a current price in relation to its price range over a period of time. The stochastic oscillator show 2 lines (Main and Signal line) and s support and resistance level. He is included in Metatrader. The default settings are: K% 5, D% 3 Slowing 3 Trade logic of this forex robot The Stochastic Oscillator EA is a forex robot based on the
Hedgeuptodown
Hafis Mohamed Yacine
What Is Hedging as It Relates to Forex Trading? Hedging with forex is a strategy used to protect one's position in a currency pair from an adverse move. It is typically a form of short-term protection when a trader is concerned about news or an event triggering volatility in currency markets. There are two related strategies when talking about Hedge forex pairs in this way. One is to place a hedge by taking the opposite position in the same currency pair, and the second approach is to buy forex
필터:
리뷰 없음
리뷰 답변