CloseBy BreakEven MT4

The script allows to close part of opened position if this position has some profit.

You just need to drop this script on the chart with a desired currency pair. 

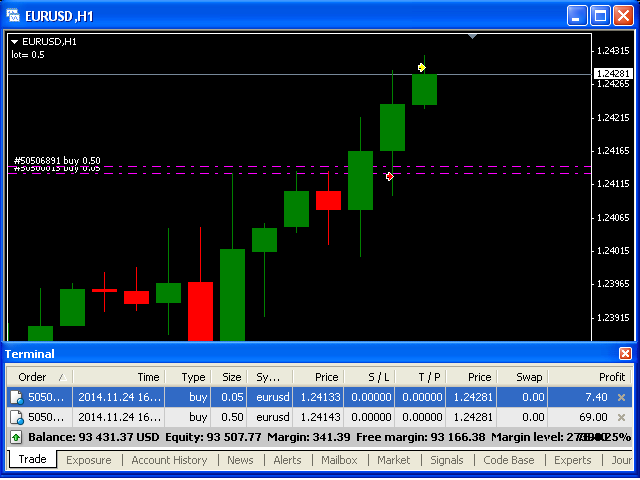
Let's say you have 1 lot for a Long position with positive profit. With this script you can close any part of the 1 lot (input parameter LotCoeff from 0.1 to 0.9) and remain (for example, 0.4 lot) will have a BreakEven StopLoss.

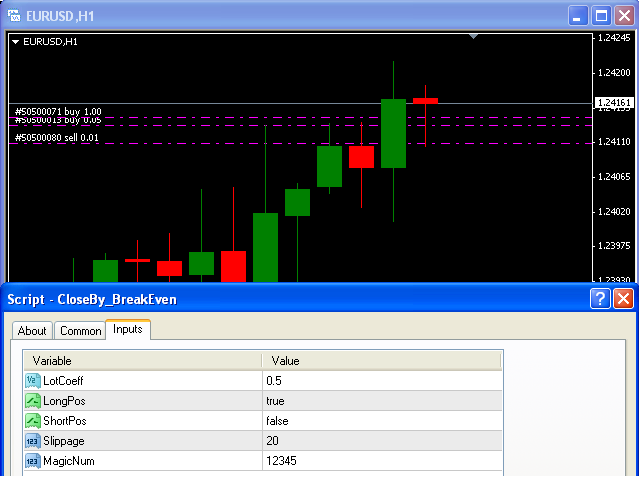
Before placing an opposite orders, the input window is opened allowing you to modify all input parameters: 

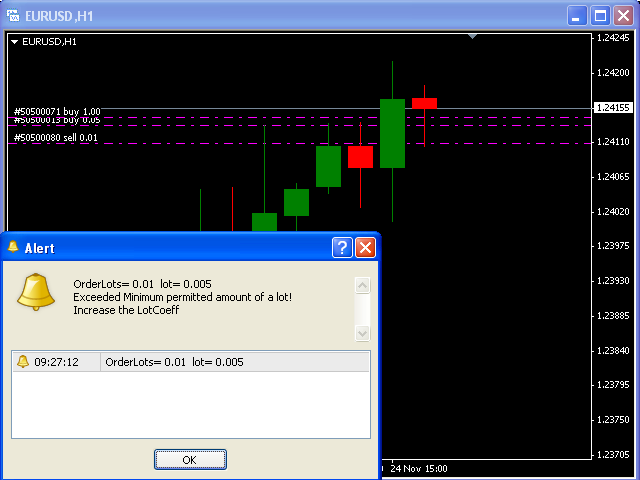
  • LotCoeff    = 0.5; // from 0.1 to 0.9;
  • LongPos     = true; // if TRUE only Long position from the current currency pair will be search and update;
  • ShortPos    = false; // if TRUE onlyShort position from the current currency pair will be search and update;
  • Slippage    = 20;
  • MagicNum  = 12345.

Attention: You have to Allow automated trading on the Expert Advisors tab (Tools->Options). In the input window, you have to allow auto trading.

추천 제품
Candlestick Pattern Scanner is a multi-timeframe and multi-symbol dashboard and alert system that checks all timeframes and currency pairs for different candlestick patterns that are formed in them. Scanner is integrated with support and resistance zones so you can check the candlestick patterns in the most important areas of the chart to find breakout and reversal patterns in the price chart. Download demo version   (works on M30,D1,W1 timeframes and 20 symbols of Market Watch window) Read the
TradePilot
Hossein Khalil Alishir
TradePilot Expert Advisor (EA) for MetaTrader 4 TradePilot is a professional and user-friendly Expert Advisor (EA) for MetaTrader 4 (MT4) . It simplifies automated trading , risk management , and trade execution using a smart trading panel . Perfect for beginners and experienced traders looking for a reliable trade manager EA with automated lot size calculation . Key Advantages User-Friendly Trading Panel: Customizable panel with buttons and hotkeys. Smart Risk Management: Supports percen
Candle finder robot MT4 Candle finder robot is one of the trading assistant tools that helps the trader, this tool helps the trader to examine all the currency pairs that are in the Metatrader watch list in detail within a few seconds. Find the desired signals. According to the strategy that is defined for this robot, in your watch list, it carefully looks for trend change candles, there are many trend change candles that traders use in their trading decisions. This robot can simply check all t
Fast Trade Copier
Volodymyr Hrybachov
4.2 (5)
The trade copier is designed for a fast and accurate copying of orders between the MetaTrader 4 terminals. The trade copier copies trades from the Master account to the Slave account by writing information to the total file, which is located in the common directory of the MetaTrader 4 terminals. This allows the trade copier to either customize various schemes for receiving and transmitting trade signals by changing the file name. Reading and writing the copier file is performed by timer. The tra
MT4에 전용 마진 열이 없어서 불편하셨나요? 이제 더 이상 걱정하지 마세요! 이 마진 모니터는 바로 여러분이 기다려왔던 것입니다. 드디어! 각 포지션별 마진을 계산하기 위해 복잡하고 시간이 많이 소요되는 계산을 할 필요가 없습니다. 이제 이 간단한 지표를 통해 각 포지션에 투자된 금액을 정확하게 확인할 수 있습니다! 기본적으로 이 지표는 총 사용 마진, 사용 가능한 마진, 그리고 마진 레벨 비율을 명확하게 보여줍니다. 또한 기본 설정으로 필요한 열(유형, 심볼, 로트, 포지션별 마진, 수익)을 표시합니다. 원한다면 티켓 번호, 손절매(SL), 이익실현(TP), 개시 가격 등의 열을 추가할 수 있습니다. 지표는 왼쪽 상단, 오른쪽 상단, 왼쪽 하단, 오른쪽 하단 네 곳으로 이동할 수 있습니다. 글꼴, 색상, 크기를 변경하고 굵게 표시할 수도 있습니다. 또한 텍스트 간격도 조정할 수 있습니다. 마지막으로 하단에는 총 손익이 표시됩니다. 이 지표는 간단하고 명확하며 사용하기 쉽도록
ChangePeriod MT4
Kazuya Yamaoka
You can change the time period of the chart at the touch of a button. You can also change multiple charts at the touch of a button. You can also change multiple charts at the touch of a button, saving you the trouble of changing time periods. We are live-streaming the actual operation of the system. https://www.youtube.com/@ganesha_forex We do not guarantee your investment results. Investments should be made at your own risk. We sharll not be liable for any disadvantage or damage caused by th
News Scalping Executor Pro is an utility which helps to trade high impact and huge volatility   news . This utility helps to create two opposite orders with risk management and profit protection. It moves automatically stop loss level to avoid losses as much as possible by using many different algorithms. It helps to avoid trading the news if spread suddenly becomes very huge. It can lock profit by moving stop loss or partially closing of orders. To be profitable with this type of trading you
Utility, which draws buy or sell trendlines, which can also become support or resistances able to close any position on the screen Algorithm that calculates the gain of the position, at the touch closure of the line.   The benefits you get: Works on forex and CFD, timeframe from M1 to Weekly. Easy to use screen control panel. Audible warning messages at the touch of the line. Easy to use.
Smartility
Syed Oarasul Islam
This utility is designed to help you with your Manual Trading. It allows different ways of closing trades. It can display total number of BUY and SELL orders individually and also their individual profits. It can enter trades without stopl loss and take profits. However upon selecting UseStopLossTakeProfit from the settings it can use best possible stop loss and take profits based on the market conditions. Upon selecting the CloseOppositeTrades  from the settings it can close opposite trades. Fo
Commodity Channel Index Message is an indicator for the MetaTrader 4 trading platform. Unlike the original indicator, this three in one version has a system of alerts that inform on market situation changes. It consists of the following signals: when the Main line crosses the levels of extreme zones and 50% level; when the Main line crosses the Trend line in the indicator window; Divergence on the last bar. Values of the middle and extreme levels and divergence zones are customizable. Parameter
History Pattern Search
Yevhenii Levchenko
표시기는 현재 시세를 작성하여 과거 시세와 비교할 수 있으며 이를 바탕으로 가격 변동을 예측합니다. 표시기에는 원하는 날짜로 빠르게 이동할 수 있는 텍스트 필드가 있습니다. 옵션: 기호 - 표시기가 표시할 기호 선택. SymbolPeriod - 지표가 데이터를 가져올 기간 선택. IndicatorColor - 표시기 색상. HorisontalShift - 지시자가 그린 따옴표를 지정된 막대 수만큼 이동합니다. Inverse - true는 인용 부호를 반대로, false - 원래 보기를 반전합니다. ChartVerticalShiftStep - 차트를 수직으로 이동합니다(키보드의 위/아래 화살표). 다음은 날짜를 입력할 수 있는 텍스트 필드의 설정으로, '엔터'를 누르면 즉시 이동할 수 있습니다.
Panel "panel_kjutaMultiTerminal" for trading. Opens, modifies, closes and deletes trading and pending orders from the chart using virtual lines, buttons and the active information terminal. Automatically opens an order by indicator levels. Hints in Russian, English or disabled. It has a number of functions for trailing virtual Take Profit lines and limit orders. Displays information on the active information terminal.  Hides and includes virtual lines S/L , T / P, buttons "<>","M","X", as well a
AdvCopyTraders
Chukwudi Joshua Obiekwe
AdvCopyTraders PRO is a powerful and ultra-fast trade copier designed for traders who manage multiple MT4 accounts. It duplicates all trades from a Master account to one or more Slave accounts instantly — including entries, exits, modifications, SL/TP updates, and partial closes. Whether you're a signal provider, fund manager, or using multiple brokers, this copier guarantees perfect synchronization and zero execution delay on the same PC/VPS. Key Features Instant Copying (0–1ms) Lightning-f
Lot Risk Calculator is a panel for order size calculation according to stop loss and allowed risk per trade. The calculation is performed for the symbol the indicator is launched at. You can set risk and stop loss manually in the panel. The stop loss is set considering 4 or 5 digits, for example, 20 - 4-digit, 200 - 5-digit. After editing each parameter, press Enter to confirm. To calculate a lot, click Calculate. The result appears below the button. Note! Set the panel for all necessary symbols
Trendiness Index
Libertas LLC
5 (3)
"The trend is your friend" is one of the best known sayings in investing, because capturing large trendy price movements can be extremely profitable. However, trading with the trend is often easier said than done, because many indicators are based on price reversals not trends. These aren't very effective at identifying trendy periods, or predicting whether trends will continue. We developed the Trendiness Index to help address this problem by indicating the strength and direction of price trend
자동 주문 및 위험 관리를 위한 유틸리티입니다. 이익을 최대한 활용하고 손실을 제한할 수 있습니다. 트레이더를 위한 실무 트레이더가 만들었습니다. 유틸리티는 사용하기 쉽고 거래자가 수동으로 또는 고문의 도움을 받아 열린 시장 주문과 함께 작동합니다. 매직 넘버로 거래를 필터링할 수 있습니다. 유틸리티는 동시에 원하는 수의 주문을 처리할 수 있습니다. 다음과 같은 기능이 있습니다. 1. 손절매 및 이익 수준 설정 2. 후행 정지 수준으로 거래를 마감합니다. 3. 손익분기점 설정. 유틸리티는 다음을 수행할 수 있습니다. 1. 각 주문에 대해 개별적으로 작업(각 주문에 대해 수준이 별도로 설정됨) 2. 단방향 주문 바스켓으로 작업(레벨은 모든 주문에 대해 공통으로 설정되며 별도로 구매 및 판매) 3. 다방향 주문 바구니로 작업(레벨은 모든 주문에 대해 공통으로 설정되며 BUY 및 SELL 함께) 옵션: STOPLOSS - =-1이 사용되지 않는 경우 핍에서
Easy Virtual Trader
Anoop Sivasankaran
4.89 (9)
Setup Easy Virtual Trader > Input your Rules > You are ready to trade from mobile or another EA or anywhere....Let robot manage your Trades !  This powerful EA will help you manage ALL or SPECIFIC trades automatically based on your PRE-SET rules and settings Once it is setup and running on just one chart, you don't need to monitor your orders anymore, the software will keep watching and control your orders with your predefined rules You can trade from your desktop MT4 or from your mobile appli
POC Delta Order Blocks   is a rule-based order block and volume-delta indicator designed to help traders clearly understand   where real trading activity happened and how price reacts around those zones . Instead of drawing generic candle-based blocks, this indicator uses a   Point of Control (POC)   approach to identify the most actively traded price level between a swing high/low and a confirmed Break of Structure (BOS). The order block is then anchored to the   earliest valid candle that inte
This panel is a part of the SupDem-Pro trading system and is used to search for the best opportunities for any available instruments. Which can be selected manually in the Market Watch (open it with CTRL + M). Using this trading panel in combination with ShvedSupDem-Pro_Zone allows to analyze multiple currency pairs with a single click. The panel allows to load any instruments from the Market Watch, from 6 major currency pairs up to all instruments (480). The indicator parameters Button Width -
VN Trade Panel II
Vyacheslav Nekipelov
4 (1)
The new version of the trading panel, which now has the ability to separately close Buy and Sell orders, display targets for all orders on the chart, as well as the ability to use the panel to trade with brokers working on the FIFO rule. Also, the new version adds option buttons for separate management of open orders. It has a convenient visualized interface and intuitive control without a lot of additional tabs to which traders have to be distracted and switch their attention. Thanks to this,
Scalping Day Trading Support Utility Scalping One for MT4 setting faile (for white Chart)    http://www.emkyuradias.shop/indexenglish.html One position is displayed with one button. View P & L, Lot, and Point in real time. It is possible to switch the display of positions of only chart currencies and all currency pairs.   Supports automatic identification in Japanese and English   Account currency notation corresponds to dollar, euro, pound, yen (automatic identification) Lot, take profit and
Margin Call Shield – Defend Your Margin on Your Terms Margin Call Shield   is a tool for MetaTrader 4 traders who want to decide for themselves which open positions are closed during margin call situations before the platform does so automatically based on its internal rules. By default, the broker or platform decides which positions to close, often using undisclosed algorithms. Margin Call Shield lets you set this order according to your own strategy. Why Was Margin Call Shield Created? In a  
Owl smart levels
Sergey Ermolov
4.24 (37)
MT5 버전  |   FAQ Owl Smart Levels Indicator 는   Bill Williams 의 고급 프랙탈, 시장의 올바른 파동 구조를 구축하는 Valable ZigZag, 정확한 진입 수준을 표시하는 피보나치 수준과 같은 인기 있는 시장 분석 도구를 포함하는 하나의 지표 내에서 완전한 거래 시스템입니다. 시장과 이익을 취하는 장소로. 전략에 대한 자세한 설명 표시기 작업에 대한 지침 고문-거래 올빼미 도우미의 조수 개인 사용자 채팅 ->구입 후 나에게 쓰기,나는 개인 채팅에 당신을 추가하고 거기에 모든 보너스를 다운로드 할 수 있습니다 힘은 단순함에 있습니다! Owl Smart Levels   거래 시스템은 사용하기 매우 쉽기 때문에 전문가와 이제 막 시장을 연구하고 스스로 거래 전략을 선택하기 시작한 사람들 모두에게 적합합니다. 전략 및 지표에는 눈에 보이지 않는 비밀 공식 및 계산 방법이 없으며 모든 전략 지표는 공개되어 있습니다. Owl Smart Leve
Laguerre SuperTrend Clouds adds an Adaptive Laguerre averaging algorithm and alerts to the widely popular SuperTrend indicator. As the name suggests, Laguerre SuperTrend Clouds (LSC) is a trending indicator which works best in trendy (not choppy) markets. The SuperTrend is an extremely popular indicator for intraday and daily trading, and can be used on any timeframe. Incorporating Laguerre's equation to this can facilitate more robust trend detection and smoother filters. The LSC uses the impro
Overview Money management is an all-important aspect of trading that many traders often overlook. It is very possible that even with a winning strategy, bad money management can often result in huge loses. Verdure Forex Calculators aims to help traders minimize risk and exposure in the Forex market. Verdure Forex Calculators implements 4 calculators in one single indicator. It is the first of it's kind on MT4 platform. Calculators implemented are: Lot (Trade or Contract Size) Calculator. Margin
VR Cub
Vladimir Pastushak
VR Cub 은 고품질 진입점을 얻는 지표입니다. 이 지표는 수학적 계산을 용이하게 하고 포지션 진입점 검색을 단순화하기 위해 개발되었습니다. 지표가 작성된 거래 전략은 수년 동안 그 효율성을 입증해 왔습니다. 거래 전략의 단순성은 초보 거래자라도 성공적으로 거래할 수 있다는 큰 장점입니다. VR Cub은 포지션 개시 지점과 이익 실현 및 손절매 목표 수준을 계산하여 효율성과 사용 편의성을 크게 높입니다. 간단한 거래 규칙을 이해하려면 아래 전략을 사용한 거래 스크린샷을 살펴보세요. 설정, 세트 파일, 데모 버전, 지침, 문제 해결 등은 다음에서 얻을 수 있습니다. [블로그] 다음에서 리뷰를 읽거나 작성할 수 있습니다. [링크] 버전 [MetaTrader 5] 진입점 계산 규칙 포지션 개설 진입점을 계산하려면 VR Cub 도구를 마지막 최고점에서 마지막 최저점까지 늘려야 합니다. 첫 번째 지점이 두 번째 지점보다 빠른 경우, 거래자는 막대가 중간선 위에서 마감될 때까지 기다립니다
This product is a multi-functional MT4 indicator and is an indispensable tool for account information statistics, strategy analysis and risk assessment. Functions: 1. Statistical account basic information of profit and loss . 2. Statistics and display the account profit and loss fund curve. 3. Display the order's track on chart ,so that we can analys the strategy and risk of the account. 4 .List account's trade pairs and order totals ,we also can see the profits of each pair. If you have any qu
손익분기점을 자동으로 설정하는 유틸리티로, 주어진 거리를 지나갈 때 거래를 손익분기점으로 전환합니다. 위험을 최소화할 수 있습니다. 상인을 위해 전문 상인이 만들었습니다. 유틸리티는 거래자가 수동으로 또는 고문을 사용하여 개설한 모든 시장 주문과 함께 작동합니다. 매직 넘버로 거래를 필터링할 수 있습니다. 유틸리티는 동시에 원하는 수의 주문을 처리할 수 있습니다. MT5 버전 https://www.mql5.com/ru/market/product/57077 유틸리티가 할 수 있는 일: 1핍에서 가상 손익분기점 설정 실제 수준의 손익분기점 설정 각 주문에 대해 개별적으로 작업(손익분기 수준은 각 주문에 대해 별도로 설정됨) 단방향 주문 바구니로 작업(손익분기 수준은 모든 주문에 대해 공통으로 설정되고 별도로 구매 및 판매) 양방향 주문 바스켓으로 작업(손익분기 수준은 모든 주문에 대해 공통으로 설정되며, 함께 구매 및 판매) 테스트 및 작업을 위해 차트의 버튼을 사용할 수 있습니
Your problem Are you tired of navigating your way through menus and hunting for tool bars to change currency pairs or time frames? Do you hate having to open and close several charts to get a 'feel' of what a currency is doing? Don't you wish you could just click your mouse and quickly navigate through the currency pairs and time frames that you use the most? My solution The Jimdandy Navigator will allow you to quickly customize your own navigator panel. You can select only the currencies, cfds
Trade Assistant is a trading panel designed for manual trading. The panel allows you to calculate risk, manage positions using Limit orders, And other useful features. Key features of the panel It works with any trading instruments - currency pairs, CFDs, stocks, indices, futures, cryptocurrencies. Set Stop Loss and Take Profit as the distance in points. Setting and displaying the potential loss to profit ratio. The panel supports pending orders. Display on the chart the calculated position vol
이 제품의 구매자들이 또한 구매함
Local Trade Copier EA MT4
Juvenille Emperor Limited
4.96 (106)
Local Trade Copier EA MT4 를 사용하여 매우 빠른 거래 복사 경험을 해보세요. 1분 안에 간편하게 설정할 수 있으며, 이 거래 복사기를 사용하면 Windows 컴퓨터 또는 Windows VPS에서 여러 개의 MetaTrader 터미널 간에 거래를 0.5초 미만의 초고속 복사 속도로 복사할 수 있습니다. 초보자든 전문가든 Local Trade Copier EA MT4 는 다양한 옵션을 제공하여 사용자의 특정 요구에 맞게 맞춤 설정할 수 있습니다. 이는 수익 잠재력을 높이려는 모든 사람을 위한 최고의 솔루션입니다. 지금 사용해보시고 이것이 왜 시장에서 가장 빠르고 쉬운 무역용 복사기인지 알아보세요! 팁: 여기 에서 데모 계정에서 Local Trade Copier EA MT4 데모 버전을 다운로드하여 사용해 볼 수 있습니다. 다운로드한 무료 데모 파일을 MT4 >> File >> Open Data Folder >> MQL4 >> Experts 폴더에 붙여넣고 터미널
Trade Assistant MT4
Evgeniy Kravchenko
4.42 (193)
거래당 위험 계산, 라인을 사용한 손쉬운 신규 주문, 부분 청산 기능을 통한 주문 관리, 7가지 유형의 트레일링 스탑 및 기타 유용한 기능을 제공합니다. 추가 자료 및 지침 설치 지침 - 애플리케이션 지침 - 데모 계정용 애플리케이션 평가판 라인 기능       - 차트에 개시선, 손절매, 차익실현을 표시합니다. 이 기능을 사용하면 새로운 주문을 쉽게 하고 개봉 전에 추가 특성을 볼 수 있습니다. 위기 관리       -       위험 계산 기능은 설정된 위험과 손절매 주문의 크기를 고려하여 새 주문의 볼륨을 계산합니다. 이를 통해 손절매 크기를 설정하고 동시에 설정된 위험을 존중할 수 있습니다. 로트 계산 버튼 - 위험 계산을 활성화/비활성화합니다. 필요한 위험 값은 위험 필드에 0에서 100 사이의 백분율 또는 예금 통화로 설정됩니다. 설정 탭에서 위험 계산 옵션을 선택합니다. $ 통화, % 잔액, % 지분, % 자유 마진, % 사용자 정의, % AB 이전 일, % AB
Trade Manager EA에 오신 것을 환영합니다. 이 도구는 거래를 보다 직관적이고 정확하며 효율적으로 만들기 위해 설계된 궁극적인 리스크 관리 도구 입니다. 단순한 주문 실행 도구가 아닌, 원활한 거래 계획, 포지션 관리 및 리스크 제어를 위한 종합 솔루션입니다. 초보자부터 고급 트레이더, 빠른 실행이 필요한 스캘퍼에 이르기까지 Trade Manager EA는 외환, 지수, 상품, 암호화폐 등 다양한 시장에서 유연성을 제공합니다. Trade Manager EA를 사용하면 복잡한 계산은 이제 과거의 일이 됩니다. 시장을 분석하고 진입, 손절 및 익절 수준을 차트의 수평선으로 표시한 후 리스크를 설정하면, Trade Manager가 이상적인 포지션 크기를 즉시 계산하고 SL 및 TP 값을 실시간으로 표시합니다. 모든 거래가 간편하게 관리됩니다. 주요 기능: 포지션 크기 계산기 : 정의된 리스크에 따라 거래 크기를 즉시 결정합니다. 간단한 거래 계획 : 진입, 손절, 익절을 위한
Exp COPYLOT CLIENT for MT4
Vladislav Andruschenko
4.69 (65)
MetaTrader 4용 트레이드 복사기.       모든 계정의 외환 거래, 포지션, 주문을 복사합니다. 그것은 최고의 무역 복사기 중 하나입니다       MT4 - MT4, MT5 - MT4       위해       카피롯 MT4       버전(또는       MT4 -  MT5   MT5 - MT5       위해       카피롯 MT5       버전). MT5 버전 전체 설명   +DEMO +PDF 구입 방법 설치하는 방법     로그 파일을 얻는 방법     테스트 및 최적화 방법     Expforex의 모든 제품 복사기   버전         MetaTrader 5   터미널 (   МТ5 - МТ5, МТ4 - МТ5   ) -   Copylot Client MT5 고유한 복사 알고리즘은 마스터 계정에서 고객 계정으로 모든 거래를 정확하게 복사합니다. 이 제품은 또한 높은 작동 속도에서 높은 오류 처리로 유명합니다. 강력한 기능 세트. 프로그램은 여러 터
The product will copy all telegram signal to MT4   ( which you are member  ) , also it can work as remote copier.  Easy to set up, copy order instant, can work with almost signal formats, image signal, s upport to translate other language to English Work with all type of channel or group, even channel have "Restrict Saving Content", work with  multi channel, multi MT5 Work as remote copier: with signal have ticket number, it will copy exactly via ticket number. Support to backtest signal. How to
Trade copier MT4
Alfiya Fazylova
4.58 (33)
Trade Copier는 거래 계정 간의 거래를 복사하고 동기화하도록 설계된 전문 유틸리티입니다. 복사는 공급자의 계정/단말기에서 동일한 컴퓨터 또는 vps에 설치된 수신자의 계정/단말기로 발생합니다. 구매하기 전에 데모 계정에서 데모 버전을 테스트할 수 있습니다. 데모 버전 여기 . 전체 지침 여기 . 주요 기능 및 이점: 복사기는 "МТ4> МТ4", "МТ4> МТ5", "МТ5> МТ4" 복사를 지원합니다. 복사기는 데모 계정 > 실 계정, 실 계정 > 데모 계정, 데모 계정 > 데모 계정 및 실제 계정 > 실 계정 복사를 지원합니다. 복사기는 읽기 전용 암호가 적용된 투자자 계정에서 복사를 지원합니다. 하나의 공급자 터미널은 여러 수신 터미널로 트랜잭션을 보낼 수 있고 하나의 수신 터미널은 여러 공급자 터미널에서 트랜잭션을 수신할 수 있습니다. 복사기는 귀하 또는 귀하의 고문이 거래하는 동일한 터미널에서 작동할 수 있습니다. 높은 복사 속도(0.5초 미만). 복사기에는 간편
Comprehensive on chart trade panel with the unique ability to be controllable from mobile as well. Plus has a library of downloadable configuration, e.g. exit rules, extra panel buttons, pending order setup and more. Please see our product video. Works with all symbols not just currency pairs. Features On chart panel plus controllable from free app for Windows, iPhone and Android Built-in script engine with library of downloadable configuration, e.g. add 'Close All Trades in Profit' button, exit
--------------Welcome to use [MQL5 Signal Analyze Master]------------------  Function: Draw order tracks of MQL5 MT4 and MT5 signal on MT4 chart. [Using guide] 1.Use it as Experts. 2.Download history record from MQL5 signal(MT4 signal or MT5 signal).  3.Paste history record file below "MQL4/Files/" 4.Load [Signal Analyze Master] on the symbol chart what you want to analyze. 5.Paste the history record file name to parameter 'FileName' 6.Select  SignalType  match the history you download on MT4
Copy Cat More Trade Copier MT4 (복사 고양이 MT4) 는 단순한 로컬 트레이드 카피어가 아니라, 오늘날의 거래 환경을 위해 설계된 완전한 리스크 관리 및 실행 프레임워크입니다. Prop Firm 챌린지부터 개인 계좌 관리까지, 강력한 실행력, 자본 보호, 유연한 설정, 고급 거래 처리 기능을 통해 모든 상황에 적응합니다. 이 카피어는 Master(송신자) 와 Slave(수신자) 모드 모두에서 작동하며, 실시간으로 시장가/지정가 주문, 거래 수정, 부분 청산, Close By 작업을 동기화합니다. 데모 및 실계좌 모두 호환되며, 거래용 비밀번호 또는 투자자 비밀번호로도 사용할 수 있습니다. Persistent Trade Memory 기술을 통해 EA, 터미널, VPS가 재시작되더라도 거래가 복원됩니다. 여러 Master와 Slave를 동시에 관리할 수 있으며, 브로커 간 차이는 접두사/접미사 자동 감지 또는 심볼 매핑으로 처리됩니다. 매뉴얼/설정: Copy C
Trade Dashboard MT4
Fatemeh Ameri
4.96 (53)
Tired of complex order placement and manual calculations? Trade Dashboard is your solution. With its user-friendly interface, placing orders becomes effortless, by a single click, you can open trades, set stop loss and take profit levels, manage trade lot size, and calculate risk to reward ratios, allowing you to only focus on your strategy. Say goodbye to manual calculations and streamline your trading experience with Trade Dashboard. Download  Demo Version  right now. You can find  Details of
Telegram to MT4 Coppy
Sergey Batudayev
3.75 (8)
Telegram에서 MT4로:   최고의 신호 복사 솔루션 최첨단 유틸리티인   Telegram to MT4를   사용하여 거래를 간소화하세요. DLL 없이도 Telegram 채널과 채팅에서 MetaTrader 4 플랫폼으로 거래 신호를 직접 복사할 수 있습니다. 이 강력한 솔루션은 탁월한 정밀도와 맞춤 설정 옵션을 통해 원활한 신호 실행을 보장하여 시간을 절약하고 효율성을 높여줍니다. [ Instructions and DEMO ] 주요 특징 직접 Telegram API 통합 전화번호와 보안 코드를 통해 인증하세요. 사용자 친화적인 EXE 브리지를 사용하여 채팅 ID를 손쉽게 가져오고 관리하세요. 여러 채널/채팅을 추가, 삭제, 새로 고침하여 동시에 신호를 복사합니다. 고급 필터를 사용한 신호 파싱 사용자 정의 예외 단어(예: "보고서", "요약")가 포함된 원치 않는 신호를 건너뜁니다. 유연한 SL 및 TP 형식을 지원합니다: 가격, 핍 또는 포인트. 신호가 가격 대신 지점을 지정
Riskless Pyramid
Snapdragon Systems Ltd
5 (1)
Introduction This powerful MT4 trade mangement EA offers a way potentially to aggressively multiply trade profits in a riskfree manner. Once a trade has been entered with a defined stoploss and take profit target then the EA will add three pyramid add-on trades in order to increase the overall level of profit. The user sets the total combined profit target to be gained if everything works out. This can be specified either as a multiple of the original trade profit or as a total dollar amount. Fo
Trading History MT4
Siarhei Vashchylka
5 (9)
Trading History - A program for trading and money management on the history of quotes in stratagy tester. It can work with pending and immediate orders, and is equipped with trailing stop, breakeven and take profit functions. Very good for training and testing different strategies. Manual (Be sure to read before purchasing) Advantages 1. Allows you to test any trading strategy in the shortest possible time 2. An excellent simulator for trading training. You can gain months of trading experience
MT4 to Telegram Signal Provider 는 사용하기 쉽고 완전히 사용자 정의가 가능한 도구로, 텔레그램으로 신호를 보내어 계정을 신호 제공자로 변환할 수 있습니다. 메시지 형식은 완전히 사용자 정의가 가능합니다! 그러나 간단한 사용을 위해 미리 정의된 템플릿을 선택하고 메시지의 특정 부분을 활성화하거나 비활성화할 수도 있습니다. [ 데모 ]  [ 매뉴얼 ] [ MT5 버전 ] [ 디스코드 버전 ] [ 텔레그램 채널 ]  New: [ Telegram To MT5 ] 설정 단계별 사용자 가이드 가 제공됩니다. 텔레그램 API에 대한 지식이 필요 없으며, 개발자가 필요한 모든 것을 제공합니다. 주요 기능 구독자에게 보낸 주문 세부 정보를 사용자 정의할 수 있는 기능 예를 들어 브론즈, 실버, 골드와 같은 계층 구독 모델을 만들 수 있습니다. 골드 구독은 모든 신호 등을 받게 됩니다. ID, 심볼 또는 코멘트별 주문 필터링 주문이 실행된 차트의 스크린샷을 포함 보낸
CloseIfProfitorLoss with Trailing
Vladislav Andruschenko
4.87 (31)
이익 추적 기능으로 총 이익/손실에 도달하면 MetaTrader 4에서 포지션을 청산합니다. 가상 정지 (별도 주문) 을 활성화할 수 있습니다. BUY 및 SELL 포지션을 별도로 계산하고 마감합니다 (BUY SELL 별도). 모든 심볼 또는 현재 심볼 만 닫고 계산합니다 (모든 심볼). 이익을 위해 후행 추적 을 활성화합니다 (후행 이익). 예금 통화, 포인트, 잔액의 %에 대한 총 손익을 마감합니다. 이 애플리케이션은 다른 EA와 함께 또는 수동 거래와 함께 모든 계정에서 사용하도록 설계되었습니다. MT5 버전 전체 설명 + DEMO + PDF 구입 방법 설치하는 방법 로그 파일을 얻는 방법 테스트 및 최적화 방법 Expforex의 모든 제품 일부 쌍 또는 모든 쌍의 총 거래 잔액이 설정에서 지정된 값보다 크거나 같으면 모든 포지션이 닫히고 주문이 삭제됩니다. 이 버전은 지정된 이익 수준에서 포지션을 마감할 수 있을 뿐만 아니라 더 나은 결과를 위해 이익을 추적할 수도 있습니다
My Trade History PRO
Bernhard Schweigert
5 (3)
현재 20% 할인 !! 초보자 또는 전문가 상인을위한 최상의 솔루션! 당신의 거래를 검토하는 것은 성공적인 거래자의 첫 번째 단계입니다. 성공적인 트레이더는 거래 성과를 정기적으로 검토하는 습관이 있습니다. 이 도구는 당신이 그렇게하는 데 도움이 될 것입니다. 검토 과정은이 도구에서 가장 효과적이며 거래를 추적합니다. 수동 거래 또는 EA의 거래를 분석하십시오. 3 가지 일반적인 견해를 사용하십시오. 버튼을 클릭하는 것만으로 전환하려면 폐쇄 거래 열린 거래 폐쇄 + 공개 거래 모든 거래는 각 기호에 대해 나열됩니다. 다른 기호로 이동하려면 기호 이름 버튼을 클릭하십시오. 새로 개설 및 마감 거래에 경고를 사용하십시오. 열린 거래를 보는 데 매우 유용합니다. EA, 신호 또는 수동으로 시작될 수 있습니다. 이익 또는 PIP의 결과를 전환하려면 버튼을 클릭하십시오. 이익 핍 그런 다음 3 분석 유형을 전환하십시오. 버튼을 클릭합니다. 모든 기호 모드 1 스피볼
Auto SLTP Maker MT4  is an assistant for all those who forget to set StopLoss and/or TakeProfit in deal parameters, or trade on a very fast market and fail to place them in time. This tool automatically tracks trades without StopLoss and/or TakeProfit and checks what level should be set in accordance with the settings. The tool works both with market and pending orders. The type of orders to work with can be set in the parameters. It can track either trades for the instrument it runs on, or all
AW Grids Maker
AW Trading Software Limited
4.33 (3)
"AW_Grids_Maker"는 보류 중인 주문으로부터 그리드를 구축하는 데 사용됩니다. 이 유틸리티는 범용적이며, 유연한 설정과 직관적인 패널 인터페이스를 제공합니다. 이 프로그램은 필요한 단계를 거쳐 STOP 및 LIMIT 주문으로부터 네트워크를 구축하며, 포지션 볼륨 배수를 사용합니다. MT5 버전 -> 여기 / 문제 해결 -> 여기 장점: 모든 유형의 보류 주문을 사용합니다. 간단하고 유연한 구성. 잘 디자인되고 다기능적인 유틸리티 패널입니다. 잘 고안된 정보 모듈 작업의 특징: 피라미딩, 클래식 평균 또는 마팅게일에 적합합니다. 그리드 개설, 주문 추적 및 마감을 자동화합니다. 이는 거래 시스템의 필수적인 부분이 될 수도 있고 독립적인 전략이 될 수도 있습니다. 조정 가능한 거리와 거래량을 통해 모든 유형의 주문 네트워크를 구축하면 계수가 증가합니다. 패널에 대한 자세한 설명: 트레이더는 "Open_Buy" 버튼을 사용하여 보류 중인 매수 지정가 주문과 매수 정지 주문을
TradePanel MT4
Alfiya Fazylova
4.85 (91)
Trade Panel은 다기능 거래 보조원입니다. 이 애플리케이션에는 수동 거래를 위한 50개 이상의 거래 기능이 포함되어 있으며 대부분의 거래 작업을 자동화할 수 있습니다. 전략 테스터에서는 애플리케이션이 작동하지 않습니다. 구매하기 전에 데모 계정에서 데모 버전을 테스트할 수 있습니다. 데모 버전 여기 . 전체 지침 여기 . 거래. 한 번의 클릭으로 거래 작업을 수행할 수 있습니다: 자동 위험 계산을 통해 지정가 주문 및 포지션을 엽니다. 한 번의 클릭으로 여러 주문과 포지션을 열 수 있습니다. 주문 그리드를 엽니다. 그룹별 대기 주문 및 포지션을 마감합니다. 포지션 반전(매수 청산 후 매도 개시 또는 매도 청산 후 매수 개시). 포지션 고정(매수 포지션과 매도 포지션의 양을 동일하게 하는 추가 포지션 개설). 한 번의 클릭으로 모든 포지션을 부분 청산합니다. 모든 포지션의 이익실현과 손절매를 동일한 가격 수준으로 설정합니다. 모든 포지션에 대한 손절매를 해당 포지션의 손익 분기
Exp SafetyLock PRO
Vladislav Andruschenko
4.57 (28)
SAFETYLOCK을 사용하면 거래자는 이미 열린 포지션에 대해 반대 주문을 설정하여 강한 시장 반전을 피할 수 있습니다. 거래자 또는 EA가 포지션을 열면, SAFETYLOCK은 자동으로 반대 방향의 보류 주문을 설정합니다. 포지션이 손실 상태로 전환되면, 이 보류 주문이 활성화되어 잠금(락)을 생성하여 손실을 최소화합니다. EA는 초기 포지션을 닫거나, 후행 정지를 사용하여 수익을 최적화하거나, 로트를 증가시켜 거래 전략을 강화하는 다양한 옵션을 제공합니다. 또한, 포지션 가격에 맞추어 미결 주문의 오픈 가격을 조정하여 시장 움직임에 유연하게 대응할 수 있습니다. 전체 설명 +DEMO +PDF 구입 방법 설치하는 방법     로그 파일을 얻는 방법     테스트 및 최적화 방법     Expforex의 모든 제품 매개변수 기본(블로그의 매개변수에 대한 전체 설명) MilliSecondsTimerForMonitoring – 알고리즘 실행 시간을 밀리초 단위로 설정합니다(기본
Trend Line Optimizer
Evgenii Aksenov
4.11 (19)
이 추세선 프로 표시기에 대한 자동 매개 변수 최적화 프로그램입니다 쉽고 빠르게 당신은 당신의 마음에 드는 추세선 프로 표시기에 대한 최적의 매개 변수를 선택합니다. 최적화에는 몇 초 밖에 걸리지 않습니다. 최적화할 수 있는 최고의 매개변수에 대한 각 쌍고기간:진폭,TP1-TP3,stoploss 에뿐만 아니라,값은 시간을 필터 및 카테고에 필터가 역사를 선택 섹션(일) 다른 시간대를 최적화하려면 다른 범위의 히스토리가 필요합니다: M5-M15 계산 범위 매개 변수 설정(일)=60(3 개월) M30-H1 계산 범위 매개 변수 설정(일)=120(6 개월) H4 매개 변수 계산 범위 설정(일)=240(1 년) D1-W1 매개 변수 계산 범위 설정(일)=720(3 년) Mn1 매개 변수 계산 범위 설정(일)=1200(5 년) 최적화 후 매개 변수는 폴더의 기성품 세트 파일에 자동으로 저장됩니다.MQL4>Files>trendlineoptimizedsettings 최적화 유틸리티 사용
TPSpro Trade PRO
Roman Podpora
4.67 (6)
주어진 손절매 수준에 따라 포지션 규모 또는 위험을 즉시 계산할 수 있는 도구는 전문 트레이더와 초보 트레이더 모두에게 필수적입니다. TRADE PRO 거래 유틸리티는 빠르고 정확한 계산을 제공하여 시간적 제약이 있고 변동성이 큰 시장 상황에서 의사 결정을 내리는 데 도움을 줍니다. MT5 버전        /   추가 설치 자재 주요 기능: 독창적이고, 간결하며, 효과적입니다. 메인 거래 패널을 여는 독특하고 편리한 방법: 차트 오른쪽에 마우스 커서를 올려놓고 원하는 방향을 클릭하여 선물 주문을 하세요. 시장가 주문을 빠르게 설정할 수 있습니다. TRADE PRO를 사용하여 잔액 또는 자본 대비 백분율로 위험 수준을 설정하거나 특정 위험 금액을 지정할 수 있습니다. 차트에서 손절매 수준을 시각적으로 정의하면 도구가 각 통화 쌍에 대한 최적의 포지션 크기를 자동으로 계산합니다. 또한 지정된 위험-보상 비율을 기반으로 목표 수익(익절)을 자동으로 설정할 수 있습니다. 총 위험을 분
Copy Master mt4
Evgenii Aksenov
5 (5)
이 유틸리티를 사용하면 마스터 설정이있는 한 터미널에서 슬레이브 설정이있는 다른 터미널로 모든 트랜잭션을 복사 할 수 있습니다 동시에 복사 할 쌍을 선택하고 여러 매개 변수에 따라 복사 된 순서의 크기를 설정할 수 있습니다. 드로우 다운 손실 한도를 설정하거나 수익성있는 거래 만 복사하십시오 Mt4 또는 mt5 에서 다른 브로커의 mt4 또는 MT5 로 거래를 복사 할 수 있습니다 이제 mt4 에서 일하는 전문가의 신호를 MT5 터미널 또는 뒤로 복사하는 것이 어렵지 않을 것입니다 복사 마스터를 사용하여 다른 신호,전문가 고문,수동 거래에서 거래를 복사하십시오.  를 사용하여 설정을 변경할 수 있습니다 많은 크기,무역 방향으로만 복사 수익을 거래하고 설정 값을 저장하는 금고  복사 마스터는 하나의 계정에 서로 다른 가입 신호의 여러 전략을 결합 할 수 있습니다 익을 MT4,당신은 필요합 복사본을 마스터 MT5 버전:  https://www.mql5.com/ko/mar
Unlimited Trade Copier Pro is a tool to copy trade remotely to multiple MT4, MT5 and cTrader accounts at different computers/locations over internet. This is an ideal solution for you if you are a signal provider and want to copy your trades to other receivers globally on your own rules. One provider can copy trades to multiple receivers and one receiver can get trade from multiple providers as well. The provider can even set the subscription expiry for each receiver, so that receiver will not b
The indicator has three main tools: Magnifier (Zoom chart), Ruler  ( Time and Price scales ),   and Crosshair. You can move it all around with your mouse and customize different formats for  displaying , customize   size and color of each element. The Magnifier (zoom chart) allows you to display candles from any time frame and at different scales. Hotkeys: 'Q' - higher timeframe, 'A' - lower timeframe, 'W' - decrease candle size, 'S' - increase candle size, 'Z' - show/hide zoom chart You can
EasyInsight AIO MT4
Alain Verleyen
4 (2)
EASY Insight AIO – 스마트하고 손쉬운 트레이딩을 위한 올인원 솔루션 개요 외환, 금, 암호화폐, 지수, 심지어 주식까지 — 전 시장을 몇 초 만에, 수동 차트 확인이나 복잡한 설치, 인디케이터 설정 없이 스캔할 수 있다고 상상해 보세요. EASY Insight AIO 는 AI 기반 트레이딩을 위한 궁극의 플러그 앤 플레이(Plug & Play) 데이터 내보내기 도구입니다. 단 하나의 깔끔한 CSV 파일로 전체 시장 스냅샷을 제공하며, ChatGPT, Claude, Gemini, Perplexity 등 다양한 AI 플랫폼에서 즉시 분석할 수 있습니다. 창 전환, 복잡함, 차트 오버레이는 더 이상 필요 없습니다. 자동으로 내보내지는 순수하고 구조화된 데이터 인사이트만으로, 반복적인 차트 감시 대신 데이터 기반의 스마트한 의사결정에 집중할 수 있습니다. 왜 EASY Insight AIO인가요? 진정한 올인원 • 별도의 설정, 인디케이터 설치, 차트 오버레이가 필요 없습
PnL Calendar MT4
Keni Chetankumar Gajanan -
PnL Calendar ... analyse to profit PnL Calendar transforms your trading history into a clear calendar view, helping you spot profitable days, monitor risk in real time, and unify accounts with the new Multi‑Broker data export feature. Core Features Calendar Panel: Profit breakdowns by day, week, month, and year Account Panel: Balance, equity, margin alerts, multi‑timeframe summaries, overnight gap adjustments Risk Dashboard: Leverage, drawdown, profit factor, consistency ratio, holding time, ri
Account Protector Metatrader 4
Emmanuel Lovski Ijeawele Maduagwuna
Account Protector Meta Trader 4 This utility prevents risk of ruin per trading cycle.  Retail forex trading accounts are designed with   stop out levels   that make it impossible to quickly restore lost trading capital   (to initial levels)   in the event of a human or algorithm trader  " blowing"   an account. This hampers the efforts of a trader who after growing an account investment to a multiple of its initial value, suddenly suffers irreparable loss because of several trade entry mishaps.
Exp Averager
Vladislav Andruschenko
4.82 (22)
Exp-Averager는   평균 거래를 개시하여 특정 하락폭을 받은 거래를 평균화하도록 설계되었습니다. 고문은 추세에 맞춰 또는 현재 추세에 반대하여 새로운 위치를 열 수 있는 능력이 있습니다. 또한 일련의 위치에 적용되는 스마트 트레일링 스톱 기능도 포함되어 있습니다. 고문은 직위의 로트 크기를 늘리거나 줄일 수 있습니다. 이는 손실 포지션을 평균 가격으로 가져오기 위해 널리 사용되는 전략입니다. MT5 버전 전체 설명 +DEMO +PDF 구입 방법 설치하는 방법     로그 파일을 얻는 방법     테스트 및 최적화 방법     Expforex의 모든 제품 연결 TickSniper   스캘퍼   의 평균화 시스템 예 평균화 기능을 갖춘 범용 트레이딩 어드바이저   The X Expert Advisor는 차트가 첨부된 통화 쌍에 대해 작업합니다. 예를 들어 EURUSD에 대한 평균을 활성화하려면 EURUSD 차트를 열고 Expert Advisor를 실행하십시오. 메모
EchoTrade Telegram to MT4 Copier
Perpetual Chinemerem Vincent
5 (2)
EchoTrade Telegram to MT5 Copier Seamless, Instant, and Reliable Signal Copying - Direct from Telegram to MetaTrader 4! The product does not run in the strategy tester but you can get free trial version   here  for testing before purchase. Tired of manually executing trades from Telegram signals? EchoTrade automates the process, instantly copying trades from any Telegram channel or group directly into your MT5 account—accurately, efficiently, and without delay. Key Features: Universal Compatib
제작자의 제품 더 보기
This indicator is based on a classic  DeMarker indicator. Multi TimeFrame indicator MTF-DeMarker shows data from the 4 timeframes by your choice. By default this indicator has external parameters: TF1 = 1; TimeFrame2b = true; TF2 = 5; TimeFrame3b = true; TF3 = 15; TimeFrame4b = true; TF4 = 60; InpPeriod = 14; You can change TF1-TF4 in the next limits: TF1 from M1 (1) to H4 (240) TF2 from M5 (5) to D1 (1440) TF3 from M15 (15) to W1 (10080) TF4 from M30 (30) to MN1 (43200) All chosen TFs should be
Flat Market
Leonid Basis
This is a self-explanatory indicator - do nothing when the current price in the "fence" (flat) mode. Definition of a flat market: A market price that is neither Up nor Down. The input parameter  counted_bars  determines on how many bars the indicator's lines will be visible starting from the current Bar backward. The input parameter  barsNum  is used as a Period for aqua "fence" calculation.
This Multi TimeFrame indicator is based on the "Fractals" classical indicator. 2 Inputs: TimeFrame1; TimeFrame2; You can put any available TimeFrame values (from M1 (Period_M1) to MN1 (Period_MN1)) equal or greater ( >= ) than the Period of the current Time Frame. The last Fractals will shown as color lines (Dots Line) of Support and Resistance for the Price moving.
This is a Multi-Time indicator which allows to display RSI and Stochastic indicators from upper timeframes on a single chart. As an example: a single chart EURUSD M5 and RSI (blue line) and Stochastic (yellow line) from H1. Red Histogram is representing Lower trend and Green Histogram is representing Upper trend.
When you put this Multi TimeFrame Parabolic SAR indicator on the chart it will automatically use Parabolic SAR from next available 3 timeframes. Green arrow will show the beginning of Up trend and Red arrow will show the beginning of Down trend. If AlertsEnabled = true, the indicator will show the Alert (message window) with a text like this: "Price going Down on ", Symbol(), " - ", Period(), " min", " price = ", Bid; If eMailEnabled = true the Indicator will send you an eMail with the same text
The zero line is characterized the Flat trend. V-shaped impulse indicates the entrance to the opposite direction. U-shaped impulse = entry orders in the same direction. If AlertsEnabled = true, the indicator will show the Alert (message window) with a text like this: "Price going Down on ", Symbol(), " - ", Period(), " min", " price = ", Bid; If eMailEnabled = true the indicator will send you an eMail with the same text an Alert message with subject: "Trinity-Impolse" (of course you have to chec
The indicator displays the usual Moving Average with input parameters: maPeriod_1; maMethod_1; maAppPrice_1. Then it calculates and displays MA on MA1 with input parameters: maPeriod_2; maMethod_2. Then it calculates and displays MA on MA2 with input parameters: maPeriod_3; maMethod_3. If AlertsEnabled = true the Indicator will show the Alert (message window) with a text like this: "Price going Down on ", Symbol(), " - ", Period(), " min", " price = ", Bid; If eMailEnabled = true the Indicator w
Multi TimeFrame Indicator "MTF CCI Trigger" based on the Commodity Channel Index from the upper TF (input parameter "TimeFrame") yellow line. Aqua line is representing ATR envelopes from the current TF. Green and Red arrows is triggered by CCI and represented UP and DOWN trends accordingly.
The BBImpulse indicator is based on the standard Moving Average indicator. You have MA input parameters: maPeriod - Moving Average period; maMODE - Moving Average mode (0 = MODE_SMA; 1 = MODE_EMA; 2 = MODE_SMMA; 3 = MODE_LWMA); maPRICE - Applied price (0=PRICE_CLOSE; 1=PRICE_OPEN; 2=PRICE_HIGH; 3=PRICE_LOW; 4=PRICE_MEDIAN; 5=PRICE_TYPICAL; 6=PRICE_WEIGHTED). Green Histogram is representing an UP-trend, Red Histogram is representing a Down-trend.
Multi TimeFrame indicator MTF ADX with Histogram shows ADX indicator data from the TF by your choice. You may choose a TimeFrame equal or greater than current TF. Yellow line is representing a price trend from the upper TF. Green line is representing +DI from the upper TF. Red line is representing -DI from the upper TF. Green histogram is displaying an Up-trend. Red histogram is displaying a Down-trend.
This Indicator creates 2 white lines based on Exponential Moving Averag e of High and Low prices. You can regulate how many bars will be involved in the calculation with input parameter HL_Period. Red and Blue arrows are displaying the moment to go Short and Long trades accordingly.
The most common way to interpreting the price Moving Average is to compare its dynamics to the price action. When the instrument price rises above its Moving Average, a buy signal appears, if the price falls below its moving average, what we have is a sell signal. To avoid a spontaneous entries one may use this update from Moving Average Indicator = Stepper-MA.
Envelopes technical Indicator is formed with two Moving Averages one of which is shifted upward and another one is shifted downward. Envelopes define the upper and the lower margins of the price range. Signal to sell appears when the price reaches the upper margin of the band; signal to buy appears when the price reaches the lower margin. To avoid a spontaneous entries one may use this update from Envelopes Indicator = Envelopes-Stepper.
The interpretation of the Bollinger Bands is based on the fact that the prices tend to remain in between the top and the bottom line of the bands. Abrupt changes in prices tend to happen after the band has contracted due to decrease of volatility; If prices break through the upper band, a continuation of the current trend is to be expected; If the pikes and hollows outside the band are followed by pikes and hollows inside the band, a reverse of trend may occur; The price movement that has starte
Fibonacci sequence is defined by integer sequence: 0, 1, 1, 2, 3, 5, 8, 13, 34, 55, 89, 144, ... By definition, it starts from 0 and 1, the next number is calculated as a sum of two previous numbers. Instead of the standard moving average, the indicator uses the caluclation of average price in form: Bar0 + Bar1 + Bar2 + Bar3 + Bar5 + Bar8 + Bar13 +... Input parameters:  FiboNumPeriod (15) - Fibonacci period; nAppliedPrice (0) - applied price (PRICE_CLOSE=0; PRICE_OPEN=1; PRICE_HIGH=2; PRICE_LOW=
This indicator present a main Moving Average line with input parameters maPeriod_1, maMethod_1 and maAppPrice_1. The second line will be a calculation of the Moving Average data of a first line with input parameters maPeriod_2, maMethod_2. The third line will be a calculation of the Moving Average data of a second line with input parameters maPeriod_3, maMethod_3. To avoid a spontaneous entries one may use this indicator-stepper.
Average Bar
Leonid Basis
This indicator (as almost all others) is based on classical Moving Averages. It shows the Average Bar under the current bar colored in aqua or over the current bar colored in orange. Input Parameters: ma_Period and ma_Method. The Average Bar maybe helpful to predict where the price will move in the nearest future. Of course, this "near future" depends of the current time frame.
Buy when the market is falling and sell when the market is rising. When the market is moving down you start observing and looking for buy signals. When the market is moving up you start looking for sell signals. This indicator points to the moments to Buy (Blue arrow) and to Sell (Orange arrow). Two input parameters: barsNumber and step for optimization (depending on symbol and Time Frame).
This indicator shows: A green light in case the price goes up; A red light in case the price goes down; A yellow light in case there are a sideways trend. A sideways trend is the horizontal price movement that occurs when the forces of supply and demand are nearly equal. This typically occurs during a period of consolidation before the price continues a prior trend or reverses into a new trend
Sum of Ticks
Leonid Basis
This indicator is created for M1 timeframe. It shows how many ticks has occurred during current minute and ( after the slash) the sum of points Up (aqua color) and Down (orange color). In times of a high trading activity a grow up number of ticks Up and Down will signal of a big move of the price in the near future. In times of a high trading activity a grow up number of sum of points Up and Down will signal of a big move of the price in the near future too.
CCI Envelopes
Leonid Basis
Two yellow lines. This is similar to classical Envelopes but with automatic deviation. The Envelopes indicator is   a tool that attempts to identify the upper and lower bands of a trading range. Aqua line. This is a classical Commodity Channel Index added to the Envelopes on the chart, not in a separate window. The Commodity Channel Index ( CCI ) is a technical   indicator   that measures the difference between the current price and the historical average price.
Probability
Leonid Basis
Probability deals with the likelihood of an event happening.   Forex   probability indicates a possibility at a specific time. This is because the forex market is highly volatile, and predicting future events affecting it is impossible. This indicator will show a positive number above the current High or negative number under the current Low as a probability of the trend. Higher time frames usually show a higher probability, even more then 100%.
Envelopes is an excellent indicator when the market is trending. Open Long position when the ClosePrice crossed the upper Aqua band. Close Long position when the Price crossed the upper Yellow band moving down. Open Short position when the ClosePrice crossed the lower Aqua band. Close Short position when the Price crossed the lower Yellow band moving up.
Moving Average Bars is a self-explanatory indicator with one input parameter: nPeriod. When the previous Price Close is above the previous indicator Bar, the probability to go Long is very high.   When the previous Price Close is under the previous indicator Bar, the probability to go Short is very high.
This indicator is based on the same idea as https://www.mql5.com/en/market/product/2406 , but instead of Average Bars it uses series or Fibonacci sequence. When the previous Price Close is above the previous indicator Bar, the probability to go Long is very high. When the previous Price Close is under the previous indicator Bar, the probability to go Short is very high.
This indicator is based on two ideas: Correlations between 5 main currency pairs: EURUSD, GBPUSD, USDCHF, USDJPY, USDCAD; US Dollar Index = the value of the United States dollar relative to a basket of foreign currencies. The use of the indicator is the same as classical  Commodity Channel Index  (CCI) indicator. CCI is calculated with the following formula:  (Typical Price - Simple Moving Average) / (0.015 x Mean Deviation) (Typical Price - Simple Moving Average) / (0.015 x Mean Deviation)
Tick by Tick
Leonid Basis
A  tick  is a measure of the minimum upward or downward movement in the  price  of a security. A  tick  can also refer to the change in the  price  of a security from one trade to the next trade.  This indicator will show amounts of ticks when the price goes up and down. This indicator is designed for M1 time frame and shows: Sum of points when the price goes up (Green Histogram). Sum of points when the price goes down (Red Histogram). 
This indicator is a combination of 2 classical indicators MA and RVI. The Relative Vigor Index (RVI) is a momentum indicator used in technical analysis that measures the strength of a trend by comparing a security's closing price to its trading range while smoothing the results using a simple moving average   The input parameter  counted_bars  determines how many bars the indicator's lines will be visible. The input parameter MaRviPeriod  is used for MA and RVI calculation.
This indicator is a combination of 2 classical indicators: MA and Force Index. The input parameter  counted_bars  determines on how many bars the indicator lines will be visible. The input parameter  MaForcePeriod  is used for MA and Force calculation. You may go Long if the current price crossed Up the Ribbon (HISTOGRAM)  and you may go Short if the current price crossed Down the Ribbon (HISTOGRAM)
This indicator is a combination of 2 classical indicators: MA and CCI. Two moving averages form Upper and Lower bands. The input parameter  counted_bars  determines on how many bars the indicator's lines will be visible. The input parameter  barsNum  is used for MA and CCI calculation.
필터:
리뷰 없음
리뷰 답변