ATR Line MT4
- 지표
- 버전: 1.4
- 업데이트됨: 10 6월 2021
- 활성화: 5

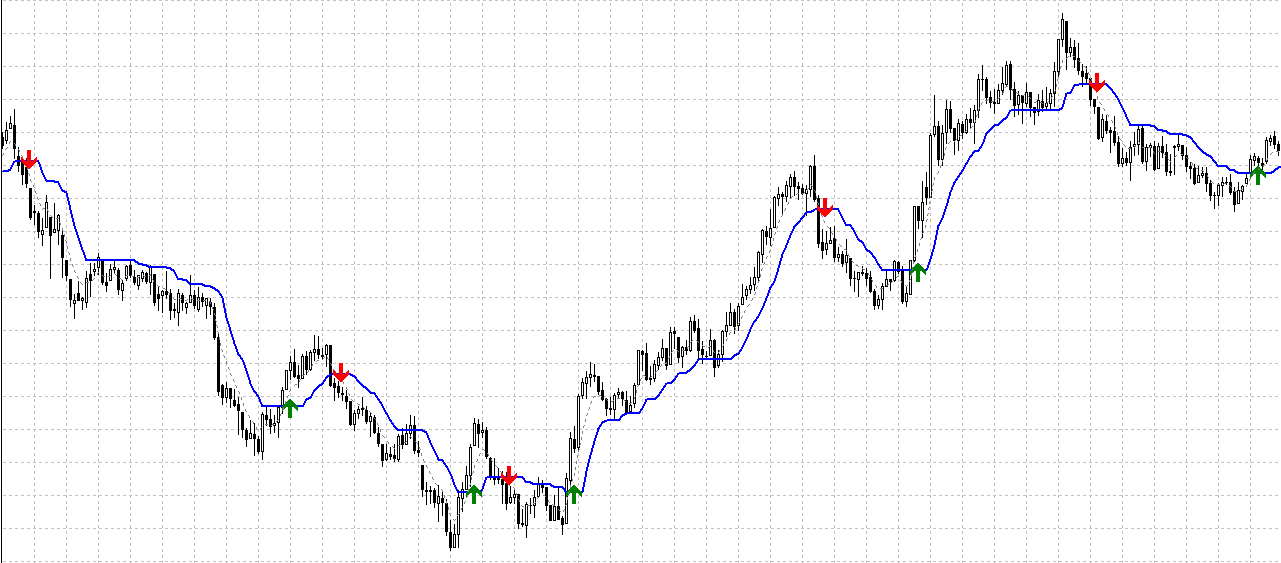
The indicator - "ATR Line" determines the current trend and gives signals to buy (green arrow to the top) or sell (red arrow to the bottom). The indicator calculation is based on the deviation of the average price of the instrument from its average true range - ATR. The moving average of prices is used to reduce "market noise". If the main line of the indicator - "ATR Line" is lower the instrument price chart, then the market is in a "bullish" trend. If the main line of the indicator is higher than the price chart, then the trend is "bearish". Breakdown of the main indicator line - "ATR Line" by the signal moving average line - "Signal Line" from top to bottom, gives a sell signal. Breakdown of the main indicator line - "ATR Line" by the signal moving average line - "Signal Line" from bottom to top gives a signal to buy. The main line of the indicator can be used to set "Stop Loss" or "Take Profit".
Indicator main line parameters:
ATR Period - ATR calculation period.
MA Period - period for calculating the average price.
MA Type - the method for calculating the average price.
ATR ratio - the ratio by which the ATR value is multiplied.
Indicator signal line parameters:
Use signal line - enable or disable the signal line.
Signal MA period - signal moving average period.
Signal MA type - a method for calculating the signal moving average.
Signal MA Price - the price used to calculate the signal moving average.