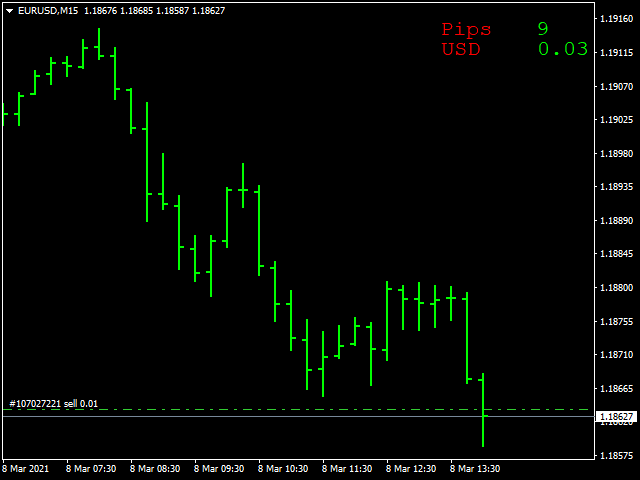
Current Trade Profit
- 지표
- 버전: 15.0
- 업데이트됨: 25 3월 2021
Current Pips and Money Profit
This indicator displays the results of the currently open position on the graph. Result in pips and in the invoice currency. Thanks to this, you can enlarge the chart to the entire screen and have control over the result of trading without opening a terminal window which takes a space of a screen. The display positions of this data can be adjusted at the user's discretion and colors also.
사용자가 평가에 대한 코멘트를 남기지 않았습니다