Advanced MTF MACD

  • MACD – multiple timeframes
  • Indicator name: MACDMTF
  • Indicator used: MACD

Traditional multiple timeframe indicator always has an issue of REPAINTING, when a trader wants to establish his/her strategy using Multi-Time-Frame (MTF).

Generally, you should know how MTF indicator re-paints. But I will explain with the following example:

Suppose that you are using traditional MTF MACD (H4) in (H1) chart. At 15:20, the MACD (H4) dropped below water line (0 level). Now, what happens on H1 chart? MACD of Candle 13:00, 14:00 and 15:00 will drop below the water line, hence you missed the opportunity of MACD zero line cross event (which most of the EA adopts for trading on MACD).

Here we present a solution by introducing a non-repainting MTF MACD indicator. We cannot explain the idea but we can guarantee no repaints on closed bars.

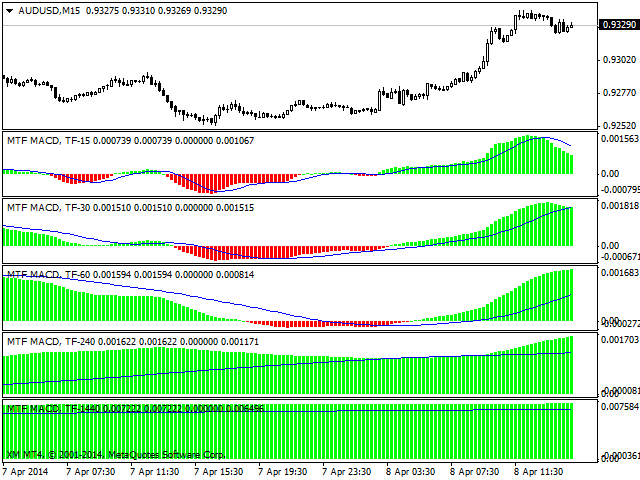
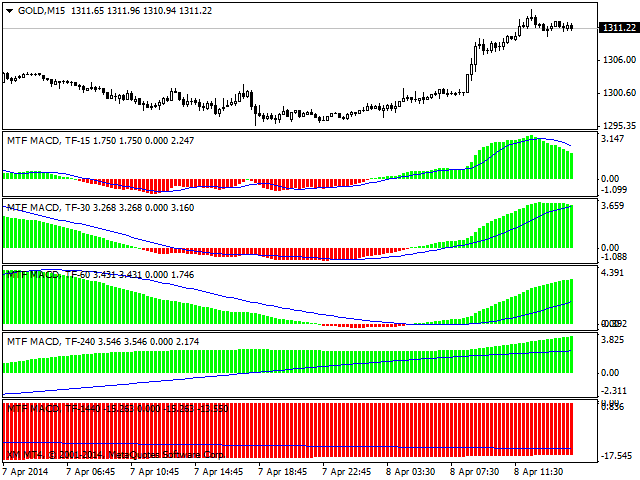
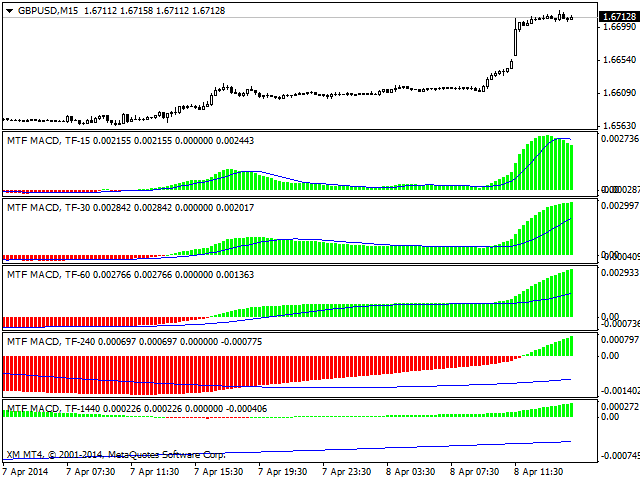
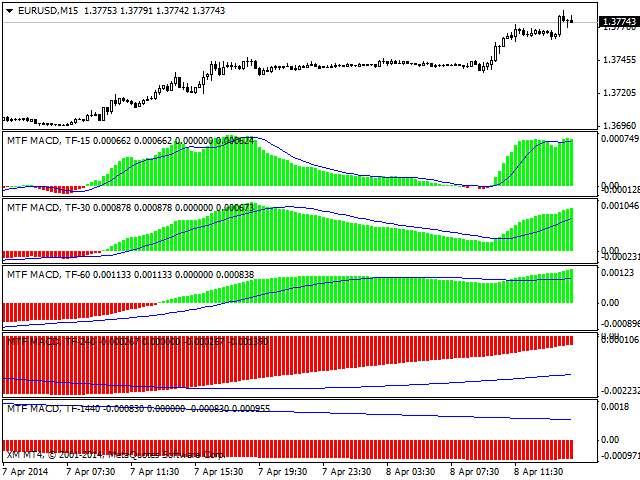
Supported timeframes: M1,M5, M15, M30, H1, H4 and D1.


Input Parameters

  • DesiredTF - empty value means the current timeframe.
  • DesiredTFHelp - please consider capital letters. h1 will not be accepted for H1. Also, you cannot enter the timeframe smaller than the current one. For example, you cannot enter M5 on M15 chart.
  • FastMAPeriod - fast EMA Period (Default 12).
  • SlowMAPeriod - slow EMA Period (Default 26).
  • SignalMAPeriod - signal EMA Period (Default 9).
  • TimeFrameChangeAlerts - if true, then indicator will give alerts when the indicator's timeframe is changed.
  • TrendChangeAlerts - if true, then indicator will give alerts when the trend is changed in the desired timeframe.

For demonstration purpose, 5 separate MACD indicators are displayed on the screenshots with different timeframes using default MA settings.

추천 제품
Trend Map
Maryna Shulzhenko
The Trend Map indicator is designed to detect trends in price movement and allows you to quickly determine not only the direction of the trend, but also to understand the levels of interaction between buyers and sellers. It has no settings and therefore can be perceived as it signals. It contains only three lines, each of which is designed to unambiguously perceive the present moment. Line # 2 characterizes the global direction of the price movement. If we see that the other two lines are above
FXC iMACD-DivergencE MT4 Indicator This is an advanced MACD indicator that finds trend-turn divergences on the current symbol. The indicator detects divergence between the MACD and the price movements as a strong trend-turn pattern. Main features: Advanced divergence settings Price based on Close, Open or High/Low prices Give Buy/Sell open signals PUSH notifications E-mail sending Pop-up alert Customizeable Information panel Input parameters: MACD Fast-EMA: The Fast-EMA variable of the MACD indi
MACD Signals Dashboard
Mihails Babuskins
4 (4)
Download directly the indicator file here. (if you can't open on MT4) MACD Indicator is one of the most popular momentum indicators among users. Searching and detecting MACD signals by the eye may not be easy. Scan Full Charts Dashboard Indicator with simple user interface and search customization panel saves time and scans all charts for MACD signals search and notifies the user with high accuracy. After finding the signal, the user was aware of the result by alerts and notifications. This ind
FREE
MA Acceleration mp
DMITRII GRIDASOV
Crypto_Forex 지표 이동 평균 가속 MT4, 리페인트 없음. MA 가속 - 스캘핑 지표로, "MA 속도" 지표의 보조 도구로 설계되었습니다. - 이 지표의 계산은 물리학의 방정식을 기반으로 합니다. 이동 평균선의 가속을 보여줍니다. - MA 가속으로 표준 전략도 업그레이드할 수 있는 기회가 많습니다. SMA, EMA 및 LWMA에 사용할 수 있습니다. - MA 가속은 해당 이동 평균의 2차 미분입니다. - 지표는 MA 속도 지표가 값을 얼마나 빨리 변경하는지 보여줍니다. - MA 가속 지표의 값이 < 0이면 MA 속도가 하락 방향으로 증가합니다. MA 가속 지표의 값이 > 0이면 MA 속도가 강세 방향으로 증가합니다. - MA 속도 지표와 함께 주요 추세 방향으로 빠른 스캘핑 전략에서 MA 가속 지표를 사용하는 것이 좋습니다. MA 속도 지표의 값이 < 0이면 추세가 하락합니다. MA 속도 지표의 값이 > 0이면 추세가 상승합니다. - 상승 추세: MA 가속 >0일 때
Shock Wave
Camila Bernardez Camero
Shock Wave Signal – 리페인트 없음, 지연 없음, 백페인팅 없음 Shock Wave Signal은 극단적인 CCI 값을 활용하여 모든 타임프레임에서 강력한 모멘텀 반전을 정확히 포착합니다. 가격이 사전 정의된 과매수 또는 과매도 수준에 도달하면 캔들 종가에서 명확한 진입 신호를 생성합니다. 로직 이 인디케이터는 최대 600개의 과거 캔들에 대해 5기간 CCI를 계산합니다. CCI가 +165를 초과하면 매수 신호가, –165 미만이면 매도 신호가 발생하여 가장 강력한 모멘텀만 필터링합니다. 신호 위치 매수 마커는 신호를 발생시킨 캔들의 고가에, 매도 마커는 저가에 표시됩니다. 각 화살표는 캔들 종가 시 한 번만 그려지며 고정되어 리페인트나 백페인팅이 없습니다. 타임프레임 Shock Wave Signal은 M1부터 MN1까지 모든 타임프레임에서 작동하지만, CCI 극값이 트렌드 전환과 일치하기 쉬운 H1 및 H4에서 최상의 성능을 발휘합니다. 더 짧은 타임프레임에서도 모멘
MACD Intraday Trend PRO는 1960년대 Gerald Appel이 만든 원본 MACD를 개조하여 개발한 지표입니다. 수년간의 거래를 통해 MACD의 매개변수를 피보나치 비율로 변경함으로써 추세 움직임의 연속성을 더 잘 표현함으로써 가격 추세의 시작과 끝을 보다 효율적으로 감지할 수 있다는 것이 관찰되었습니다. 가격 추세를 감지하는 효율성으로 인해 상단과 하단의 차이를 매우 명확하게 식별하여 거래 기회를 더 잘 활용할 수도 있습니다. 특징 표시기 MACD Intraday Trend PRO는 모든 통화 쌍, 모든 시간대 및 Renko 차트에서 작동합니다. 5가지 모드를 선택하여 추세 감지 속도를 설정할 수 있습니다. 가장 빠른 빠른 정상 느린 가장 느림 자원 6개의 구성 가능한 경고가 있습니다. MACD는 신호 라인에서 후퇴 MACD가 신호선을 넘다 MACD는 레벨 0을 교차 신호선이 레벨 0을 넘습니다. MACD 변경 트렌드 색상 신호선 변경 TREND 색상
Mini Crypto Trading Dashboard
Opengates Success International
Micro Crypto Trading Dashboard This is a custom indicator created to give CRYPTO TRADERS a full view of what is going on in the Crypto market. It uses a real time data to access the market and display every bit of information needed to make successful trading. This is a Micro size of the Compact Crypto Market Trading Dashboard Indicator created mainly for trading Crypto Currencies Markets for a living. They practically perform the same operation but MicroMini FFMV Dashboard has a few features.
This indicator is based on the MACD on one or more timeframes and on any Currency Cross Pair. The indicator generates an alert message when it detects a buy or sell signal. It also draws a vertical bar on the price chart: green for buy or red for sell, yellow if flat. Alert messages and Vertical bars for BUY or SELL, are generated when the MACD is consistent for all chosen timeframes else a FLAT signal is generated. Features Easy flexible settings: Detection of the MACD signal for one or more t
The indicator detects and displays Shark harmonic pattern (see the screenshot). The pattern is plotted by the extreme values of the ZigZag indicator (included in the resources, no need to install). After detecting the pattern, the indicator notifies of that by a pop-up window, a mobile notification and an email. The indicator highlights the process of the pattern formation and not just the complete pattern. In the former case, it is displayed in the contour triangles. After the pattern is comple
This product is a part of  ON Trade Waves Patterns Harmonic Elliot Wolfe you can test free version on EURJPY from this link  Wolf Waves Indicator 울프 웨이브(Wolf Waves) 발견하기 - 귀하의 궁극적인 거래 도구! 어떤 시간 프레임에서든 울프 웨이브를 쉽게 찾을 수 있는 강력한 도구를 찾고 계신가요? 더 이상 찾을 필요가 없습니다! 저희의 울프 웨이브 인디케이터는 이 작업을 쉽게 해내며, 여기서 왜 귀하에게 완벽한지 설명하겠습니다: 주요 기능: 자동 감지: 우리의 울프 웨이브 인디케이터는 복잡한 알고리즘을 사용하여 키 포인트를 자동으로 찾아 차트에 해당 선을 그립니다. 수동으로 패턴을 찾아 다니는 번거로움을 이제 더 이상 느낄 필요가 없습니다. 사용자 친화성: 이 인디케이터는 사용하기 간단하게 설계되어 있어 경험이 풍부한 트레이더든 울프 웨이브에 처음 접하는
Wolfe Wave Scanner MT4
Reza Aghajanpour
4.64 (11)
**  All Symbols  x  All Timeframes  scan just by pressing scanner button ** *** Contact me  to send you instruction and add you in "Wolfe Wave Scanner group" for sharing or seeing experiences with other users. Introduction: A Wolfe Wave is created with five-wave patterns in price. It shows supply and demand and a fight towards a balance price. T hese waves of price actions can help traders identify the boundaries of   the trend . Also  It helps forecast how the price will move in the near future
Wave Wolf MT4
Andrei Salanevich
거래 단말기의 현재 창에 늑대 파도를 검색하여 표시하도록 설계되었습니다. 거래에 늑대 파도를 사용하는 상인을위한 훌륭한 지표. 거래 전략에서의 적용은 효율성과 수익성을 크게 증가시킬 것입니다. 표시기에 대한 정보 다른 늑대 웨이브 지표와는 달리,웨이브 고원지 외환 지표는 크게 그 효과를 증가 기능을 가지고 있습니다: 첫 번째는 열린 창 5 점 매개 변수(진정한 값)정보 지원을 제공합니다,즉 늑대 파도가 나타난 차트의 창을 확장합니다. 예를 들어,유로화 차트가 열려 있고 각각에 웨이브 월드 표시기가 설치되어있는 경우 유로화 모델이 감지되면 해당 차트가 자동으로 다른 차트의 맨 위에 포 그라운드로 가져 오므로 많은 상품을 거래 할 때 매우 편리합니다.  두 번째 기능은 맥 디에 내장 된 발산 분석,사용자가 자신을 선택할 수있는 매개 변수(기본 설정(12,26,9))입니다. 그런데 일반적인 오실레이터의 값은 작업 창에 표시되지 않으며 점을 형성 할 때 가격 라벨의 색상에만 반영됩니다
MACD Trend Break
Manoj Kumar Sharma
고급 추세 필터링 및 경고 표시 기능이 있는 MACD 오실레이터. 추세를 결정하고 약한 추세는 걸러지고 추세의 새로운 강점이 표시됩니다. MACD 오실레이터는 모든 시간대와 모든 기호(통화, 지수, 오일, 금속, 주식, 옵션, 오프라인 renko 차트)에서 작동합니다. 1. 사용자는 MACD 값을 변경할 수 있습니다. 2. 최소 MACD 레벨 필터, 3. 나누기 값은 차트에서 추세 변경 표시가 필요한 검정력 비율을 필터링합니다. 4. 버퍼 값에는 추세가 변경된 후 경고 신호를 보내기 위해 추가 Macd 값 이동을 제공하는 추가 필터가 있습니다. 5. 경고 추가 메시지 팝업에 대해 True 또는 False를 선택할 수 있습니다. 이 버전은 모든 차트에서 MACD의 다양한 레벨 확인을 사용하여 추세가 변경되는 거래 진입 신호용입니다. 거래 종료의 경우 사용자는 필요에 따라 거래 종료를 위해 자신의 후행 손절매를 사용할 수 있습니다. 권장되는 차트 기간은 H1, H4, D1 및 renk
M W Pattern Pro
Noiros Tech
4.14 (7)
M & W Pattern Pro is an advanced scanner for M and W patters , it uses extra filters to ensure scanned patterns are profitable. The indicator can be used with all symbols and time frames. The indicator is a non repaint indicator with accurate statistics calculations. To use , simply scan the most profitable pair using the statistics dashboard accuracy , then enter trades on signal arrow and exit at the TP and SL levels. STATISTICS : Accuracy 1 : This is the percentage of the times price hits TP
ZhiBiCCI MT4
Qiuyang Zheng
[ZhiBiCCI] indicators are suitable for all cycle use, and are also suitable for all market varieties. [ZhiBiCCI] Green solid line is a reversal of bullish divergence. The green dotted line is a classic bullish divergence. [ZhiBiCCI] The solid line to the red is a reverse bearish divergence. The red dotted line is a classical bearish divergence. [ZhiBiCCI] can be set in the parameters (Alert, Send mail, Send notification), set to (true) to send instant signals to the alarm window, email, insta
Market Structure Zig Zag
Lesedi Oliver Seilane
4.66 (29)
Free Market structure zig zag to assist in price action trading the screenshots describe how to use and how to spot patterns new version comes with alerts, email alert and  push notification alert can be used on all pairs  can be used on all timeframes  you can add additional confirmation indicators the indicator shows you your higher high and low highs as well as your lower lows and lower highs  the indication makes price action analysis easier to spot.
FREE
Magic Number Monitor
Armand Andras Kormany
Magic Number Monitor Expert Advisor Description The Magic Number Monitor is a sophisticated Expert Advisor designed to track and analyze the performance of multiple trading strategies by monitoring magic numbers and symbols. This powerful tool provides real-time performance metrics for each magic number-symbol combination, allowing traders to effectively manage and evaluate multiple strategies simultaneously. Key Features Performance Tracking Multi-Strategy Monitoring : Tracks multiple magic num
MRPHN Indicator
Affifuddin Bin Mohd Hazam
iMRPHN: Supertrend & Swing Reversal Indicator A trading indicator that integrates Supertrend zone detection with swing-based entry logic. Designed for traders who apply both trend-following and counter-trend approaches. The indicator works across multiple timeframes and offers several helpful visual and alert-based features. Key Features: Automatic identification of swing high and swing low levels Automatic Fibonacci retracement Supertrend reversal zone visualization in real-time Highlights are
This indicator is based on the Bollinger Bands on one or more timeframes and on any Currency Cross Pair. The indicator generates an alert message when it detects a buy or sell signal. It also draws a vertical bar on the price chart: green for buy or red for sell, white if flat. Alert messages and Vertical bars for BUY or SELL, are generated when the Bollinger Bands is consistent for all chosen timeframes else a FLAT signal is generated. In addition, the Multi TimeFrames Bollinger Bands Signals i
BE auto
Muhammad Ridzuan Mohd Radzali
5 (2)
Indicator automatically draw bullish and bearish engulfing without any rules. Bearish and Bullish engulf is well known area for supply and demand area marking. This indicator can be used in any strategy that required supply demand zone. Show Last Engulf : Enable this option to show unfresh engulfing  Candle to calculate : set 0 will load all history bar and can use up more memory Bearish Engulfing Colour : Pick any colour that suit Bearish Engulfing Colour  : Pick any colour that suit -Use this
FREE
This is a combination of multiple oscillators into a single divergence system that creates the impression of a more reliable divergence indicator. It is multi-currency based and works best on 15 minutes timeframe and above. Every time a signal is generated, it shows an alert to the user. It is more ideal if combined with other price action indicators or trading systems.
StochDiver PRO
Huu Tri Nguyen
StochDiver PRO – Smart Stochastic Divergence Detector Overview: StochDiver PRO is an advanced divergence detection indicator that identifies both regular and hidden divergences between price action and the Stochastic oscillator . It's especially useful for traders applying DCA (dynamic cost averaging) or reversal strategies. ️ Key Features: Detects bullish and bearish divergences (regular & hidden) Draws price trendlines and indicator trendlines Optional real-time alert notifications
MT4용 Crypto_Forex 지표 "트렌드 지그재그가 적용된 MACD" - MACD 지표 자체는 트렌드 트레이딩에 가장 인기 있는 도구 중 하나입니다. - "MACD with Trend ZigZag"는 가격 액션 항목과 함께 사용하거나 다른 지표와 함께 사용하기에 매우 좋습니다. - 이 지표를 사용하여 가장 정확한 진입 신호를 선택합니다. _ MACD가 0(녹색) 위에 있고 지그재그 선이 위쪽이면 매수 가격 액션 패턴만 검색합니다. _ MACD가 0(분홍색) 아래에 있고 지그재그 선이 아래쪽이면 매도 가격 액션 패턴만 검색합니다. - 지표에는 모바일 및 PC 알림이 내장되어 있습니다. 여기를 클릭하여 고품질 트레이딩 로봇과 지표를 확인하세요! 이 MQL5 웹사이트에서만 제공되는 오리지널 제품입니다.
GGP Wave Trend Oscillator MT4
Mohammadmahmood Pirayeh
The GGP Wave Trend Oscillator MT4   Indicator is a volatility and momentum tool designed to help traders optimize their trading performance and providing traders find the most accurate market reversals. This indicator is MT4 conversion of the Indicator: WaveTrend Oscillator [WT] by “ LazyBear “ in Trading View website and some alert methods are added to provide real-time alerts when a trading signal is generated, in order to allow traders to act quickly and efficiently. When the oscillator is ab
MACDivergence MTF
Pavel Zamoshnikov
4.29 (7)
Advanced ideas of the popular MACD indicator: It detects and displays classic and reverse divergences (three methods of detecting divergences). It uses different color to highlight an uptrend and a downtrend. Two methods of determining a trend: а) MACD crosses the 0 level (classic signal); б) MACD crosses its own average (early signal). This is a multi-timeframe indicator: it can display MACD data from other timeframes. Two methods of drawing: classic histogram and line. It generates sound and v
The   Fibonacci Confluence Toolkit   is a technical analysis tool designed to help traders identify potential price reversal zones by combining key market signals and patterns. It highlights areas of interest where significant price action or reactions are anticipated, automatically applies Fibonacci retracement levels to outline potential pullback zones, and detects engulfing candle patterns. Its unique strength lies in its reliance solely on price patterns, eliminating the need for user-define
MACD Color
Dmitriy Moshnin
MACD Color ( please see the description and video ) is an indicator for the MetaTrader 4 trading platform that is similar to MACD Message . Unlike the standard indicator, it changes the bar edge color when there is a change in the market situation - a change in the trend strength or a change in the inclination of the main EMA which represents the zero level - it changes the color of the zero level (this parameter can be disabled in the settings). Take a look at how the indicator can be used in a
SuperTrend Scanner
FXsolutions
4.38 (13)
This scanner shows the trend values of the well known indicator SuperTrend for up to 30 instruments and 8 time frames. You can get alerts via MT4, Email and Push-Notification as soon as the direction of the trend changes. Important Information How you can maximize the potential of the scanner, please read here: www.mql5.com/en/blogs/post/718074 You have many possibilities to use the scanner. Here are two examples: With this scanner you can trade a top-down approach easily. If two higher time f
Owl smart levels
Sergey Ermolov
4.24 (37)
MT5 버전  |   FAQ Owl Smart Levels Indicator 는   Bill Williams 의 고급 프랙탈, 시장의 올바른 파동 구조를 구축하는 Valable ZigZag, 정확한 진입 수준을 표시하는 피보나치 수준과 같은 인기 있는 시장 분석 도구를 포함하는 하나의 지표 내에서 완전한 거래 시스템입니다. 시장과 이익을 취하는 장소로. 전략에 대한 자세한 설명 표시기 작업에 대한 지침 고문-거래 올빼미 도우미의 조수 개인 사용자 채팅 ->구입 후 나에게 쓰기,나는 개인 채팅에 당신을 추가하고 거기에 모든 보너스를 다운로드 할 수 있습니다 힘은 단순함에 있습니다! Owl Smart Levels   거래 시스템은 사용하기 매우 쉽기 때문에 전문가와 이제 막 시장을 연구하고 스스로 거래 전략을 선택하기 시작한 사람들 모두에게 적합합니다. 전략 및 지표에는 눈에 보이지 않는 비밀 공식 및 계산 방법이 없으며 모든 전략 지표는 공개되어 있습니다. Owl Smart Leve
FXC iDeM-DivergencE MT4 Indicator This is an advanced DeMarker indicator that finds trend-turn divergences on the current symbol. The indicator detects divergence between the DeMarker and the price movements as a strong trend-turn pattern. Main features: Advanced divergence settings Price based on Close, Open or High/Low prices Give Buy/Sell open signals PUSH notifications E-mail sending Pop-up alert Customizeable Information panel Input parameters: DeM Period: The Period size of the DeMarker in
이 제품의 구매자들이 또한 구매함
Miraculous Indicator – Gann Square of Nine 기반 100% 비리페인트 Forex 및 바이너리 도구 이 영상은 Miraculous Indicator 를 소개합니다. 이 지표는 Forex 및 바이너리 옵션 트레이더를 위해 특별히 개발된 매우 정확하고 강력한 트레이딩 도구입니다. 이 지표가 독특한 이유는 전설적인 **Gann Square of Nine(Gann 9의 사각형)**과 **Gann's Law of Vibration(Gann 진동의 법칙)**에 기반을 두고 있기 때문입니다. 이는 현대 트레이딩에서 가장 정밀한 예측 도구 중 하나로 손꼽힙니다. Miraculous Indicator는 완전히 비리페인트(non-repaint) 됩니다. 즉, 캔들이 마감된 후에도 신호가 변경되거나 사라지지 않습니다. 보이는 것이 곧 결과입니다. 이는 트레이더가 자신감을 가지고 거래에 진입하고 청산할 수 있는 신뢰할 수 있고 일관된 기반을 제공합니다. 주요 특징: Gann
Precautions for subscribing to indicator This indicator only supports the computer version of MT4 Does not support MT5, mobile phones, tablets The indicator only shows the day's entry arrow The previous history arrow will not be displayed (Live broadcast is for demonstration) The indicator is a trading aid Is not a EA automatic trading No copy trading function The indicator only indicates the entry position No exit (target profit)  The entry stop loss point is set at 30-50 PIPS Or the front hi
Gann Made Easy
Oleg Rodin
4.83 (155)
Gann Made Easy 는 mr.의 이론을 사용하여 최고의 거래 원칙을 기반으로 하는 전문적이고 사용하기 쉬운 Forex 거래 시스템입니다. W.D. 간. 이 표시기는 Stop Loss 및 Take Profit Levels를 포함하여 정확한 BUY 및 SELL 신호를 제공합니다. PUSH 알림을 사용하여 이동 중에도 거래할 수 있습니다. 거래 팁, 보너스, GANN MADE EA를 무료로 받으시려면 구매 후 저에게 연락주세요! 아마도 Gann 거래 방법에 대해 이미 여러 번 들었을 것입니다. 일반적으로 Gann의 이론은 초보자 거래자뿐만 아니라 이미 거래 경험이 있는 사람들에게도 매우 복잡한 것입니다. Gann의 거래 방식은 이론적으로 적용하기 쉽지 않기 때문입니다. 나는 그 지식을 연마하고 Forex 지표에 최고의 원칙을 적용하기 위해 몇 년을 보냈습니다. 표시기는 적용하기가 매우 쉽습니다. 차트에 첨부하고 간단한 거래 권장 사항을 따르기만 하면 됩니다. 지표는 지속적으로 시장
M1 Sniper
Oleg Rodin
5 (18)
M1 SNIPER 는 사용하기 쉬운 거래 지표 시스템입니다. M1 시간대에 맞춰 설계된 화살표 지표입니다. 이 지표는 M1 시간대 스캘핑을 위한 단독 시스템으로 사용할 수 있으며, 기존 거래 시스템의 일부로도 사용할 수 있습니다. 이 거래 시스템은 M1 시간대 거래용으로 특별히 설계되었지만, 다른 시간대에도 사용할 수 있습니다. 원래는 XAUUSD와 BTCUSD 거래를 위해 이 방법을 설계했지만, 다른 시장 거래에도 유용하다는 것을 알게 되었습니다. 이 지표의 신호는 추세 방향과 반대로 거래될 수 있습니다. 저는 지표의 신호를 활용하여 양방향으로 거래할 수 있도록 돕는 특별한 거래 기법을 알려드립니다. 이 방법은 특별한 동적 지지선과 저항선 가격 영역을 활용하는 것을 기반으로 합니다. 구매하시면 M1 SNIPER 화살표 지표를 바로 다운로드하실 수 있습니다. 또한, 아래 스크린샷에 표시된 Apollo Dynamic SR 지표는 M1 SNIPER 도구를 사용하는 모든 사용자에게 무료로
Meravith
Ivan Stefanov
5 (2)
마켓 메이커를 위한 도구. Meravith는 다음과 같은 기능을 제공합니다: 모든 타임프레임을 분석하고 현재 유효한 추세를 표시합니다. 강세와 약세 거래량이 동일한 유동성 구간(거래량 균형 구간)을 강조 표시합니다. 서로 다른 타임프레임의 모든 유동성 레벨을 차트에 직접 표시합니다. 텍스트 기반 시장 분석을 생성하여 참고용으로 제공합니다. 현재 추세를 기반으로 목표가, 지지선 및 손절가를 계산합니다. 거래의 위험 대비 보상 비율(Risk/Reward)을 계산합니다. 계좌 잔고에 따라 포지션 크기를 산출하고 잠재 수익을 추정합니다. 시장에 중대한 변화가 발생할 경우 경고도 제공합니다. 지표의 주요 라인: 강세/약세 거래량 소진 라인 — 목표가로 사용됩니다. 시장 추세를 나타내는 라인. 시장이 강세인지 약세인지에 따라 색상이 변경되며 추세 지지선 역할을 합니다. 색상은 주로 시장 심리를 보여줍니다. 거래량 균형선(Eq). Eq(Volume Equilibrium) 라인은 시스템의 핵심입니
RFI levels PRO
Roman Podpora
5 (1)
이 지표는 추세 반전 지점과 가격 반등 영역을 정확하게 보여줍니다.       주요 투자자들   . 새로운 트렌드가 형성되는 곳을 파악하고 최대한 정확하게 의사결정을 내리며 모든 거래를 완벽하게 통제합니다. TREND LINES PRO   지표와 함께 사용할 때 최대의 잠재력을 발휘합니다. 지표가 보여주는 내용: 새로운 추세의 시작 시 활성화되는 반전 구조 및 반전 수준. 최소한의 위험 대비 수익률을 갖는 이익 실현   (TAKE PROFIT)   및   손절매(STOP LOSS)   레벨 표시       RR 1:2   . 지능형 손실 감소 로직이 적용된 손절매 기능. 지정된 지표에서 두 가지 추세 유형에 대한 반전 패턴을 표시합니다. 지표: 트렌드를 따라   트렌드 라인 프로   (글로벌 트렌드 변화) 트렌드 프로   (빠른 트렌드 변화) 간단하고 효과적입니다       스캐너       실시간 추세 (신규). 다중 시간 프레임 도구 필터링. 표시하다       이익      
Game Changer Indicator
Vasiliy Strukov
4.37 (19)
Game Changer는 모든 금융 상품에 적용 가능한 혁신적인 추세 지표로, MetaTrader를 강력한 추세 분석 도구로 탈바꿈시켜 줍니다. 모든 시간대에서 작동하며 추세 식별, 잠재적 반전 신호 제공, 트레일링 스톱 기능, 그리고 신속한 시장 대응을 위한 실시간 알림 기능을 제공합니다. 숙련된 전문가든 이제 막 시작하는 초보자든, Game Changer는 추세의 역학을 명확하게 이해하고 자신감 있고 규율 있는 거래를 할 수 있도록 도와줍니다. 이 지표는 차트 재구성 기능을 지원합니다. 구매 후 즉시 연락 주시면 특별 보너스를 드립니다. Strong Support 및 Trend Scanner 지표를 무료로 제공해 드립니다. [email protected]으로 메시지를 보내주세요. 참고로, 저는 텔레그램에서 EA나 특별 세트를 판매하지 않습니다. 모든 EA는 MQL5에서만 사용 가능하며, 세트 파일은 제 블로그(여기)에서만 다운로드하실 수 있습니다. 사기꾼을 조심하시고 다른 사
MetaForecast M4
Vahidreza Heidar Gholami
5 (2)
MetaForecast는 가격 데이터의 조화를 기반으로 모든 시장의 미래를 예측하고 시각화합니다. 시장이 항상 예측 가능한 것은 아니지만 가격에 패턴이 있다면 MetaForecast는 가능한 정확하게 미래를 예측할 수 있습니다. 다른 유사한 제품과 비교했을 때, MetaForecast는 시장 동향을 분석하여 더 정확한 결과를 생성할 수 있습니다. 입력 매개변수 Past size (과거 크기) MetaForecast가 미래 예측을 생성하기 위한 모델을 만드는 데 사용하는 막대의 수를 지정합니다. 모델은 선택한 막대 위에 그려진 노란색 선으로 표시됩니다. Future size (미래 크기) 예측해야 할 미래 막대의 수를 지정합니다. 예측된 미래는 핑크색 선으로 표시되며 그 위에 파란색 회귀선이 그려집니다. Degree (차수) 이 입력은 MetaForecast가 시장에서 수행할 분석 수준을 결정합니다. Degree 설명  0 차수 0의 경우, "Past size" 입력에 모든 봉우리와
PRO Renko System
Oleg Rodin
5 (30)
PRO Renko System 은 RENKO 차트 거래를 위해 특별히 고안된 매우 정확한 거래 시스템입니다. 이것은 다양한 거래 상품에 적용될 수있는 보편적 인 시스템입니다. 체계는 효과적으로 당신에게 정확한 반전 신호에 접근을 주는 소위 시장 소음을 중화합니다. 이 표시기는 사용하기가 매우 쉽고 신호 생성을 담당하는 매개 변수가 하나만 있습니다. 당신은 쉽게 당신의 선택의 어떤 무역 계기에 공구를 적응시킬 수 있고 renko 막대기의 크기. 나는 항상 당신이 내 소프트웨어로 수익성있게 거래 할 수 있도록 추가 지원을 제공 할 준비가되어 있습니다! 나는 당신에게 행복하고 수익성있는 거래를 기원합니다! 구매 후 저에게 연락하십시오! 내 렌코 차트 생성기를 보내드립니다. 또한 내 개인 권장 사항 및 시스템의 다른 모듈을 무료로 공유 할 것입니다!
GoldRush Trend Arrow Signal
Kirk Lee Holloway
5 (2)
GoldRush 트렌드 화살표 신호 GoldRush 트렌드 화살표 신호 지표는 XAU/USD 시장에서 고속 단기 스캘핑 트레이더를 위해 설계된 정밀한 실시간 트렌드 분석을 제공합니다. 1분 시간대에 특화되어 설계된 이 도구는 명확한 진입점을 표시하는 방향성 화살표를 제공하여 스캘퍼들이 변동성이 높은 시장 환경에서도 자신 있게 거래할 수 있도록 합니다. 이 지표는 PRIMARY 및 SECONDARY 경고 화살표로 구성됩니다. PRIMARY 신호는 추세 방향의 변화를 나타내는 흰색과 검은색 방향성 화살표이며, SECONDARY 신호는 PRIMARY 화살표가 지시하는 방향을 확인하고 잠재적인 거래 진입점을 표시하는 파란색과 빨간색 화살표입니다. 참고: 추세 방향이 변경된 후 PRIMARY 경고 화살표가 단 하나만 표시될 경우, 다수의 SECONDARY 파란색/빨간색 화살표가 표시될 수 있음을 유의해야 합니다. SECONDARY 신호는 신호 기준을 충족하는 어떤 캔들 이후에도 표시
Gold Signal Pro
Mohamed Hassan
First 25 copies at $80, after that price becomes $149 (3 copies left) Gold Signal Pro is a powerful MT4 indicator designed to help traders spot strong price reactions in the market. It focuses on clear wick rejections , showing when price strongly rejects a level and often continues in the same direction. Gold Signal Pro is mainly built for scalping gold (XAUUSD) and works best on lower timeframes like M5 and M15 , where timing matters most. That said, it can also be used on any forex pair, a
TPSpro RFI Levels
Roman Podpora
4.86 (28)
러시아어 설명서  /  영어   설명서  /  MT5 버전 주요 기능: 판매자와 구매자의 활동 영역을 표시합니다! 이 지표는 매수 및 매도에 대한 모든 올바른 첫 번째 임펄스 레벨/존을 표시합니다. 진입점 검색이 시작되는 이러한 레벨/존이 활성화되면 레벨의 색상이 바뀌고 특정 색상으로 채워집니다. 상황을 더욱 직관적으로 파악할 수 있도록 화살표도 표시됩니다. LOGIC AI - 템플릿 활성화 시 진입점 검색을 위한 영역(원) 표시 시각적 명확성을 개선하기 위해 인공지능을 사용하여 진입점을 검색한 영역을 표시하는 기능이 추가되었습니다. 더 높은 시간대의 레벨/존 표시(MTF 모드) 더 높은 시간 간격을 사용하여 레벨/존을 표시하는 기능이 추가되었습니다. 또한, 이 지표는 자동 추세 감지 기능(   TPSproTREND PRO   )을 구현했습니다. 거래를 위한 별도의 전문적인 단계별 알고리즘 이 알고리즘은 추세 방향과 반대 방향으로의 당일 거래 모두에 적합하도록 설계되었습니다. 각
Trend indicator AI
Ramil Minniakhmetov
4.7 (79)
트렌드 인공 지능 지표는 실행 가능한 진입 점 및 반전 경고와 추세 식별을 결합하여 상인의 시장 분석을 향상시킬 훌륭한 도구입니다. 이 표시기는 사용자가 자신감과 정밀도로 외환 시장의 복잡성을 탐색 할 수 있도록 지원합니다 기본 신호 외에도 트렌드 인공 지능 지표는 풀백 또는 되돌림 중에 발생하는 2 차 진입 점을 식별하여 거래자가 기존 트렌드 내에서 가격 수정을 활용할 수 있도록합니다. 중요한 장점: ·작동 4 및 5 *명확한 구매 또는 판매 신호 *다시 칠하지 않습니다 *모든 자산에서 작동 나는 전보 사기에 개 또는 세트를 판매하지 않도록주의. 모든 설정은 블로그에 여기에 무료.  중요! 지침 및 보너스를 얻기 위해 구입 후 즉시 저에게 연락! 진짜 가동 감시는 뿐 아니라 나의 다른 제품 여기에서 찾아낼 수 있습니다: https://www.mql5.com/en/users/mechanic/seller&nbsp ; 설정 및 입력: 모든 자산에 대해 기본 설정을 권
Trend Lines PRO
Roman Podpora
5 (1)
트렌드 라인즈 프로       이 지표는 시장이 실제로 어떤 방향으로 전환되는지 파악하는 데 도움이 됩니다. 실제 추세 반전 지점과 주요 시장 참여자들이 다시 진입하는 지점을 보여줍니다. 보시다시피       BOS 라인       복잡한 설정이나 불필요한 노이즈 없이 더 높은 시간대의 추세 변화와 주요 레벨을 확인할 수 있습니다. 신호는 차트에 다시 그려지지 않고 캔들이 마감된 후에도 계속 표시됩니다. VERSION MT 5   -   RFI LEVELS PRO   표시기   와 결합할 때 최대 잠재력을 발휘합니다. 지표가 보여주는 내용: 실제 변화       추세(BOS 라인) 한 번 신호가 나타나면 그 신호는 계속 유효합니다! 이는 신호를 발생시킨 후 변경될 수 있는 리페인팅 방식의 지표와 중요한 차이점입니다. 리페인팅 방식의 지표는 잠재적으로 자금 손실로 이어질 수 있습니다. 이제 더욱 높은 확률과 정확도로 시장에 진입할 수 있습니다. 또한 화살표가 나타난 후 목표가(익절)
Currency Strength Wizard
Oleg Rodin
4.84 (55)
통화 강도 마법사는 성공적인 거래를 위한 올인원 솔루션을 제공하는 매우 강력한 지표입니다. 표시기는 여러 시간 프레임의 모든 통화 데이터를 사용하여 이 또는 해당 외환 쌍의 힘을 계산합니다. 이 데이터는 특정 통화의 힘을 확인하는 데 사용할 수 있는 사용하기 쉬운 통화 지수 및 통화 전력선의 형태로 표시됩니다. 필요한 것은 거래하려는 차트에 표시기를 부착하는 것뿐입니다. 표시기는 거래하는 통화의 실제 강세를 보여줍니다. 지표는 또한 추세와 거래할 때 유리하게 사용할 수 있는 구매 및 판매 거래량 압력의 극한값을 보여줍니다. 지표는 또한 피보나치에 기반한 가능한 대상을 보여줍니다. 표시기는 PUSH 알림을 포함한 모든 유형의 알림을 제공합니다. 구매 후 연락주세요. 나는 당신과 거래 팁을 공유하고 당신에게 무료로 훌륭한 보너스 지표를 줄 것입니다! 나는 당신에게 행복하고 유익한 거래를 기원합니다!
IQ Gold Gann Levels
INTRAQUOTES
5 (4)
Presenting one-of-a-kind Gann Indicator for XAUUSD IQ Gold Gann Levels is a non-repainting, precision tool designed exclusively for XAUUSD/Gold intraday trading. It uses W.D. Gann’s square root method to plot real-time support and resistance levels, helping traders spot high-probability entries with confidence and clarity. William Delbert Gann (W.D. Gann) was an exceptional market analyst whose trading technique was based on a complex blend of mathematics, geometry, astrology, and ancient calcul
Gold Scalper Super
Aleksandr Makarov
5 (2)
Gold Scalper Super is an easy-to-use trading system. The indicator can be used as a standalone scalping system on the M1 time frame, as well as part of your existing trading system. Bonus: when purchasing an indicator, Trend Arrow Super is provided free of charge, write to us after purchase. The indicator 100% does not repaint!!! If a signal appears, it does not disappear! Unlike indicators with redrawing, which lead to the loss of a deposit, because they can show a signal and then remove it.
Advanced Currency Strength28 Indicator
Bernhard Schweigert
4.91 (657)
현재 40% 할인 초보자 또는 전문가 트레이더를 위한 최고의 솔루션! 이 지표는 우리가 독점 기능과 새로운 공식을 통합했기 때문에 독특하고 고품질이며 저렴한 거래 도구입니다. 단 하나의 차트로 28 Forex 쌍의 통화 강도를 읽을 수 있습니다! 새로운 추세 또는 스캘핑 기회의 정확한 트리거 포인트를 정확히 찾아낼 수 있기 때문에 거래가 어떻게 개선될지 상상해 보십시오. 사용 설명서: 여기를 클릭  https://www.mql5.com/en/blogs/post/697384 그것이 첫 번째, 원본입니다! 쓸모없는 지망생 클론을 사지 마십시오. 더 스페셜  강력한 통화 모멘텀을 보여주는 하위 창의 화살표 GAP가 거래를 안내합니다! 기본 또는 호가 통화가 과매도/과매도 영역(외부 시장 피보나치 수준)에 있을 때 개별 차트의 기본 창에 경고 표시가 나타납니다. 통화 강도가 외부 범위에서 떨어질 때 풀백/반전 경고. 교차 패턴의 특별 경고 추세를 빠르게 볼 수 있는 다중 시간
Smc Blast Signal
Mohit Dhariwal
5 (3)
Full Fledged EA and Alert plus for alerts will also be provided in this offer along with the purchase of Indicator. Limited copies only at this price and Ea too. Grab your copy soon Alert plus for indicator with set file is kept in comment section with the image  SMC Blast Signal with FVG, BOS and trend Breakout The SMC Blast Signal is a Precise trading system for Meta Trader 4 that uses Smart Money Concepts (SMC), including Fair Value Gaps (FVG) and Break of Structure (BOS), to identify high-pr
Pulse Scalping Line - an indicator for identifying potential pivot points. Based on this indicator, you can build an effective Martingale system. According to our statistics, the indicator gives a maximum of 4 erroneous pivot points in a series. On average, these are 2 pivot points. That is, the indicator shows a reversal, it is erroneous. This means that the second signal of the indicator will be highly accurate. Based on this information, you can build a trading system based on the Martingale
Pip Storm Signal
Camila Bernardez Camero
PIP STORM 신호 PIP STORM 은 변동성이 큰 시장 상황에서 초고빈도 실행을 위해 설계된 화살표 기반의 고급 시스템입니다. 이 시스템의 핵심 목표는 지연되거나 과도하게 사용된 인디케이터에 의존하지 않고, 실행 가능한 스캘핑 신호를 지속적으로 제공하는 것입니다. 예측하지 않고, 가격 전환 구간에 정밀하게 반응하며, 최소한의 실시간 확인 로직을 통해 마이크로 브레이크아웃과 유동성 불균형을 포착합니다. 업데이트 받기 향후 릴리스 및 공지사항을 확인하려면 공식 채널에 가입하세요: https://www.mql5.com/en/channels/signalsandindicators 스캘핑 빈도 이 도구는 조용히 사용하기 위한 것이 아닙니다. PIP STORM 은 활성 시장에서 거의 모든 캔들에 대해 공격적이고 지속적으로 신호를 생성하며, 현재의 방향을 확인하거나 중요한 되돌림을 정밀하게 감지합니다. 신호 해석 시각적으로는 단순하지만, 작동 면에서는 매우 강력합니다: 빨
Volatility Trend System - a trading system that gives signals for entries. The volatility system gives linear and point signals in the direction of the trend, as well as signals to exit it, without redrawing and delays. The trend indicator monitors the direction of the medium-term trend, shows the direction and its change. The signal indicator is based on changes in volatility and shows market entries. The indicator is equipped with several types of alerts. Can be applied to various trading ins
Basic Harmonic Patterns Dashboard
Mehran Sepah Mansoor
5 (3)
이 대시보드는 선택한 심볼에 대해 사용 가능한 최신 고조파 패턴을 표시하므로 시간을 절약하고 더 효율적으로 사용할 수 있습니다 / MT5 버전 . 무료 인디케이터: Basic Harmonic Pattern 인디케이터 열 Symbol : 선택한 심볼이 나타납니다 Trend : 강세 또는 약세 Pattern : 패턴 유형(가틀리, 나비, 박쥐, 게, 상어, 사이퍼 또는 ABCD) Entry : 진입 가격 SL: 스톱로스 가격 TP1: 1차 테이크프로핏 가격 TP2: 2차 테이크프로핏 가격 TP3: 3차 테이크프로핏 가격 Current price: 현재 가격 Age (in bars): 마지막으로 그려진 패턴의 나이 주요 입력 Symbols : "28개 주요 통화쌍" 또는 "선택한 심볼" 중에서 선택합니다. Selected Symbols : 쉼표로 구분하여 모니터링하려는 원하는 심볼("EURUSD,GBPUSD,XAUUSD")을 선택합니다. 브로커에 쌍에 접미사 또는 접두사가 있는
- Real price is 200$ - 50% Discount (It is 99$ now) -   It is enabled for 3 purchases. Contact me for extra bonus (Gann Trend   indicator), instruction or any questions! - Non-repaint, No lag - I just sell my products in Elif Kaya Profile, any other websites are stolen old versions, So no any new updates or support. - Lifetime update free Gann Gold EA MT5 Introduction W.D. Gann’s theories in technical analysis have fascinated traders for decades. It offers a unique approach beyond traditional c
FX Power MT4 NG
Daniel Stein
4.95 (21)
FX Power: 통화 강세 분석으로 더 스마트한 거래 결정을 개요 FX Power 는 어떤 시장 상황에서도 주요 통화와 금의 실제 강세를 이해하기 위한 필수 도구입니다. 강한 통화를 매수하고 약한 통화를 매도함으로써 FX Power 는 거래 결정을 단순화하고 높은 확률의 기회를 발견합니다. 트렌드를 따르거나 극단적인 델타 값을 사용해 반전을 예측하고자 한다면, 이 도구는 귀하의 거래 스타일에 완벽히 적응합니다. 단순히 거래하지 말고, FX Power 로 더 스마트하게 거래하세요. 1. FX Power가 거래자에게 매우 유용한 이유 통화와 금의 실시간 강세 분석 • FX Power 는 주요 통화와 금의 상대적 강세를 계산하고 표시하여 시장 역학에 대한 명확한 통찰력을 제공합니다. • 어떤 자산이 앞서고 있고 어떤 자산이 뒤처지는지 모니터링하여 보다 현명한 거래 결정을 내릴 수 있습니다. 포괄적인 멀티 타임프레임 뷰 • 단기, 중기 및 장기 타임프레임에서 통화와 금의 강세를
Atomic Analyst
Issam Kassas
5 (3)
우선적으로 언급할 점은이 거래 지표가 다시 그리지 않고 지연되지 않으며 이를 통해 수동 및 로봇 거래 모두에 이상적이라는 점입니다. 사용자 매뉴얼: 설정, 입력 및 전략. Atomic Analyst는 가격의 강도와 모멘텀을 활용하여 시장에서 더 나은 이점을 찾는 PA Price Action Indicator입니다. 고급 필터를 장착하여 잡음과 거짓 신호를 제거하고 거래 잠재력을 높이는 데 도움이 됩니다. 복잡한 지표의 다중 레이어를 사용하여 Atomic Analyst는 차트를 스캔하고 복잡한 수학적 계산을 간단한 신호와 색상으로 변환하여 초보 트레이더가 이해하고 일관된 거래 결정을 내릴 수 있도록합니다. "Atomic Analyst"는 새로운 및 경험이 풍부한 트레이더를위한 종합적인 거래 솔루션입니다. 프리미엄 지표와 최고 수준의 기능을 하나의 거래 전략에 결합하여 모든 종류의 트레이더에 대한 다재다능한 선택지가되었습니다. 인트라데이 거래 및 스캘핑 전략 : 빠르고 정확한 일일
Apollo SR Master
Oleg Rodin
5 (1)
Apollo SR Master는 지지/저항 구간에서의 거래를 더욱 쉽고 안정적으로 만들어 주는 특수 기능을 갖춘 지지/저항 지표입니다. 이 지표는 지역 가격의 고점과 저점을 감지하여 시간 지연 없이 실시간으로 지지/저항 구간을 계산합니다. 새롭게 형성된 저항 구간을 확인하기 위해 지표는 해당 저항 구간을 실제 매도 또는 매수 신호로 활용할 수 있음을 나타내는 특수 신호를 표시합니다. 이 경우, 저항 구간의 강도가 높아지고, 따라서 저항 구간에서의 성공적인 거래 가능성도 높아집니다. 이것이 바로 이 지표의 핵심 아이디어입니다. SR 존은 손절매와 이익실현을 더욱 쉽게 할 수 있도록 해줍니다. 신호 방향에 따라 SR 존 위 또는 아래 공간을 손절매로 활용할 수 있습니다. 또한, 반대쪽 SR 존은 잠재적 이익실현 영역으로 활용할 수 있습니다. 또한 Apollo SR Master 지표를 사용하는 모든 사용자에게 "Apollo Price Action System" 지표를 무료로 제공합니다.
현재 40% 할인 ! 초보자 또는 전문가 트레이더를 위한 최고의 솔루션! 이 대시보드 소프트웨어는 28개의 통화 쌍에서 작동합니다. 2가지 주요 지표(Advanced Currency Strength 28 및 Advanced Currency Impulse)를 기반으로 합니다. 전체 Forex 시장에 대한 훌륭한 개요를 제공합니다. 고급 통화 강도 값, 통화 이동 속도 및 모든(9) 시간대의 28 Forex 쌍에 대한 신호를 보여줍니다. 추세 및/또는 스캘핑 기회를 정확히 파악하기 위해 차트의 단일 지표를 사용하여 전체 시장을 볼 수 있을 때 거래가 어떻게 개선될지 상상해 보십시오! 잠재적인 거래를 식별하고 확인하면서 강력한 통화와 약한 통화를 더욱 쉽게 식별할 수 있도록 이 지표에 기능을 내장했습니다. 이 표시기는 통화의 강세 또는 약세가 증가 또는 감소하는지 여부와 모든 시간대에서 수행되는 방식을 그래픽으로 보여줍니다. 추가된 새로운 기능은 현재 시장 조건 변화에 적응하는
Scalper Inside PRO
Alexey Minkov
4.74 (69)
* VALENTINE’S DAY 20% SALE * LIMITED TIME OFFER * An exclusive indicator that utilizes an innovative algorithm to swiftly and accurately determine the market trend. The indicator automatically calculates opening, closing, and profit levels, providing detailed trading statistics. With these features, you can choose the most appropriate trading instrument for the current market conditions. Additionally, you can easily integrate your own arrow indicators into Scalper Inside Pro to quickly evaluate
Advanced Arrow
Alfred Kamal
3.9 (39)
This indicator depends on some secrets equations to draw Signals with Stop loss and maximum 4 Take profits. There is a free EA depends on this indicator as a gift when you purchase/rent it. Features Simply it gives you entry point as Ready sign (Buy / Sell) and arrow (Buy / Sell) after candle closed, also SL line and 4 TP lines or less. Once SL-TP lines are shown with the arrow, they remains as they are until signal change. It is historical indicator. No Repaint. user manual for V5 please click
제작자의 제품 더 보기
Moving Average Angle
Bacha Rehman
5 (1)
This indicator shows you the angle of the moving average according to your settings in a separate window. It also shows the angle written on the chart, which can also be adjusted. The main features and input variables provided include: MAPeriod: This is the period for your moving average. The default MAPeriod is 5. LookBack: This is a very important variable. It allows you to set the look back bar, from which the angle will be measured. For example, if your LookBack is 5, then indicator will cal
필터:
리뷰 없음
리뷰 답변