Tails
- 지표
-
Dua Yong Rew
 For success in trading, a solid strategy or EA is essential. Additionally, choosing the right broker is crucial for a smooth journey. Here are the brokers I have traded with and successfully withdrawn funds from.
---
I use FXVM as my VPS provider. Sign up with the link below - 버전: 1.13
- 업데이트됨: 17 4월 2023
- 활성화: 5
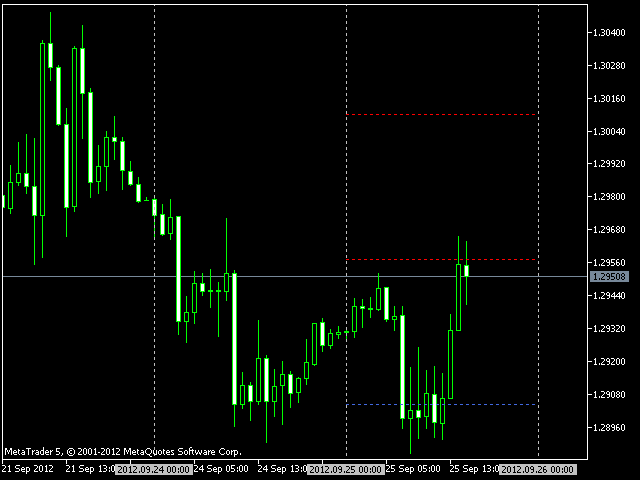
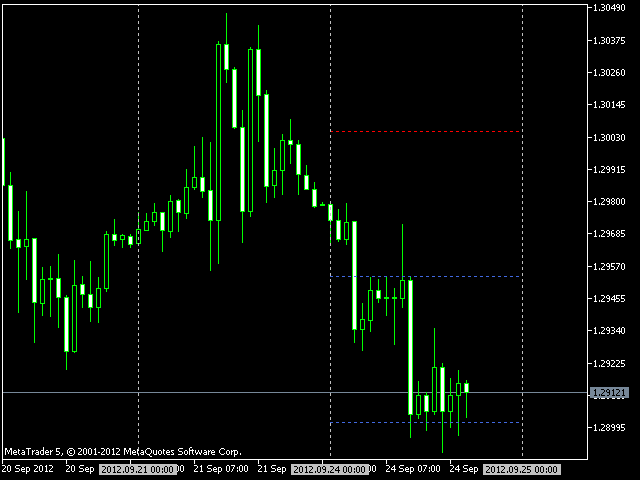
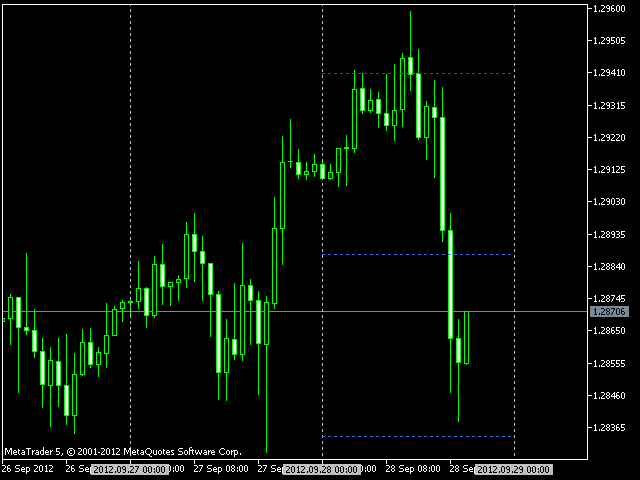
Tails is an indicator that predicts where the price will rebound and reach in a day candle. This indicator does not repaint and is to be used in time frames below D1.
By default, the indicator will plot two support and two resistance lines. If needed, you can set the extended levels to "true" to show three support and three resistance lines.
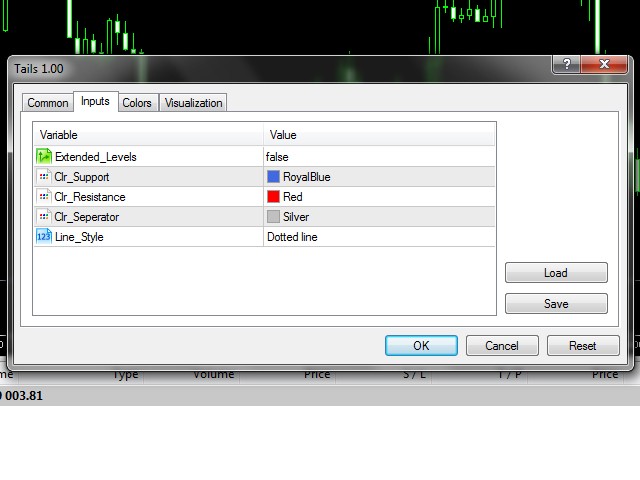
Input Parameters
- Extended_Levels - show extended levels in the chart;
- Clr_Support - color for the support lines;
- Clr_Resistance - color for the resistance lines;
- Clr_Seperator - color for day separators;
- Line_Style - style for the lines.