AQ TExplorer Pro
- 지표
-
HIT HYPERTECH INNOVATIONS LTD
 We are a team of experts in Artificial Intelligence, Computational Finance & Finance with more than 25 years trading experience each, having worked in Hedge funds, big corporations, research institutes & academia. We operate from London, New York, Athens, Cyprus & are incorporated in Cyprus.
 - 버전: 1.0
- 활성화: 5
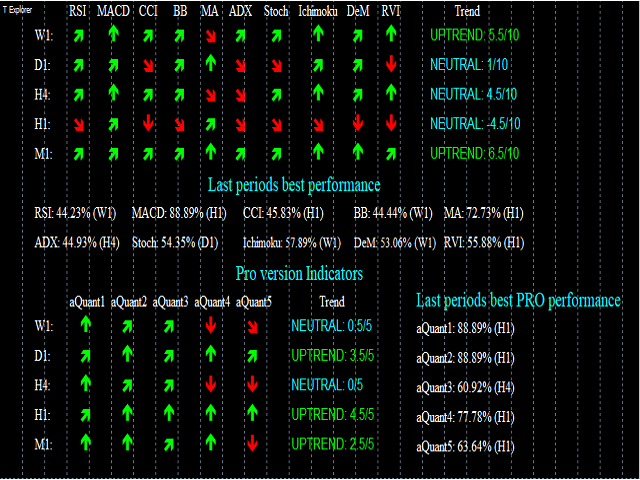
T-Explorer is a Real Time Optimized MetaTrader 4 tool that provides tradable information based on the 10 of the most popular and reliable technical indicators in many timeframes. Our machine learning models calculate the optimum rules and configuration for each indicator in order to provide high probability signals of success.
Users are able to customize T-Explorer by selecting suitable timeframes and mode (FAST, MEDIUM, SLOW) for the indicators to be used.
T-Explorer aggregates and combines optimally the results of all indicators and provides a reliable evaluation for the trend per timeframe.
The most impressive is that our algorithms scan all the indicators on all selected timeframes to provide QUANTIFIED PERFORMANCE of each indicator and to show the BEST PERFORMANCE with its probability to succeed, on the applicable timeframe for the last periods. So for example, a user knows that lately, indicator X has an excellent performance with a certain probability, on a specific timeframe.
T-Explorer provides parameters for full color customization on the selected chart.
T Explorer Pro Version now offers you five more special indicators: aQuant1, aQuant2, aQuant3, aQuant3 and aQuant5. These indicators are custom unique indicators developed by a-Quant, based on Machine Learning/Artificial Intelligence proprietary algorithms. a-Quant proprietary indicators enclose all the power of Machine Learning/Artificial Intelligence. A few years ago, only the big hedge funds and banks had the ability to have such powerful tools.
All indicators are fully parameterized by the user.
All indicators exist in user’s MetaTrader 4 platform, no special installation is needed.
Selected indicators are:
- RSI
- MACD
- CCI
- Bollinger Bands (BB)
- Moving Average (MA)
- ADX
- Stochastic (Stoch)
- Ichimoku
- DeMarker (DeM)
- RVI
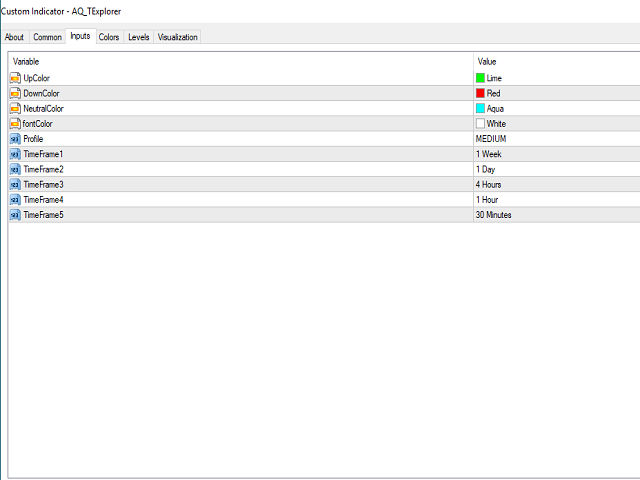
Parameters
- UpColor – color for uptrend
- DownColor – color for downtrend
- NeutralColor – color for neutral trend
- fontColor – size of text font
- Profile – FAST, MEDIUM and SLOW selection effects on the indicators’ parameters
- TimeFrame1 – timeframe selection
- TimeFrame2 – timeframe selection
- TimeFrame3 – timeframe selection
- TimeFrame4 – timeframe selection
- TimeFrame5 – timeframe selection
Suggested Strategy
- Use slow and fast timeframes
- Get the main trend from the slow timeframes
- Wait until fast timeframes signals give an opposite to the main trend signal
- When fast signals come to an agreement again with the main trend, open positions in the direction of the main trend