RSI S Roc Signal Demo
- 지표
- 버전: 1.4
- 업데이트됨: 2 3월 2020

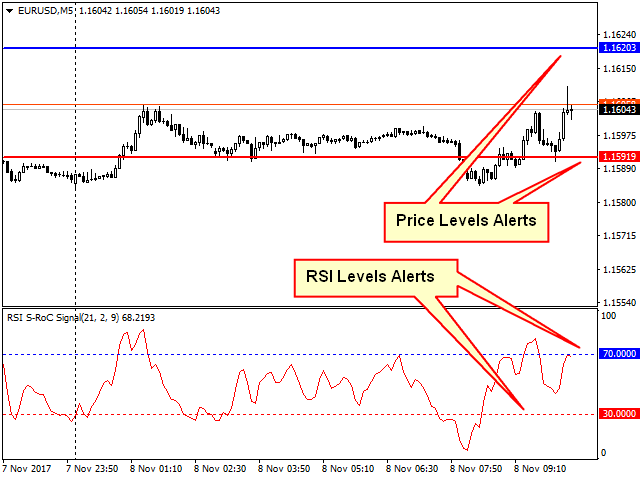
The RSI S-RoC indicator differs from the standard RSI in that it takes into account the price rate of change when calculating values.
When the price moves in a trend, the indicator produces good entry signals oncethe price touches its levels.
The level values can be configured in the indicator settings. They can also be modified and adjusted directly in the indicator window.
You can also set on a chart signal lines. Once they are crossed, the indicator will produce a sound alert or play a user defined audio file.
The indicator also has the function of sending push-notifications when crossing levels.
This product is a demo version of the indicator that works on the EURUSD currency pair. The full version of the indicator: https://www.mql5.com/en/market/product/26342
Configurations
- Period MA - Moving Average period.
- Period S-RoC - period for calculating the price rate of change.
- Period RSI - the RSI indicator period.
Price Alert Settings
- Width Alert Line - the width of signal lines on the price chart.
- Line Distance - the distance in points form the current price, at which signal lines should be created.
- Upper Alert - the upper signal line.
- Upper Price Line Color - the color of the upper signal line.
- Lower Alert - the lower signal line.
- Lower Price Line Color - the color of the lower signal line.
- Sound Alarm - playing a custom audio file when the price crosses signal lines.
- File Name - the name of the audio file as "***.wav". The file should be added to the Sounds folder of the terminal.
RSI Alert Settings
- RSI Alert - alert when the price crosses RSI levels.
- RSI Line Style - line style for RSI levels.
- Width Alert Line - line width for RSI levels.
- Upper RSI Line Color - the color of the upper RSI line.
- Lower RSI Line Color - the color of the lower RSI line.
- Upper RSI Level - the value of the upper RSI line.
- Lower RSI Level - the value of the lower RSI line.
- Sound Alarm RSI - playing a custom audio file when the RSI levels are crossed.
- File Name RSI - the name of the audio file as "***.wav";
- Push-notifications - send push-notifications when crossing levels.