IceFX VelocityMeter

4.67

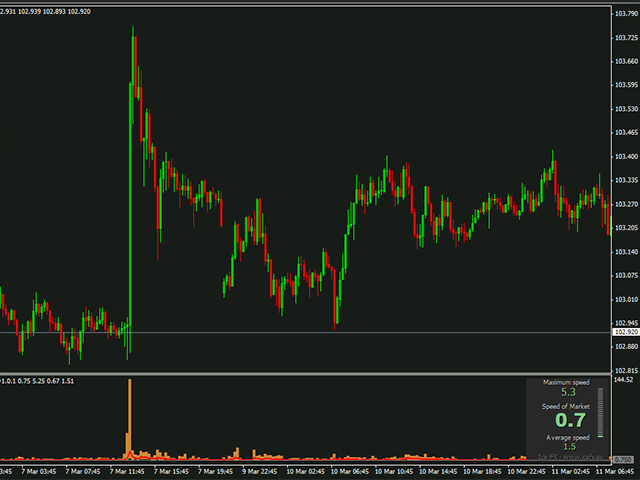
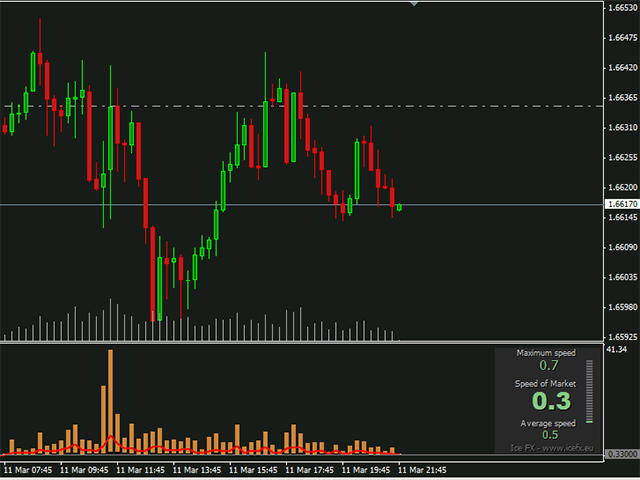
IceFX VelocityMeter is a very unique indicator on MetaTrader 4 platform which measures the speed of the forex market. It's not a normal volume or other measurement indicator because IceFX VelocityMeter is capable to understand market speed movements which are hidden in ticks and those valuable information cannot be read in an ordinary way from the candles.

The software monitors the received ticks (frequency, magnitude of change) within a specified time range, analyzes these info and defines, displays and records a reference value which is typical of the actual market velocity rate. Market speed value is changing with every tick so this Professional Tool has the ability to respond quickly to any changes.

It records minimum/maximum/average values within a candle which are remaining visible even after reboot. All the specified data delivered by VelocityMeter can be read/use by any MetaTrader 4 Expert Advisors (EA).

리뷰 6
Claudio Alves
88
Claudio Alves 2021.08.10 12:31 
 

Maravilhos!!! Ajuda e muito nos acertos.

Alexey Levashov
507
Alexey Levashov 2016.12.08 10:45 
 

5 звезд !!!

추천 제품
Symbol Overlay
John Louis Fernando Diamante
5 (2)
This indicator plots another symbol on the current chart. A different timeframe can be used for the symbol, with an option to display in multiple timeframe mode (1 overlay candle per several chart candles). Basic indicators are provided. To adjust scaling of prices from different symbols, the overlay prices are scaled to the visible chart price space. Features symbol and timeframe input MTF display option to vertically invert chart, eg overlay USDJPY, invert to show JPYUSD data window values; o
FREE
Session High Low
Jerome Asiusin
This indicator help to mark the high and low of the session Asian,London,Newyork , with custom hour setting This indicator is set to count from minute candle so it will move with the current market and stop at the designated hour and create a accurate line for the day. below is the customization that you can adjust : Input Descriptions EnableAsian Enables or disables the display of Asian session high and low levels. EnableLondon Enables or disables the display of London session high and
FREE
BoxInside MT4
Evgeny Shevtsov
4.83 (6)
This indicator calculates the volume profile and places labels that correspond to the VAH, VAL and POC levels, for each candle individually. Indicator operation features The indicator works on the timeframes from M5 to MN, but it uses the history data of smaller periods: M1 - for periods from M5 to H1, M5 - for the H4 period, M30 - for the D1 period, H4 - for the W1 period, D1 - for the MN period. The color and location of the VAL, VAH and POC labels on the current candle are considered to be c
FREE
In trading, being aware of the balance between risk and return is extremely important. This indicator helps you visualize that relationship by displaying a box, allowing you to make decisions based on clear structure rather than intuition. You can quickly understand the position of entry, stop loss, and take profit at a glance, helping you avoid unnecessary or unfavorable trades. [Free Version] - Fixed box color - Risk to return ratio fixed at 1:2 - No auto-delete function - No notification f
FREE
This indicator will mirror the assets in use in another metatrader, being able to choose the timeframe and a template. This is the Metatrader 4 Client, it needs the Metatrader 4 or 5 Server versions: Metatrader 4 Mirror Chart Server: https://www.mql5.com/en/market/product/88644 Metatrader 5 Mirror Chart Server:   https://www.mql5.com/en/market/product/88652 Details of how it works in the video.
FREE
Cumulative Delta MT4
Evgeny Shevtsov
4.86 (29)
The indicator analyzes the volume scale and splits it into two components - seller volumes and buyer volumes, and also calculates the delta and cumulative delta. The indicator does not flicker or redraw, its calculation and plotting are performed fairly quickly, while using the data from the smaller (relative to the current) periods. The indicator operation modes can be switched using the Mode input variable: Buy - display only the buyer volumes. Sell - display only the seller volumes. BuySell -
FREE
Mouse Calculation은 마우스로 가리킨 가격에서 청산한다고 가정했을 때, 각 주문의 손익을 빠르게 계산해 줍니다. 그리드, 마틴, 분할 진입 등 다수 주문 운용 시 빠른 의사결정에 적합합니다. 손익분기 가격과 목표 가격을 한눈에 확인할 수 있습니다. 핵심 기능 Mouse PnL (M) : 주문별/총 손익 미리보기(스왑 swap 포함). Break even Price (B) : 전체 포지션의 손익분기 가격/라인 표시. Time_Sync_Lines (T) : 최근 N일의 동일한 시각을 맞춰 비교; 드래그로 핵심 구간 복기. Panel (P) : 패널 표시/숨김. About (A) : 사용 안내 및 정보. 차트 표시 안내 B / S : 주문의 현재 손익 M : 마우스 가격 기준 “해당 가격 청산 시 손익” 추정 T : 총 손익 추천 사용 시나리오 그리드 : 바스켓 익절 구간을 빠르게 결정. 마틴 : 손익분기/플러스 전환에 필요한 반등 범위를 빠르게 확인. 다수 주문 : 부분 청
FREE
Enhanced Volume Profile: The Ultimate Order Flow & Liquidity Analysis Tool Overview Enhanced Volume Profile   is an indicator for MetaTrader 5 that displays the traded volume at specific price levels over a defined period. It separates the total volume into buy and sell components, presenting them as a side-by-side histogram on the chart. This allows users to observe the volume distribution and the proportion of buy and sell volumes at each price level. Graphics Rendering The indicator uses t
FREE
VSA Histogram
Richard Bystricky
VSA - P (Volume Spread Analysis) Period-Based Histogram is a tool that visually represents market volume dynamics using Volume Spread Analysis principles, with a focus on highlighting key volume changes over specific time periods. The histogram captures changes in volume and price spread relationships in real-time, enabling traders to detect early signals of accumulation, distribution, and shifts in buying or selling pressure. Indicator is non repainting and working with real-time on tick data.
MACD plus TDI
Devy Tanusukma
Moving Average Convergence Divergence (MACD) combined with Traders Dynamic Index (TDI) Input parameters: signal mode: true if you want to plug it into STAT (Signal Tester and Trader) arrow shift: distance between TDI line to arrow on chart middle band: use middle band (middle bolinger band) signal filter price line: use 50 price line signal filter RSI period RSI price method volatility period moving average RSI period moving average signal period moving average method use MACD indicator fast MAC
FREE
Forex Market Profile and Vwap
Lorentzos Roussos
4.86 (7)
외환 시장 프로필(줄여서 FMP) 이것이 아닌 것 : FMP는 일반적인 문자 코드 TPO 표시가 아니며 전체 차트 데이터 프로필 계산을 표시하지 않으며 차트를 기간으로 분할하여 계산하지도 않습니다. 그것이 하는 일: 가장 중요한 것은 FMP 표시기가 사용자 정의 스펙트럼의 왼쪽 가장자리와 사용자 정의 스펙트럼의 오른쪽 가장자리 사이에 있는 데이터를 처리한다는 것입니다. 사용자는 마우스로 표시기의 양쪽 끝을 당기기만 하면 스펙트럼을 정의할 수 있습니다. 표시기 오른쪽 가장자리가 라이브 막대로 당겨지고 더 멀리(미래로) 표시되면 표시기가 "라이브"로 간주됩니다(새 막대로 업데이트됨). 표시기는 첨부된 차트에 "앵커" 개체를 놓은 다음 해당 앵커를 하드 드라이브의 파일과 연결합니다. 이렇게 하면 차트 또는 지표가 닫힐 때까지 다시 시작해도 설정이 유지되어 차트에서 계속 FMP를 실행할 수 있습니다. FMP 지표는 하나의 차트에서 여러 인스턴스를 실행할 수 있으며 이름을 지정할 수
FREE
Tick Speed Free
John Louis Fernando Diamante
5 (1)
Tick Speed Free povides a on-chart label of tick speed to allow you to see the ebb and flow of market activity. Observing rises and falls in tick speed may allow you to better time entries to reduce slippage and re-quotes. Options include: - colores for low-mid-high tick speeds - placement and styling - prefix & suffix to customise the speed label Troubleshooting: - Note, in the tester environment, tick timings are limited to what is supplied by the tester environment and it's speed - If there
FREE
Pips Hunter PRO MT4
Rodrigo Arana Garcia
5 (1)
핍스 헌터 프로는 수년에 걸쳐 개발되었으며 이전 버전보다 개선된 버전입니다. 이 강력한 지표는 시장과 가격 이력을 분석하여 매수 및 매도 항목을 생성합니다. 이러한 항목의 계산을 위해 함께 작동하는 다양한 지표와 덜 유리한 항목을 필터링하고 제거하는 복잡한 통계 로그를 사용합니다 / MT5 버전 . 특징 다시 칠하지 않음 이 인디케이터는 새 데이터가 도착해도 값이 변경되지 않습니다 지연 없음  이 표시기는 지연되지 않습니다 거래 쌍 모든 외환 쌍  (가급적 EURGBP) 타임프레임  모든 차트주기 매개변수 ===== 표시 ===== 화살표 거리 // 신호(화살표)와 캔들스틱 사이의 거리 ===== 알림 ===== 팝업 알림 // MT4 터미널용 알림 푸시 알림 알림 // 휴대폰용 알림 이메일 알림 // 이메일 알림 ===== 차트 설정 ===== 차트에서 캔들 스틱의 색상을 변경하는 옵션 경고 저는 MQL5.com에서만 제품을 판매합니다. 누군가 내
FREE
Zig Zag 123
Stephen Reynolds
Zig Zag 123 tells us when a reversal or continuation is more likely by looking at the shift in supply and demand. When this happens a signature pattern appears known as 123 (also known ABC) will often break out in direction of higher low or lower high. Stop loss and take profit levels have been added. There is a panel that shows the overall performance of your trades for if you was to use these stop loss and take profit levels.  We get alerted if a pattern 123 appears and also if the price re
FREE
Smarter Trend Channel
Moegamat Luqmaan Titus
스마트 트렌드 채널 지표 설명: 스마트 트렌드 채널 지표는 시장의 주요 트렌드를 시각적으로 식별하기 위해 차트에 동적으로 지원선과 저항선을 그려주는 강력하고 유연한 도구입니다. 고급 프랙탈 계산을 사용하여 지표는 시장의 변동에 따라 자동으로 트렌드 라인을 조정하고, 트레이더가 돌파구나 반전 포인트를 식별하는 데 도움을 줍니다. 주요 기능: 채널 표시 제어: 트렌드 채널을 표시하거나 숨길 수 있는 옵션이 있습니다. 동적 프랙탈 계산: 시간 프레임과 프랙탈 파라미터를 기준으로 자동으로 트렌드 라인이 조정됩니다. 명확한 트렌드 시각화: 상한선, 하한선, 중간선의 3개 라인으로 시장 트렌드를 명확히 나타내어 거래 결정을 돕습니다. 사용자 정의 가능한 라인 색상: 라인의 색상을 개별적으로 설정하여 중요한 시장 레벨을 강조하고, 시각적 명확성을 높일 수 있습니다. 다양한 시간 프레임 지원: 1분 차트부터 1개월 차트까지 다양한 시간 프레임에 자동으로 적응합니다. 장점: 강한 시장 트렌드와 반
FREE
Simple Trend AM
Andrii Matviievskyi
5 (1)
The trend is your friend. A simple truth known to every trader. The presented indicator allows you to visualize the current trend. The indicator identifies the trend using the following definition as an algorithm: A trend is a situation when each subsequent maximum price rise is higher/lower than the previous one, and similarly each subsequent maximum price fall is higher/lower than the previous one; The beginning of a new trend is considered to be when the current maximum/minimum overcomes all
FREE
True Points PRO
Evgenii Aksenov
4.53 (15)
True Points PRO   indicator analyzes the dynamics of price changes and determines the true pivot points. The indicator calculates and displays the total profit and the probability of achieving it.  The indicator has built-in Take Profit levels: TP1 captures profit at a given level; TP2 is considered automatically (regulated by the Low Level parameter).  Information about the profit and the current signal is displayed in the moving information panel. The Result parameter calculates all profits a
FREE
Highlights trading sessions on the chart The demo version only works on the AUDNZD chart!!! The full version of the product is available at: (*** to be added ***) Trading Session Indicator displays the starts and ends of four trading sessions: Pacific, Asian, European and American. the ability to customize the start/end of sessions; the ability to display only selected sessions; works on M1-H2 timeframes; The following parameters can be configured in the indicator: TIME_CORRECTION = Correct
FREE
TrendBox Indicator
Ivan Grachev
2.5 (6)
The indicator looks for consolidation (flat) in the market at a certain time, builds a box-channel and marks levels indented from it for a breakdawn. After crossing one of the levels, the indicator marks the zone for take profit and calculates the corresponding profit or loss in the direction of this entry on the panel. Thus, the indicator, adjusting to the market, finds a flat area of the market, with the beginning of a trend movement to enter it. Version for MT5: https://www.mql5.com/en/market
FREE
Market Profile 3
Hussien Abdeltwab Hussien Ryad
3 (2)
Market Profile 3 MetaTrader 4 indicator  — is a classic Market Profile implementation that can show the price density over time, outlining the most important price levels, value area, and control value of a given trading session. This indicator can be attached to timeframes between M1 and D1 and will show the Market Profile for daily, weekly, monthly, or even intraday sessions. Lower timeframes offer higher precision. Higher timeframes are recommended for better visibility. It is also possible t
FREE
MAtrio
Yurij Batura
The MAtrio indicator displays three moving averages on any timeframe at once with a period of 50-day, 100-day, 200-day. After attaching to the chart, it immediately displays three moving averages with the parameters of simple (SMA) moving average SmoothingType50 , simple (SMA) moving average SmoothingType100 , simple (SMA) moving average SmoothingType200 . Accordingly, with the price type ValuePrices50, ValuePrices100, ValuePrices200 , by default, the price is Close price everywhere. All parame
FREE
SX Supply Demand Zones accurately identifies and draws high-probability Supply and Demand zones using a sophisticated algorithm. Unlike traditional indicators that clutter your chart, this indicator is designed with a focus on performance and a clean user experience. New Unique Feature: Interactive Legend System What truly sets this indicator apart from everything else is the Interactive Control Legend. You have a professional dashboard directly on your chart that allows you to: Show/Hide: Ins
FREE
AQ XFifteen
HIT HYPERTECH INNOVATIONS LTD
4 (7)
Χ15 indicator is a MetaTrader 4 tool that allows you to BUILD & BACKTEST ON REAL TIME your own strategies quickly, easily and efficiently. It contains 15 of the most popular technical analysis indicators that you can use, each one in a different way. Choose the indicators that you want to use, select how you will use them and you will see on the chart BUY (green) and SELL (red) arrows implementing your strategy. Choose Take Profit and Stop Loss and you will see the results of your strategy with
FREE
Matrix Arrow Indicator Multi Timeframe Panel MT4 는 Matrix Arrow Indicator MT4 를 위한 무료 추가 기능이자 훌륭한 자산입니다. 5개의 사용자 맞춤형 타임프레임과 총 16개의 수정 가능한 기호/기기에 대한 현재 매트릭스 화살표 표시기 MT4 신호를 보여줍니다. 사용자는 Matrix Arrow Indicator MT4 로 구성된 10개의 표준 표시기를 활성화/비활성화할 수 있습니다. Matrix Arrow Indicator MT4 에서와 같이 10개의 모든 표준 지표 속성도 조정 가능합니다. 매트릭스 화살표 표시기 다중 시간 프레임 패널 MT4는 16개의 수정 가능한 기호 버튼 중 하나를 클릭하여 첨부된 현재 차트를 변경할 수 있는 옵션도 제공합니다. 이렇게 하면 다른 기호 간에 훨씬 빠르게 작업할 수 있고 다시는 거래 기회를 놓치지 않을 수 있습니다. 이 무료 Matrix Arrow Indicator Multi Timef
FREE
AP VWAP Bands Pro (MT4) Volume-weighted average price with ±σ bands for clear intraday bias, mean-reversion zones, and dynamic support/resistance. Works on crypto (incl. BTC), FX, indices, and metals. Uses tick-volume when real volume isn’t available. What it shows VWAP line (volume-weighted mean price). Two envelopes around VWAP (default ±1σ and ±2σ) to highlight balance vs. extension. Reset modes: Day, Week, or Anchor Time (HH:MM) to start VWAP where you need it (e.g., exchange open). Why
FREE
The indicator analyzes the change in the minimum and maximum prices of the previous bars fixing the entrance of the big players. If the change (delta) increases, a signal is displayed on the graph in the form of an arrow. At the same time, virtual trade on history is carried out. In the free version, virtual trade is performed without refills in case of a repeat of the signal. The results of virtual trading in the form of losses / losses, profitability, drawdown and transaction lines are display
FREE
Constructor
Aleksey Semenov
Constructor is a convenient tool for creating, (building strategies) testing and applying trading strategies and ideas, as well as testing and using separate indicators and their groups. Constructor includes opening, closing, deal tracking, averaging and recovery modules, as well as various trading options with and without averaging and martingale. You are able to connect up to 10 different external indicators. Find the detailed instructions in the attached pdf file. Trading settings averaging
FREE
Line Heiken Ashi
Andrei Gerasimenko
3.4 (5)
This is an unconventional version of the Heiken Ashi Smoothed indicator implemented as lines rather than a histogram. Unlike a usual histogram, the indicator draws the readings of the two moving averages in the form of colored lines. Example If the candle crosses two indicator lines upwards, a trend is assumed to be changing from bearish to bullish. If the candle crosses two indicator lines downwards, a trend is assumed to be changing from bullish to bearish. The indicator is good at displaying
FREE
Smart Trade Monitor — Real-Time Position Tracking, P&L Analysis & Alert System   Real-Time Monitoring : Auto-tracks open/closed positions, displays yesterday’s & previous day’s P&L—no manual calculations!   Smart Alerts (Premium Only) : Instant push notifications + sound alerts for position changes—never miss a trading opportunity!   User-Friendly : One-click setup, key data displayed directly on charts for faster decisions.   Cross-Platform : Supports both MT4 & MT5, compatible with
FREE
IceFX SpreadMonitor
Norbert Mereg
4.91 (11)
IceFX SpreadMonitor is a special spread logging indicator which displays the current, minimum/maximum and average spread values. These values are set to be visible even after a reboot. Also, SpreadMonitor could save all the desired spread values to .csv files for later analysis of the results. Indicator parameters: SpreadLowLevel - low level of spread (show value in green color) SpreadHighLevel - high level of spread (show value in red color) BGColor - background of panel SpreadNormalColor - co
FREE
이 제품의 구매자들이 또한 구매함
Gann Made Easy
Oleg Rodin
4.83 (160)
Gann Made Easy 는 mr.의 이론을 사용하여 최고의 거래 원칙을 기반으로 하는 전문적이고 사용하기 쉬운 Forex 거래 시스템입니다. W.D. 간. 이 표시기는 Stop Loss 및 Take Profit Levels를 포함하여 정확한 BUY 및 SELL 신호를 제공합니다. PUSH 알림을 사용하여 이동 중에도 거래할 수 있습니다. 구매 후 거래 방법 안내 및 유용한 추가 지표를 무료로 받으시려면 저에게 연락주세요! 아마도 Gann 거래 방법에 대해 이미 여러 번 들었을 것입니다. 일반적으로 Gann의 이론은 초보자 거래자뿐만 아니라 이미 거래 경험이 있는 사람들에게도 매우 복잡한 것입니다. Gann의 거래 방식은 이론적으로 적용하기 쉽지 않기 때문입니다. 나는 그 지식을 연마하고 Forex 지표에 최고의 원칙을 적용하기 위해 몇 년을 보냈습니다. 표시기는 적용하기가 매우 쉽습니다. 차트에 첨부하고 간단한 거래 권장 사항을 따르기만 하면 됩니다. 지표는 지속적으로 시장 분석
Market Makers
Mohamed Hassan
5 (3)
After purchase, contact me privately to receive 1 month of free testing with EA Forex Proton! This advanced MT4 trading robot automatically executes signals from any MT4 indicator, including Market Makers. The latest version also includes AI integration, allowing each trade signal to be analyzed using Artificial Intelligence. Live Signal with EA Forex Proton: Click here Market Makers is a powerful price action trading system designed to identify high-probability Buy and Sell opportunities based
M1 Sniper
Oleg Rodin
5 (21)
M1 SNIPER 는 사용하기 쉬운 거래 지표 시스템입니다. M1 시간대에 맞춰 설계된 화살표 지표입니다. 이 지표는 M1 시간대 스캘핑을 위한 단독 시스템으로 사용할 수 있으며, 기존 거래 시스템의 일부로도 사용할 수 있습니다. 이 거래 시스템은 M1 시간대 거래용으로 특별히 설계되었지만, 다른 시간대에도 사용할 수 있습니다. 원래는 XAUUSD와 BTCUSD 거래를 위해 이 방법을 설계했지만, 다른 시장 거래에도 유용하다는 것을 알게 되었습니다. 이 지표의 신호는 추세 방향과 반대로 거래될 수 있습니다. 저는 지표의 신호를 활용하여 양방향으로 거래할 수 있도록 돕는 특별한 거래 기법을 알려드립니다. 이 방법은 특별한 동적 지지선과 저항선 가격 영역을 활용하는 것을 기반으로 합니다. 구매하시면 M1 SNIPER 화살표 지표를 바로 다운로드하실 수 있습니다. 또한, 아래 스크린샷에 표시된 Apollo Dynamic SR 지표는 M1 SNIPER 도구를 사용하는 모든 사용자에게 무료로
Scalper Inside PRO
Alexey Minkov
4.74 (69)
12% OFF EASTER SALE An exclusive indicator that utilizes an innovative algorithm to swiftly and accurately determine the market trend. The indicator automatically calculates opening, closing, and profit levels, providing detailed trading statistics. With these features, you can choose the most appropriate trading instrument for the current market conditions. Additionally, you can easily integrate your own arrow indicators into Scalper Inside Pro to quickly evaluate their statistics and profitabi
Atomic Analyst
Issam Kassas
5 (4)
우선적으로 언급할 점은이 거래 지표가 다시 그리지 않고 지연되지 않으며 이를 통해 수동 및 로봇 거래 모두에 이상적이라는 점입니다. 사용자 매뉴얼: 설정, 입력 및 전략. Atomic Analyst는 가격의 강도와 모멘텀을 활용하여 시장에서 더 나은 이점을 찾는 PA Price Action Indicator입니다. 고급 필터를 장착하여 잡음과 거짓 신호를 제거하고 거래 잠재력을 높이는 데 도움이 됩니다. 복잡한 지표의 다중 레이어를 사용하여 Atomic Analyst는 차트를 스캔하고 복잡한 수학적 계산을 간단한 신호와 색상으로 변환하여 초보 트레이더가 이해하고 일관된 거래 결정을 내릴 수 있도록합니다. "Atomic Analyst"는 새로운 및 경험이 풍부한 트레이더를위한 종합적인 거래 솔루션입니다. 프리미엄 지표와 최고 수준의 기능을 하나의 거래 전략에 결합하여 모든 종류의 트레이더에 대한 다재다능한 선택지가되었습니다. 인트라데이 거래 및 스캘핑 전략 : 빠르고 정확한 일일
Trend indicator AI
Ramil Minniakhmetov
4.53 (83)
트렌드 인공 지능 지표는 실행 가능한 진입 점 및 반전 경고와 추세 식별을 결합하여 상인의 시장 분석을 향상시킬 훌륭한 도구입니다. 이 표시기는 사용자가 자신감과 정밀도로 외환 시장의 복잡성을 탐색 할 수 있도록 지원합니다 기본 신호 외에도 트렌드 인공 지능 지표는 풀백 또는 되돌림 중에 발생하는 2 차 진입 점을 식별하여 거래자가 기존 트렌드 내에서 가격 수정을 활용할 수 있도록합니다. 중요한 장점: ·작동 4 및 5 *명확한 구매 또는 판매 신호 *다시 칠하지 않습니다 *모든 자산에서 작동 나는 전보 사기에 개 또는 세트를 판매하지 않도록주의. 모든 설정은 블로그에 여기에 무료.  중요! 지침 및 보너스를 얻기 위해 구입 후 즉시 저에게 연락! 진짜 가동 감시는 뿐 아니라 나의 다른 제품 여기에서 찾아낼 수 있습니다: https://www.mql5.com/en/users/mechanic/seller&nbsp ; 설정 및 입력: 모든 자산에 대해 기본 설정을 권
Trend Screener
STE S.S.COMPANY
4.79 (95)
트렌드 표시기, 트렌드 트레이딩 및 필터링을 위한 획기적인 고유 솔루션, 하나의 도구 안에 내장된 모든 중요한 트렌드 기능! Forex, 상품, 암호 화폐, 지수 및 주식과 같은 모든 기호/도구에 사용할 수 있는 100% 다시 칠하지 않는 다중 시간 프레임 및 다중 통화 표시기입니다. 기간 한정 특가: 지원 및 저항 스크리너 지표는 단 100달러에 평생 제공됩니다. (원래 가격 50 달러) (제안 연장) Trend Screener는 차트에 점이 있는 화살표 추세 신호를 제공하는 효율적인 지표 추세 추종 지표입니다. 추세 분석기 표시기에서 사용할 수 있는 기능: 1. 트렌드 스캐너. 2. 최대 이익 분석이 있는 추세선. 3. 추세 통화 강도 측정기. 4. 경고가 있는 추세 반전 점. 5. 경고가 있는 강력한 추세 점. 6. 추세 화살표 Trend Screener Indicator가 있는 일일 분석 예, 일일 신호 성능...등은 여기에서 찾을 수 있습니다.   여기를 클릭하십시오. L
Advanced Supply Demand
Bernhard Schweigert
4.91 (299)
현재 40% 할인! 초보자나 전문 트레이더를 위한 최고의 솔루션! 이 보조지표는 우리가 다수의 독창적 기능과 새로운 공식을 통합한 독특하고 고품질이며 저렴한 거래 도구입니다. 이 업데이트를 통해 이중 시간대를 표시할 수 있습니다. 더 높은 TF를 표시할 수 있을 뿐만 아니라 차트 TF와 더 높은 TF 모두를 표시할 수 있습니다: 중첩 영역 표시. 모든 Supply Demand 트레이더들이 좋아할 것입니다. :) 중요한 정보 공개 Advanced Supply Demand의 잠재력을 극대화하려면 다음을 방문하십시오. https://www.mql5.com/ko/blogs/post/720245   진입 또는 목표의 명확한 트리거 포인트를 정확히 찾아냄으로 해서 거래가 어떻게 개선될지 상상해 보십시오. 새로운 알고리즘을 기반으로 매수자와 매도자 간의 잠재적인 불균형을 훨씬 더 쉽게 분간할 수 있습니다. 왜냐하면 가장 강한 공급영역과 가장 강한 수요 영역과 과거에 어떻게 진행 되었는지를(이전
Volatility Trend System - a trading system that gives signals for entries. The volatility system gives linear and point signals in the direction of the trend, as well as signals to exit it, without redrawing and delays. The trend indicator monitors the direction of the medium-term trend, shows the direction and its change. The signal indicator is based on changes in volatility and shows market entries. The indicator is equipped with several types of alerts. Can be applied to various trading ins
Ultimate Sniper Dashboard
Hispraise Chinedum Abraham
4.82 (22)
299달러로 할인! 추후 가격이 인상될 수 있습니다! 아래 설명을 읽어보세요! Ultimate Sniper Dashboard를 위한 최고의 엔트리 시스템: ULTIMATE DYNAMIC LEVELS. (내 제품을 확인하십시오) Ultimate Sniper Dashboard는 MT4 다중 통화 테스트 제한으로 인해 라이브 시장에서만 작동합니다. Ultimate-Sniper 대시보드를 소개합니다! HA-Sniper와 MA-Sniper를 모두 포함하는 최고의 제품입니다. 그리고 많은 특수 모드. Ultimate Sniper Dashboard는 절대 야수입니다! 초보자 또는 전문가 트레이더를 위한 최고의 솔루션! 다시 움직임을 놓치지 마세요! 단순함과 핍을 좋아하는 트레이더를 위해 특별한 제품을 준비했습니다. 본질적으로 단순한 대시보드는 여러 사용자 지정 알고리즘을 기반으로 28개의 통화 쌍을 살펴보는 모든 작업을 수행합니다. 단 하나의 차트로 전문가처럼 시장을 읽을 수 있습니다. 움직이기
PRO Renko System
Oleg Rodin
5 (30)
PRO Renko System 은 RENKO 차트 거래를 위해 특별히 고안된 매우 정확한 거래 시스템입니다. 이것은 다양한 거래 상품에 적용될 수있는 보편적 인 시스템입니다. 체계는 효과적으로 당신에게 정확한 반전 신호에 접근을 주는 소위 시장 소음을 중화합니다. 이 표시기는 사용하기가 매우 쉽고 신호 생성을 담당하는 매개 변수가 하나만 있습니다. 당신은 쉽게 당신의 선택의 어떤 무역 계기에 공구를 적응시킬 수 있고 renko 막대기의 크기. 나는 항상 당신이 내 소프트웨어로 수익성있게 거래 할 수 있도록 추가 지원을 제공 할 준비가되어 있습니다! 나는 당신에게 행복하고 수익성있는 거래를 기원합니다! 구매 후 저에게 연락하십시오! 내 렌코 차트 생성기를 보내드립니다. 또한 내 개인 권장 사항 및 시스템의 다른 모듈을 무료로 공유 할 것입니다!
Dynamic Scalper System
Vitalyi Belyh
5 (1)
" Dynamic Scalper System " 지표는 추세 파동 내에서 스캘핑 방식으로 거래하도록 설계되었습니다. 주요 통화쌍 및 금에서 테스트되었으며, 다른 거래 상품과의 호환성이 가능합니다. 추가적인 가격 변동 지원을 통해 추세에 따라 단기 포지션 진입 신호를 제공합니다. 지표의 원리 큰 화살표는 추세 방향을 결정합니다. 작은 화살표 형태의 스캘핑 신호를 생성하는 알고리즘은 추세 파동 내에서 작동합니다. 빨간색 화살표는 상승 방향을, 파란색 화살표는 하락 방향을 나타냅니다. 민감한 가격 변동선은 추세 방향으로 그려지며, 작은 화살표의 신호와 함께 작용합니다. 신호는 다음과 같이 작동합니다. 적절한 시점에 선이 나타나면 진입 신호가 형성되고, 선이 있는 동안 미결제 포지션을 유지하며, 완료되면 거래를 종료합니다. 권장되는 작업 시간대는 M1~H4입니다. 화살표는 현재 캔들에 형성되며, 다음 캔들이 이미 시작되었더라도 이전 캔들의 화살표는 다시 그려지지 않습니다. 입력 매개
Advanced Currency Strength28 Indicator
Bernhard Schweigert
4.91 (657)
현재 40% 할인 초보자 또는 전문가 트레이더를 위한 최고의 솔루션! 이 지표는 우리가 독점 기능과 새로운 공식을 통합했기 때문에 독특하고 고품질이며 저렴한 거래 도구입니다. 단 하나의 차트로 28 Forex 쌍의 통화 강도를 읽을 수 있습니다! 새로운 추세 또는 스캘핑 기회의 정확한 트리거 포인트를 정확히 찾아낼 수 있기 때문에 거래가 어떻게 개선될지 상상해 보십시오. 사용 설명서: 여기를 클릭  https://www.mql5.com/en/blogs/post/697384 그것이 첫 번째, 원본입니다! 쓸모없는 지망생 클론을 사지 마십시오. 더 스페셜  강력한 통화 모멘텀을 보여주는 하위 창의 화살표 GAP가 거래를 안내합니다! 기본 또는 호가 통화가 과매도/과매도 영역(외부 시장 피보나치 수준)에 있을 때 개별 차트의 기본 창에 경고 표시가 나타납니다. 통화 강도가 외부 범위에서 떨어질 때 풀백/반전 경고. 교차 패턴의 특별 경고 추세를 빠르게 볼 수 있는 다중 시간
Scalper Vault
Oleg Rodin
5 (36)
Scalper Vault 는 성공적인 스캘핑에 필요한 모든 것을 제공하는 전문 스캘핑 시스템입니다. 이 표시기는 외환 및 바이너리 옵션 거래자가 사용할 수 있는 완전한 거래 시스템입니다. 권장 시간 프레임은 M5입니다. 시스템은 추세 방향으로 정확한 화살표 신호를 제공합니다. 또한 상단 및 하단 신호와 Gann 시장 수준을 제공합니다.  이 시스템은 사용하기가 매우 쉽습니다. 원하는 시장 지역의 화살표만 따라가면 됩니다. 엑시트는 가격이 적정 수준에 도달하거나 시장의 고점 또는 저점 신호가 나타날 때 수행됩니다.  표시기는 PUSH 알림을 포함한 모든 유형의 경고를 제공합니다. 인디케이터 구매 후 연락주세요. 내 개인 거래 권장 사항과 훌륭한 보너스 지표를 무료로 공유합니다! 나는 당신에게 행복하고 유익한 거래를 기원합니다!
Trend Lines PRO
Roman Podpora
5 (1)
트렌드 라인즈 프로       이 지표는 시장이 실제로 어떤 방향으로 전환되는지 파악하는 데 도움이 됩니다. 실제 추세 반전 지점과 주요 시장 참여자들이 다시 진입하는 지점을 보여줍니다. 보시다시피       BOS 라인       복잡한 설정이나 불필요한 노이즈 없이 더 높은 시간대의 추세 변화와 주요 레벨을 확인할 수 있습니다. 신호는 차트에 다시 그려지지 않고 캔들이 마감된 후에도 계속 표시됩니다. VERSION MT 5   -   RFI LEVELS PRO   표시기   와 결합할 때 최대 잠재력을 발휘합니다. 지표가 보여주는 내용: 실제 변화       추세(BOS 라인) 한 번 신호가 나타나면 그 신호는 계속 유효합니다! 이는 신호를 발생시킨 후 변경될 수 있는 리페인팅 방식의 지표와 중요한 차이점입니다. 리페인팅 방식의 지표는 잠재적으로 자금 손실로 이어질 수 있습니다. 이제 더욱 높은 확률과 정확도로 시장에 진입할 수 있습니다. 또한 화살표가 나타난 후 목표가(익절)
GOLD Impulse with Alert
Bernhard Schweigert
4.67 (12)
이 지표는 Advanced Currency IMPULSE with ALERT  +   Currency Strength Exotics  의 2가지 제품의 슈퍼 조합입니다. 그것은 모든 시간 프레임에 대해 작동하며 8개의 주요 통화와 하나의 기호에 대한 강약의 충동을 그래픽으로 보여줍니다! 이 표시기는 금, 이국적인 쌍, 상품, 지수 또는 선물과 같은 기호에 대한 통화 강도 가속을 표시하는 데 특화되어 있습니다. 금, 은, 오일, DAX, US30, MXN, TRY, CNH 등의 진정한 통화 강도 가속(충동 또는 속도)을 표시하기 위해 9번째 줄에 모든 기호를 추가할 수 있습니다. 새로운 기본 알고리즘을 기반으로 구축되어 잠재적인 거래를 훨씬 더 쉽게 식별하고 확인할 수 있습니다. 이는 통화의 강세 또는 약세가 가속되는지 여부를 그래픽으로 표시하고 가속 속도를 측정하기 때문입니다. 자동차의 속도계처럼 생각하면 됩니다. 가속화할 때 Forex 시장에서 동일한 일이 분명히 더 빠르
특별 제공 : 모든 도구 , 각 $35 ! 새 도구   는   첫 주   또는   최초 3회 구매 에 한해   $30 !  MQL5의 Trading Tools 채널 : 최신 소식을 받으려면 제 MQL5 채널에 가입하세요 Stochastic Z-Score 는 가격을 Z-Score 로 정규화하고, 확률적 로직으로 범위를 제한하며, HMA 로 평활화하는 모멘텀 오실레이터입니다. 장기 컨텍스트를 위해 ALMA 를 사용합니다. 선택 요소로 히스토그램, 동적 밴드, 반전 라벨이 있습니다. MT5 버전 보기:  Stochastic Z Score MT5 Scanner MT4 버전 보기:  Stochastic Z Score MT4 Scanner 더 많은 제품:   All P roducts Overview Stochastic Z-Score 는 변동성에 대해 정규화된 Z-Score 와 확률적 로직을 결합하고, Hull Moving Average(HMA) 로 평활화합니다. 가격 편차를 정규화된 신호로
- Real price is 80$ - 40% Discount (It is 49$ now) Contact me for instruction, add group and any questions! - Non-repaint - I just sell my products in Elif Kaya profile, any other websites are stolen old versions, So no any new updates or support. - Lifetime update free Related product:   Bitcoin Expert Introduction The breakout and retest strategy is traded support and resistance levels. it involves price breaking through a previous level.  The break and retest strategy is designed to help tr
현재 40% 할인 ! 초보자 또는 전문가 트레이더를 위한 최고의 솔루션! 이 대시보드 소프트웨어는 28개의 통화 쌍에서 작동합니다. 2가지 주요 지표(Advanced Currency Strength 28 및 Advanced Currency Impulse)를 기반으로 합니다. 전체 Forex 시장에 대한 훌륭한 개요를 제공합니다. 고급 통화 강도 값, 통화 이동 속도 및 모든(9) 시간대의 28 Forex 쌍에 대한 신호를 보여줍니다. 추세 및/또는 스캘핑 기회를 정확히 파악하기 위해 차트의 단일 지표를 사용하여 전체 시장을 볼 수 있을 때 거래가 어떻게 개선될지 상상해 보십시오! 잠재적인 거래를 식별하고 확인하면서 강력한 통화와 약한 통화를 더욱 쉽게 식별할 수 있도록 이 지표에 기능을 내장했습니다. 이 표시기는 통화의 강세 또는 약세가 증가 또는 감소하는지 여부와 모든 시간대에서 수행되는 방식을 그래픽으로 보여줍니다. 추가된 새로운 기능은 현재 시장 조건 변화에 적응하는
BlueDigitsFx Easy 1 2 3 System
Ziggy Janssen
4.87 (299)
MT5 버전은 여기에서 이용 가능합니다: https://www.mql5.com/en/market/product/50048 텔레그램 채널 & 그룹: https://t.me/bluedigitsfx V.I.P 그룹 접속: 유료 제품 구매 증빙을 메시지로 보내주세요 추천 브로커: https://bit.ly/BlueDigitsFxStarTrader BlueDigitsFx Easy 123 System — MT4용 강력한 반전 및 돌파 감지 시스템 초보자와 전문가 모두를 위한, 시장 구조 변화, 돌파 및 추세 반전을 쉽고 명확하게 감지할 수 있는 올인원 논리 재도색 방지(Non-Repaint) 인디케이터입니다. 이 인디케이터는 "123" 패턴을 따릅니다: 1단계: 잠재적 과매수/과매도 지점에서 큰 화살표로 새로운 고점 또는 저점을 식별 2단계: 구조가 깨졌음을 신호로 보내 추세 반전 가능성을 확인 3단계: 작은 화살표와 지지/저항 점으로 진입 신호를 확정 참고: 큰 화살표는 봉이 종료될
Support Resistance screnner
STE S.S.COMPANY
4.95 (37)
Support And Resistance Screener는 하나의 지표 안에 여러 도구를 제공하는 MetaTrader에 대한 하나의 레벨 지표입니다. 사용 가능한 도구는 다음과 같습니다. 1. 시장 구조 스크리너. 2. 완고한 후퇴 영역. 3. 약세 후퇴 영역. 4. 일일 피벗 포인트 5. 주간 피벗 포인트 6. 월간 피벗 포인트 7. 고조파 패턴과 볼륨에 기반한 강력한 지지와 저항. 8. 은행 수준 구역. LIMITED TIME OFFER : HV 지원 및 저항 표시기는 50 $ 및 평생 동안만 사용할 수 있습니다. ( 원래 가격 125$ ) 메타트레이더 백테스터 제한 없이 인디케이터를 사용하시겠습니까? 데모 버전을 다운로드하려면 여기를 클릭하십시오. 주요 특징들 고조파 및 볼륨 알고리즘을 기반으로 하는 강력한 지원 및 저항 영역. Harmonic 및 Volume 알고리즘을 기반으로 한 강세 및 약세 풀백 영역. 시장 구조 스크리너 일간, 주간 및 월간 피벗 포인트. 문서 모
이 지표를 구매하면 제 프로페셔널 트레이드 매니저를 무료로 드립니다. 우선 이 거래 시스템이 리페인팅, 리드로잉 및 레이그 인디케이터가 아니라는 점을 강조하는 것이 중요합니다. 이는 수동 및 로봇 거래 모두에 이상적인 것으로 만듭니다. 온라인 강좌, 설명서 및 프리셋 다운로드. "스마트 트렌드 트레이딩 시스템 MT5"은 새로운 및 경험이 풍부한 트레이더를 위해 맞춤형으로 제작된 종합적인 거래 솔루션입니다. 10개 이상의 프리미엄 인디케이터를 결합하고 7개 이상의 견고한 거래 전략을 특징으로 하여 다양한 시장 조건에 대한 다목적 선택이 가능합니다. 트렌드 추종 전략: 효과적인 트렌드 추이를 타기 위한 정확한 진입 및 손절 관리를 제공합니다. 반전 전략: 잠재적인 트렌드 반전을 식별하여 트레이더가 범위 시장을 활용할 수 있게 합니다. 스캘핑 전략: 빠르고 정확한 데이 트레이딩 및 단기 거래를 위해 설계되었습니다. 안정성: 모든 인디케이터가 리페인팅, 리드로잉 및 레이그가 아니므로 신뢰
Stratos Pali
Michela Russo
4.43 (7)
Stratos Pali Indicator   is a revolutionary tool designed to enhance your trading strategy by accurately identifying market trends. This sophisticated indicator uses a unique algorithm to generate a complete histogram, which records when the trend is Long or Short. When a trend reversal occurs, an arrow appears, indicating the new direction of the trend. Important Information Revealed Leave a review and contact me via mql5 message to receive My Top 5 set files for Stratos Pali at no cost! Dow
Dynamic Forex28 Navigator
Bernhard Schweigert
4.43 (7)
Dynamic Forex28 Navigator - 차세대 외환 거래 도구. 현재 49% 할인. Dynamic Forex28 Navigator는 오랫동안 인기 있는 지표의 진화형으로, 세 가지의 힘을 하나로 결합했습니다. 고급 통화 Strength28 지표(695개 리뷰) + 고급 통화 IMPULSE with ALERT(520개 리뷰) + CS28 콤보 신호(보너스). 지표에 대한 자세한 정보 https://www.mql5.com/en/blogs/post/758844 차세대 Strength 지표는 무엇을 제공합니까?  원래 지표에서 좋아했던 모든 것이 새로운 기능과 더 높은 정확도로 강화되었습니다. 주요 기능: 독점적인 통화 Strength 공식.  모든 시간대에 걸쳐 부드럽고 정확한 강도선. 추세와 정확한 진입을 식별하는 데 이상적입니다. 역동적인 시장 피보나치 수준(시장 피보나치).  이 지표에만 있는 고유한 기능. 가격 차트가 아닌 통화 강도에 피보나치가 적용됩니다.
QM Pattern Scanner MT4
Reza Aghajanpour
4.86 (7)
Discount: It will be $39 for a week or for 2 purchases!  Contact me  to send you instruction and add you in group. QM (Quasimodo) Pattern is based on Read The Market(RTM) concepts. The purpose of this model is to face the big players of the market (financial institutions and banks), As you know in financial markets, big traders try to fool small traders, but RTM prevent traders from getting trapped. This style is formed in terms of price candles and presented according to market supply and dem
Miraculous Indicator – Gann Square of Nine 기반 100% 비리페인트 Forex 및 바이너리 도구 이 영상은 Miraculous Indicator 를 소개합니다. 이 지표는 Forex 및 바이너리 옵션 트레이더를 위해 특별히 개발된 매우 정확하고 강력한 트레이딩 도구입니다. 이 지표가 독특한 이유는 전설적인 **Gann Square of Nine(Gann 9의 사각형)**과 **Gann's Law of Vibration(Gann 진동의 법칙)**에 기반을 두고 있기 때문입니다. 이는 현대 트레이딩에서 가장 정밀한 예측 도구 중 하나로 손꼽힙니다. Miraculous Indicator는 완전히 비리페인트(non-repaint) 됩니다. 즉, 캔들이 마감된 후에도 신호가 변경되거나 사라지지 않습니다. 보이는 것이 곧 결과입니다. 이는 트레이더가 자신감을 가지고 거래에 진입하고 청산할 수 있는 신뢰할 수 있고 일관된 기반을 제공합니다. 주요 특징: Gann
Currency Strength Exotics
Bernhard Schweigert
4.88 (33)
현재 20% 할인! 초보자 또는 전문가 트레이더를 위한 최고의 솔루션! 이 표시기는 Exotic Pairs Commodities, Indexes 또는 Futures와 같은 기호에 대한 통화 강도를 표시하는 데 특화되어 있습니다. 금, 은, 석유, DAX, US30, MXN, TRY, CNH 등의 진정한 통화 강도를 보여주기 위해 9번째 줄에 모든 기호를 추가할 수 있습니다. 이것은 독특하고 고품질이며 저렴한 거래 도구입니다. 우리는 많은 독점 기능과 새로운 공식을 통합했습니다. 새로운 추세 또는 스캘핑 기회의 정확한 트리거 포인트를 정확히 찾아낼 수 있기 때문에 거래가 어떻게 개선될지 상상해 보십시오. 사용 설명서: 여기를 클릭 https://www.mql5.com/en/blogs/post/708876 모든 시간대에 작동합니다. TREND를 빠르게 확인할 수 있습니다! 새로운 기본 알고리즘을 기반으로 설계되어 잠재적인 거래를 더욱 쉽게 식별하고 확인할 수 있습니다. 8개의
FX Volume
Daniel Stein
4.63 (38)
FX Volume: 브로커 시각에서 바라보는 진짜 시장 심리 간단 요약 트레이딩 접근 방식을 한층 더 향상시키고 싶으신가요? FX Volume 는 소매 트레이더와 브로커의 포지션을 실시간으로 파악할 수 있게 해 줍니다. 이는 COT 같은 지연된 보고서보다 훨씬 빠릅니다. 꾸준한 수익을 추구하는 분이든, 시장에서 더 깊은 우위를 원하시는 분이든, FX Volume 을 통해 대규모 불균형을 찾아내고, 돌파 여부를 확인하며 리스크 관리를 정교화할 수 있습니다. 지금 시작해 보세요! 실제 거래량 데이터가 의사결정을 어떻게 혁신할 수 있는지 직접 경험해 보시기 바랍니다. 1. 트레이더에게 FX Volume이 매우 유익한 이유 탁월한 정확도를 지닌 조기 경보 신호 • 다른 사람들보다 훨씬 앞서, 각 통화쌍을 매수·매도하는 트레이더 수를 거의 실시간으로 파악할 수 있습니다. • FX Volume 은 여러 리테일 브로커에서 추출한 실제 거래량 데이터를 종합해 명확하고 편리한 형태로 제공하는
GEM Signal MT4
Shengzu Zhong
GEM Signal Pro GEM Signal Pro는 MetaTrader 4용 추세추종형 지표로, 차트에서 더 명확한 신호, 더 구조적인 트레이드 설정, 그리고 더 실용적인 리스크 관리를 원하는 트레이더를 위해 설계되었습니다. 단순한 화살표만 표시하는 것이 아니라, GEM Signal Pro는 전체 트레이드 아이디어를 더 깔끔하고 읽기 쉬운 방식으로 보여줍니다. 조건이 확인되면 진입가, 손절가, 목표가를 차트에 표시하여 트레이더가 설정을 더 효율적으로 검토할 수 있도록 도와줍니다. 작동 방식 이 지표는 먼저 내부 로직에 따라 유효한 초기 신호를 식별합니다. 확인 조건이 충족되면, GEM Signal Pro는 차트에 전체 설정을 표시합니다. 이를 통해 트레이더는 거래 구조를 더 명확하게 보고, 수동 분석 작업을 줄일 수 있습니다. 차트에 표시되는 거래 레벨 확인된 신호에 대해, GEM Signal Pro는 다음을 표시할 수 있습니다. 진입가 손절가 목표가 1 목표가 2 목표가 3 손
Auto Optimized Parabolic RSI: 고급 3D 모멘텀 엔진 대부분의 개인 투자자용 보조지표는 시장의 변동성이 변하는 순간 무용지물이 되는 정적인 입력값에 의존하기 때문에 실패합니다. Auto Optimized Parabolic RSI는 자체적인 수학적 우위를 지속적으로 재계산하여 "보조지표 노후화" 문제를 해결하며, 기관급 퀀트 트레이딩의 적응력을 귀하의 MT5 터미널에 직접 제공합니다. 핵심 이점: 맞춤형 인메모리 3D 최적화   표준 자동 최적화 도구들은 일반적인 보조지표 호출로 터미널에 과부하를 일으켜 MT5 플랫폼을 멈추게 하는 경우가 많습니다. 이 도구는 이러한 병목 현상을 완전히 우회합니다. 맞춤형 네이티브 RAM 기반 계산기로 구축된 내부 엔진은 차트를 로드하거나 타임프레임을 변경할 때마다 빛처럼 빠른 3D 그리드 검색을 실행합니다. RSI 기간(주기), SAR 스텝(가속도) 및 SAR 최대치(속도 제한)를 동시에 스캔하여 플랫폼 지연 없이 수만 개의
제작자의 제품 더 보기
IceFX TradeInfo
Norbert Mereg
4.77 (44)
IceFX’s TradeInfo is an utility indicator which displays the most important information of the current account and position. Displayed information: Information about the current account (Balance, Equity, Free Margin). Current spread, current drawdown (DD), planned profit, expected losses, etc. Number of open position(s), volume (LOT), profit. Today’s and yesterday’s range. Remaining time to the next candle. Last day profit information (with integrated IceFX ProfitInfo indicator). Risk-based LOT
FREE
IceFX DrawProfit
Norbert Mereg
4.92 (24)
IceFX DrawProfit indicator can efficiently help those traders who want to see on the chart all closed positions output: profit or loss. If you set DrawProfit on your chart managed by an Expert Advisor (EA), you will clearly see its performance by its profits & losses. Main Features: Draws closed order lines Draws profit/loss of closed orders in currency Sums orders by candles MagicNumber filter for EAs Comment filter Input parameters: ShowProfitLabels : show profit of orders with a label Profi
FREE
IceFX AccountInfo
Norbert Mereg
4.71 (17)
This very new indicator is able to unlock all advanced features of MetaTrader 4 (above build 600). This indicator can graphically represent the main data of the current account (balance, equity, free margin, current Profit/Loss, total Profit/Loss, amount of open position(s) & size, etc.) in an elegant way. On the chart AccountInfo graphically shows the account balance of recent days. Also all data can be filtered with MagicNumber, Order Comment, and symbol for the professional evaluation of a sp
FREE
IceFX SpreadMonitor
Norbert Mereg
4.91 (11)
IceFX SpreadMonitor is a special spread logging indicator which displays the current, minimum/maximum and average spread values. These values are set to be visible even after a reboot. Also, SpreadMonitor could save all the desired spread values to .csv files for later analysis of the results. Indicator parameters: SpreadLowLevel - low level of spread (show value in green color) SpreadHighLevel - high level of spread (show value in red color) BGColor - background of panel SpreadNormalColor - co
FREE
IceFX HeatMap
Norbert Mereg
3.25 (4)
IceFX Heatmap is a special indicator that shows the places where the price has been staying and ranging over the past few days. These sites will be displayed in a "Heatmap style", with which you can clearly see the main formed bands. The main rates (where the price has "lingered/stayed" much) are indicated in bright colors (in case of black-and-white view) or red color (in case of color view). Settings Days - the number of days the heat(map) is calculated for. Resolution - resolution rate. 10 =
FREE
IceFX ProfitInfo
Norbert Mereg
4.6 (10)
The goal of this indicator is to give you a quick & comprehensive view of your current profit. IceFX’s ProfitInfo is a utility indicator which displays the profit which is calculated from the actual trades on the chart(s). The indicator displays on a daily / weekly / monthly and yearly breakdown and shows the profit in pips / currency and percentage. Main features: You can easily adjust IceFX’s ProfitInfo to display profit on the current open chart / current trade or even the profit of the enti
FREE
IceFX TickInfo
Norbert Mereg
4 (1)
This is a unique tick chart indicator for MetaTrader 4 platform. The software is capable to graphically display the last 100 ticks and in addition to that it displays the current spread, bid / ask and time values ​​in an elegant IceFX style dashboard. The indicator is an efficient tool for traders using M5 or even M1 timeframe. Indicator parameters: Corner - corner of panel CornerXOffset - horizontal offset from the corner CornerYOffset - vertical offset from the corner ChartType - type of char
FREE
IceFX VelocityMeter Mini is a very unique indicator on MetaTrader 4 platform which measures the speed of the Forex market . It is not a normal volume or other measurement indicator because IceFX VelocityMeter Mini is capable to understand market speed movements which are hidden in ticks and those valuable information cannot be read in an ordinary way from the candles. The software monitors the received ticks (frequency, magnitude of change) within a specified time range, analyzes these info and
필터:
Claudio Alves
88
Claudio Alves 2021.08.10 12:31 
 

Maravilhos!!! Ajuda e muito nos acertos.

Ramin Rostami
577
Ramin Rostami 2019.11.11 16:24 
 

frist thanks for this and give it free

please add Alert (sound) for max speed ,if goes above it gives alert ,,,,then send me too please

marlowyip
86
marlowyip 2017.12.19 15:34 
 

사용자가 평가에 대한 코멘트를 남기지 않았습니다

Alexey Levashov
507
Alexey Levashov 2016.12.08 10:45 
 

5 звезд !!!

Maksym Mudrakov
30050
Maksym Mudrakov 2016.08.31 07:03 
 

사용자가 평가에 대한 코멘트를 남기지 않았습니다

Vadim Strelkov
7710
Vadim Strelkov 2014.05.06 14:18 
 

사용자가 평가에 대한 코멘트를 남기지 않았습니다

리뷰 답변