Corridor BARs MT5
- 지표
- 버전: 1.0
- 활성화: 5

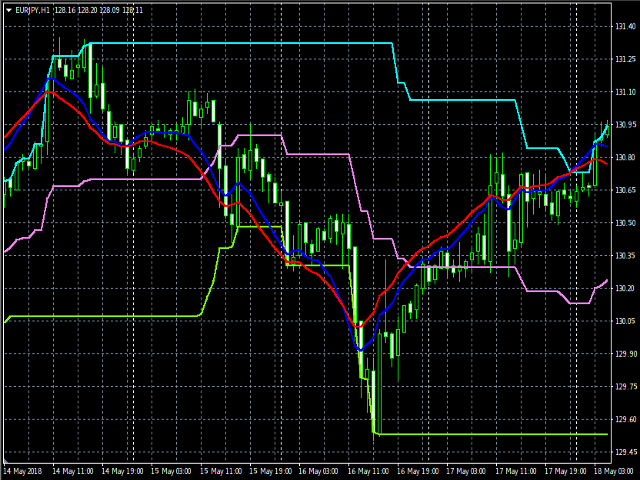
The indicator shows the upper, middle and lower price limits for a certain period of time.
Also, two Moving Averages (MAs) are displayed.
Parameters
- CTType: corridor basis. _Hour: hours, _Day: days, _Bars: bars
- CTPrice: price type, by bars. OpenClose: Open/Close prices, HighLow: High/Low prices
- CTShift: corridor shift
- CTNum: how much to consider for building a corridor, min 2
- CTPeriodFast: Fast period, min 2
- CTShiftFast: Fast MA shift
- CTMethodFast: Fast averaging method
- CTPeriodSlow: Slow period, min 2
- CTShiftSlow: Slow MA shift
- CTMethodSlow: Slow averaging method
Clipboard
- 0: Corridor top
- 1: Corridor bottom
- 2: Corridor average
- 3: Fast MA
- 4: Slow MA
Fully autonomous. No need for extra indicators.
Sample indicator call:
input int            CTType       = 2, // 0 hours, 1 days, 2 bars
                     CTPrice      = 0, // 0 Open/Close, 1 High/Low
                     CTNum        = 50,
                     CTPeriodFast = 9,
                     CTShiftFast  = 0;
input ENUM_MA_METHOD CTMethodFast = MODE_SMA;
input int            CTPeriodSlow = 15,
                     CTShiftSlow  = 0;
input ENUM_MA_METHOD CTMethodSlow = MODE_SMA;

int    handle;
struct SBuffers
{
     double array[];
} Buffers[5];

void OnInit()
{
     handle = iCustom(_Symbol, 0, "CorridorTrade", CTType, CTPrice, 0, CTNum, CTPeriodFast, 0, CTMethodFast, CTPeriodSlow, 0, CTMethodSlow);
     if(handle==INVALID_HANDLE) ExpertRemove();

     for(int i=0; i<5; i++)
          ArraySetAsSeries(Buffers[i].array, true);
}
void OnTick()
{
     for(int i=0; i<5; i++)
     {
          ArrayFree(Buffers[i].array);
          if( CopyBuffer(handle, i, 0, 1, Buffers[i].array) != 1 )
               return;
     }

     Comment(  "Top: ",    DoubleToString(Buffers[0].array[0], _Digits),
               "\n",
               "Bottom: ", DoubleToString(Buffers[1].array[0], _Digits),
               "\n",
               "Medium: ", DoubleToString(Buffers[2].array[0], _Digits),
               "\n",
               "Fast: ",   DoubleToString(Buffers[3].array[0], _Digits),
               "\n",
               "Slow: ",   DoubleToString(Buffers[4].array[0], _Digits)
            );
}