Tun SnR Sweep

Tun SnR Sweep — Look To The Right Method

Tun SnR Sweep is an MT5 market-structure indicator designed for traders who want a cleaner way to identify important Support & Resistance, Liquidity Sweeps, SBR/RBS structure, and multi-timeframe price levels directly on the chart.

Launch price: 35 USD

Early Bird: 90 USD

Normal Price: 250 USD


The concept is simple: instead of filling the chart with unnecessary signals, Tun SnR Sweep helps traders focus on the important structure around current price and look to the right for potential reaction areas.

The indicator combines several price-action concepts into one visual system while keeping the chart clean and easy to read.

Main Features

  • Support & Resistance Detection — automatically highlights relevant support and resistance areas.
  • Current Timeframe SnR — identifies important levels from the active chart timeframe.
  • Higher Timeframe SnR — displays stronger structural levels from a selected higher timeframe.
  • Liquidity Sweep Detection — highlights areas where price takes previous liquidity and reacts.
  • SBR — Support Becomes Resistance — identifies broken support that may act as resistance.
  • RBS — Resistance Becomes Support — identifies broken resistance that may act as support.
  • Decision Levels — highlights additional structural areas where price may react or make a directional decision.
  • Different Colours for Structure Types — Support, Resistance, SBR and RBS are visually separated for easier chart reading.
  • Clean Display Mode — reduces unnecessary historical objects and keeps attention on the most relevant levels.
  • Customisable Inputs — colours, displayed levels and several visual options can be adjusted from MT5.
  • Tun Perak Chart Branding — clean visual presentation suitable for discretionary market analysis.

Look To The Right Method

The purpose of the indicator is not to predict every market movement.

It helps traders identify where price is approaching an important area, then observe what happens next.

For example:

Resistance + Bearish Liquidity Sweep
Price reaches resistance, takes liquidity above a previous high and rejects the area.

Support + Bullish Liquidity Sweep
Price reaches support, sweeps liquidity below a previous low and reacts upward.

RBS / SBR Retest
A previously broken market structure may become a new reaction area when price returns.

The combination of these structures can provide additional context when planning entries, stop-loss placement and trade management.

Suitable For

Tun SnR Sweep can be used on:

XAUUSD / Gold, Forex pairs, Indices and other instruments available in MetaTrader 5.

It can also be used across multiple timeframes. Lower timeframes may provide more frequent structures, while higher timeframes generally provide a broader market context.

Recommended Workflow

First identify the nearest Support, Resistance, SBR or RBS area.

Then observe whether Liquidity Sweep behaviour occurs around the level.

Use Higher Timeframe levels to understand the larger market structure.

Finally, wait for your own entry confirmation before taking a trade.

Important

Tun SnR Sweep is a market analysis indicator, not an Expert Advisor.

It does not automatically open or close trades.

The indicator should be used as an additional market-analysis tool together with proper risk management and the trader's own confirmation method.

Historical behaviour does not guarantee future market performance.


추천 제품
Lumin Chart
John John Gutierrez Vivas
LUMIN Chart reads the market structure for you and draws the zones that matter. It finds support, resistance and Order Blocks, scores each one from 0 to 12 and rates it WEAK, MEDIUM or STRONG, so you can see at a glance which levels deserve your attention. This is an indicator only. It does not open, close or modify trades, and it does not need Algo Trading enabled. Key features Scored zones (0–12). Every zone is rated on: impulse leaving the zone rejection wick respected bounces (exhausted zone
" Blow It Up!" - The Trading Indicator That Questions Your Life Choices Tired of boring indicators? Meet your new market companion that delivers: "YOLO BUY!" arrows when you should probably panic Explosive rectangle confetti (because why not?) 200+ soul-crushing quotes like "Your stop loss is imaginary" and "This is n't trading, it's donating to whales" Random alerts that roast your strategy This Indicator is lik e Therapy - Because daytrading shouldn't fe el like watching paint dry! Highlights
Supply and Demand Indicator + FREE Currency Strength Meter ADD-ON Looking for a powerful tool that can help you identify the most reactive zones in the forex market? Our supply and demand indicator for MetaTrader 4 and 5 is exactly what you need. With its advanced algorithms and real-time analysis, this indicator helps traders of all experience levels make informed trading decisions. The supply and demand indicator is a cutting-edge tool that helps traders identify areas where buyers and sellers
Dragonfly Pro
Chauhan Manharsinh
Dragonfly CDO Pro v2 is a powerful, accurate, and easy-to-use MT5 indicator designed for serious traders who want high-probability entries with built-in risk management. It combines 6 EMA alignment , a unique CDO oscillator , smart pattern recognition , and EMA touch filter to deliver clean BUY and SELL signals with automatic TP/SL levels. Key Features & Advantages: Full 6 EMA Alignment Filter – Only trades when fast to slow EMAs are perfectly aligned Smart CDO Oscillator – Detects momentum dips
WAPV Weis Wave Chart Forex
Eduardo Da Costa Custodio Santos
The Weis Wave Chart Forex for MT5 is a Price and Volume indicator. The Price and Volume reading was widely disseminated through Richard Demille Wyckoff based on the three laws created by him: Supply and Demand, Cause and Effect and Effort vs. Result. In 1900 R.Wyckoff already used the wave chart in his analyses. Many years later, around 1990, David Weis Automated R. Wyckoff's wave chart and today we bring you the evolution of David Weis' wave chart. It shows the amount of Volume and the amount o
QuantEx Pivot Indicator MT5
Savia Forex Software Solutions
QuantEx Pivot Indicator   is a practical MT4 technical analysis tool designed to help traders identify important Fibonacci-based pivot, support, and resistance levels directly on the chart. The indicator monitors price action and plots key levels using a structured calculation framework, giving traders a clearer view of potential reaction zones across different market conditions. QuantEx Pivot Indicator can be used on compatible currency pairs, indices, commodities, stocks, metals, and cryptocur
LIGHTHOUSE — 시장 구조를 한눈에. 리페인트 없음. LIGHTHOUSE는 확정된 스윙 고점과 저점으로 가격 구조를 읽고, 차트에 깔끔하게 표시합니다. 재량 트레이더가 진입 전에 묻는 세 가지 질문에 답합니다. 상위 시간 프레임은 어느 방향인가? 현재 차트는 어느 방향인가? 중요한 가격대는 어디인가? 판단을 돕는 도구로, 거래를 하거나 가격을 예측하지 않습니다. 왜 "LIGHTHOUSE"(등대)인가? 등대는 배에 길을 알려 주고 암초를 경고하지만, 키를 잡는 것은 선장입니다. LIGHTHOUSE도 차트에서 시장의 방향과 가격이 반응하기 쉬운 구간을 보여 줍니다. 결정은 여러분의 몫입니다. 작동 방식 스윙 고점·저점은 봉이 마감된 뒤에만 확정됩니다. 한 번 표시된 라벨은 움직이거나 사라지지 않습니다. 구조 돌파는 꼬리가 아니라 종가로 판단합니다. 방향은 마지막 구조 돌파의 방향과 최근 두 고점·저점의 배열(다우 이론)로 정합니다. 같은 로직을 상위 시간 프레임(기본 H1)에도
Gold M3 Doji Breakout H1 Gold M3 Doji Breakout H1 is an automated MetaTrader 5 Expert Advisor designed to identify a fixed M3 compression structure inside a closed H1 candle and evaluate a breakout during the following H1 trading window. This product is designed for Gold symbols. Its default absolute-price distances are not intended for Forex pairs, cryptocurrencies or stock indices. Position management The EA divides the position into three stages: - Stage 1 closes at the configured first
EQ Cutrim Theory
Marco Aurelio Santos Costa
Ronal Cutrim has been a dedicated mathematician for 14 years and has more than 10 years of experience in the financial market. The concept of the theory is simple, find imbalance between buyers and sellers. Which makes a lot of sense, because nothing goes up forever, nothing falls forever.   When you find an asset with a mathematical probability of unbalanced equilibrium, it is a great way to get into trading:  TUTORIAL: Turn on the subtitles, the video is subtitled
Gold Kinetic Pro
Deynis Alejandro Puro Rodriguez
An Applied Mathematical and Physical Model for XAUUSD – (Prop Firm Ready) Gold Kinetic Pro is a short-term intraday system for XAUUSD that brings six independent strategies together inside a single Expert Advisor. Gold moves in bursts, pauses and sharp turns. Gold Kinetic Pro is designed to recognise one specific kind of moment in that behaviour and to act only when its conditions are fully met, in both directions. When they are not met, it waits. The approach is built on precision rather than v
This indicator is based on the mathematics of the great trader W.D. Ganna. With its help, you can easily find strong levels by analyzing swings to find the optimal entry point. The indicator works on all instruments and all timeframes. The indicator is fully manual and has control buttons. All you need to do is press the NEW button, a segment will appear, which you can place on any movement, swing or even 1 candle that you want to analyze. By placing the segment, press the OK button. A grid (th
Radar Trade Analytic
Jeverson Rodrigues Ferreira
Radar Trade Analytic 2.0 – MT5용 퀀트 패널 Radar Trade Analytic란? Radar Trade Analytic는 Radar Trade 생태계의 퀀트(정량 분석) 모듈입니다. 메인 차트 아래 별도의 창에서 열리며, 동일한 독자적인 Sigma 엔진으로 구축된 네 개의 동기화된 레이어를 표시합니다. 이를 통해 차트에서 보이는 것과 패널에서 읽는 것 사이의 직접적인 대응 관계를 보장합니다. 매수/매도 신호가 없습니다. 목표가도 없습니다. 알림도 없습니다. Radar Trade Analytic는 정말 중요한 데이터만 정리하여 명확하게 판단할 수 있도록 돕습니다. 2.0 버전에서 달라진 점 # 개선 사항 이전 버전 (1.00) 2.0 버전 1 Delta Flow (CVD) M1 캔들만 사용하여 계산(하위 타임프레임 추정치) TICK_FLAG_BUY/SELL 플래그가 포함된 틱 기반의 실제 공격성 델타 — 전문 플랫폼과 동일한 데이터 사용 2
Rudy Bank
Brian Mwangi Ngugi
Volumetric Order Blocks + Market Structure Smart Money order block detection, volume-weighted confirmation, full BOS/CHoCH market structure. Version 1.33: Added  Fair Value Gaps, Premium/Discount/Equilibrium zones, multi-timeframe highs & lows, and Accumulation/Distribution zones. Overview Rudy Bank finds and draws institutional order blocks directly on your chart, then backs every one of them up with real market data: volume, internal buy/sell activity, and precise market-structure context, so
KT MSnR Indicator MT5
KEENBASE SOFTWARE SOLUTIONS
A Malaysian SnR (MSNR) indicator that draws A, V, gap and OCL levels from three timeframes, keeps track of which levels are still fresh, and reads the MSNR storyline for you. The MSNR radar watches your Market Watch and shows which symbol sits at a fresh D1 or H4 level right now. Every level and every storyline turn is confirmed on a closed candle, so the levels you see on past candles are the same levels the chart showed live. What you get All MSNR level types: A levels (resistance), V levels (
WhaleFinder MT5
Kazuya Yamaoka
Considering the main theories of Forex (Dow Theory, support lines, chart patterns, and Fibonacci retracements), It tells you the price range where whales (large investors) are likely to appear. You can trade at the price points that professionals also aim for. You no longer have to warry about where to aim next. We are live-streaming the actual operation of the system. Please check for yourself if it is usable. Please check it out for yourself. https://www.youtube.com/@ganesha_forex We do not
My Pivot
Ashok Kumar Singha
My Pivot is an Indicator based on Pivot Lines and Support-Resistance zones. This Indicator will Plot 11 SR zones including Pivot Line which will definitely help you to understand the exact SR zones of the Market. Steps to Setup the Indicator: Install the Custom Indicator; Set all the Lines Color, Width and Styles; Set visualization to All Timeframe; and DONE It can be used for: All Pairs: Forex, Cryptocurrencies, Metals, Stocks, Indices.  All Timeframe All Brokers All type of Trading S
Zone Structure Scanner Panel for MT5 Find better setups faster — without scanning charts for hours. The Zone Structure Scanner Panel for MT5 helps you automatically scan multiple symbols, detect key weekly and daily support/resistance zones, read market structure, highlight confluence, and flag H4 rejection-confirmed setups from one powerful panel. Instead of jumping from chart to chart, you get ranked opportunities in one place so you can focus on the setups that matter most. Why it stands
New York AM Session Profile NY AM Session Profiling Framework | Non-Repainting | Real-Time | FX & Index Presets | MT4 Version Available Full Setup Guide & Strategy Playbook: https://www.mql5.com/en/blogs/post/771380 MT4 Version: https://www.mql5.com/en/market/product/180946 Indicator Overview The New York AM Session Profile Framework is a professional market-structure visualization tool designed for traders who study liquidity, session behaviour, and institutional price delivery. Instead of
Rtc ML Ai Predictor
Muhammad Faisal Sagala
Rtc ML Ai | Predictor CORE MACHINE LEARNING ENGINE Adaptive ML Market Predictor – Multi-Bar Trend & Candle Forecast What This Indicator Does This indicator is a  real-time market prediction engine  designed to analyze price behavior and estimate  future market tendencies . Unlike conventional indicators, this system  does not rely on static parameters or historical curve-fitting , but adapts its internal state dynamically during live market operation. Instead of using static rules, the indic
Best Gold Trump Era Investing Ea
Mauricio Enrique Rojas Parejo
+4 Years of data. This is the best scalping trend following strategy during this Trump Era.  It has a compound interest system that will make you grow your account while keeping a moderate to low risk. This is not just a BS get-rich-quick bot. This is an actual price action based EA that will perform its best for the next +2 years. Its trades are taken based off of Market Trends, TRUE SnR levels and even ICT's Fair Value Gaps. This has all of the best trading knowledge into one simple EA. If you
SPECIAL LAUNCH OFFER: $30 (1-Month Rent) Limited time offer to build our community and gather feedback! AmbM GOLD Institutional Scalper A high-precision M5 algorithm for XAUUSD (Gold) , engineered to trade exclusively at Institutional Liquidity Levels ($5/$10 psychological marks). PERFORMANCE DATA (BUY ONLY) • Win Rate: 87.09%. • Safe Growth: +$4,113 profit on $10k (13.75% Max Drawdown). • Extreme Stress Test: Successfully generated +$22,997 in a 5-year stress test (2020-2026), proving
Equinox Gold
Dmitriq Evgenoeviz Ko
Equinox Gold is a high-tech trading expert advisor (EA) specifically designed for the gold market ( XAUUSD ). The system is based on a unique Market Equilibrium algorithm that identifies areas of imbalance between supply and demand during extreme volatility. Unlike most robots that use dangerous sit-and-wait methods, Equinox Gold relies on mathematical momentum confirmation and strict risk control for every trade. MAIN ADVANTAGES VRP Filter (Volatility Range Filter): The robot automatically ada
CoioteTradeDetector
Alexandre Moraes De Souza Lima
O CoioteTradeDetector monitora o time and trades (time and salles), é possível criar filtros de alerta gráficos (plotagem de linha com qtd) com variações de agressões pré-definidas. É possível monitorar grandes lotes, ordens diretas e alta frequência de trades. Para perfeito funcionamento do produto é preciso ter os dados de agressão da corretora (acesso completo ao times and trades).
Scalping Dandruff
Daniel Yusoff Bin Asri
Scalping Dandruff Scalping Dandruff는 MetaTrader 5를 위해 설계된 다중 시간대 구조 매핑 지표입니다. 이 지표는 특정 시간 기반 표준 운영 절차(SOP)를 기반으로 핵심 수평 지지 및 저항 영역을 자동으로 표시합니다. 특정 일중 시간대 동안 극단적인 고점과 저점을 식별함으로써, 이 지표는 트레이더가 실행 시간대에서 직접 거시적 시장 구조를 시각화할 수 있도록 해당 레벨을 앞으로 연장합니다. 핵심 기능: 엄격한 꼬리 분리 (Strict Wick Isolation): 차트를 지저분하게 만드는 거대한 블록을 그리는 대신, 캔들 몸통(시가/종가)에서 극단적인 꼬리의 고점이나 저점까지만 영역을 정밀하게 그립니다. 이는 차트를 매우 깔끔하게 유지하고 가격 거부(Rejection) 영역을 엄격하게 강조합니다. 스마트 고스팅 기술 (Smart Ghosting): M15와 같은 하위 시간대에 집중할 때, 겹치는 거시적 영역(H1 및 H4)은 현재의 활발한 가격
Manyal trading system, CovEchoTrend Robot, focuses on reliability and flexibility. By employing statistical analysis methods to study the relationships between the base indicator and market patterns, the system enables a deeper understanding of market processes. Intelligent pattern analysis: The application of statistical data processing helps identify key trend reversal points more accurately, signaling significant market shifts. Informed decision-making is based on the intersection of indicato
Edge finder pro 002
Hassan Al-banna Ahmed Mohamed Ahmed Abdullah
Edge Finder   Pro 002     i s your all-in-one visual trading assistant, designed to cut through the market noise and highlight high-probability trading opportunities at a glance. It is an enhanced version with profit-taking levels, improved chart visibility, and greater ease in entering and exiting the market .   How It Works (The Core Idea): Instead of overloading your chart with complex numbers,    Edge Finder Pro 0 0 2   uses a unique, color-coded system to paint the market picture clearly. T
Based on the trading model/strategy/system of gold double-position hedging and arbitrage launched by Goodtrade Brokers, problems encountered in daily operations: 1. Account B immediately places an order immediately following account A. 2: After account A places an order, account B will automatically copy the stop loss and take profit. 3: Account A closes the position of Account B and closes the position at the same time. 4: When account B closes the position, account A also closes the position.
Smart Swing Signals (SSS) Smart Swing Signals (SSS): closed-candle BUY/SELL arrows, projected swing zones and a transparent evidence score for XAUUSD and other markets. Trade with evidence, not guesswork Most arrow indicators fire a signal on almost every candle and never tell you why. Smart Swing Signals (SSS) works differently. It gathers several independent kinds of market evidence, scores bullish and bearish conditions separately, and draws an arrow only when the setup passes your own rules.
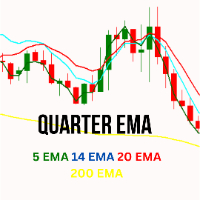
Quarter EMA
Jithin Sajan Sajan
Kindly rate and comment about the product for upgradation & Support The 5 EMA is plotted in green color ( Lime ). The 14 EMA is plotted in red color ( Red ). The 20 EMA is plotted in blue color ( Blue ). The 200 EMA is plotted in yellow color ( Yellow ). The Quarter EMA that provided calculates and plots four Exponential Moving Averages (EMAs) on the chart using different periods: 5, 14, 20, and 200. Each EMA is represented by a different color on the chart. Here's a description of each EMA:
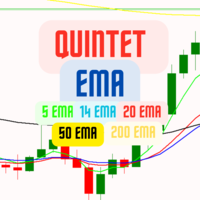
Quintet EMA
Jithin Sajan Sajan
Kindly rate and comment about the product for upgradation & Support The   5 EMA   is plotted in   green   color ( Lime ). The  14 EMA  is plotted in  red  color ( Red ). The   20 EMA   is plotted in   blue   color ( Blue ). The  200 EMA  is plotted in  black  color ( Black ). The   200 EMA   is plotted in   yellow   color ( Yellow ). The Quarter EMA that provided calculates and plots four Exponential Moving Averages (EMAs) on the chart using different periods: 5, 14, 20, and 200. Each EMA is
이 제품의 구매자들이 또한 구매함
Boba Analysis Suite
Trade Ready Solutions LLC
5 (2)
Boba Analysis Suite Boba Analysis Suite는 MetaTrader 5용 분석 지표입니다. 시장 구조, 주요 가격 영역, 전반적인 시장 상황을 하나의 차트 화면에 통합하여 표시합니다. 트레이더이자 트레이딩 코치로서의 실무 경험을 바탕으로 개발되었으며, 시장 방향 평가, 주요 가격 수준 식별, 여러 시간대의 종합적인 분석 등 체계적인 분석 과정을 지원합니다. 시장 맥락을 고려한 분석 개별 신호의 의미는 시장 상황에 따라 달라집니다. Boba Analysis Suite는 현재 차트 상황을 더 넓은 시장 구조와 연결하고, 사전에 정한 규칙에 따라 매매 아이디어를 검토할 수 있도록 돕습니다. 주요 분석 기능은 다음과 같습니다. 추세 및 시장 구조: 시장 방향과 관련 구조적 맥락을 평가합니다. 주요 가격 영역 및 수준: 추가 분석이 필요한 중요한 영역을 차트에 시각적으로 표시합니다. 여러 시간대: 서로 다른 시간대의 정보를 통합하여 전반적인 시장 상황을 평가합니다.
Azimuth Pro
Ottaviano De Cicco
5 (7)
Azimuth Pro V2: Synthetic Fractal Structure and Confirmed Entries for MT5 Overview Azimuth Pro is a multi-level swing structure indicator by Merkava Labs . Four nested swing layers, swing-anchored VWAP, ABC pattern detection, three-timeframe structural filtering, and closed-bar confirmed entries — one chart, one workflow from micro-swings to macro-cycles. This is not a blind signal product. It is a structure-first workflow for traders who care about location, context, and timing. Halloween P
ARIPoint
Temirlan Kdyrkhan
1 (4)
ARIPoint is a powerful trading companion designed to generate high-probability entry signals with dynamic TP/SL/DP levels based on volatility. Built-in performance tracking shows win/loss stats, PP1/PP2 hits, and success rates all updated live. Key Features: Buy/Sell signals with adaptive volatility bands Real-time TP/SL/DP levels based on ATR Built-in MA Filter with optional ATR/StdDev volatility Performance stats panel (Success, Profit/Loss, PP1/PP2) Alerts via popup, sound, push, or email Cu
UZFX {SSS} 스캘핑 스마트 시그널 v5.0 MT5는 급변하는 시장에서 정확한 실시간 시그널을 필요로 하는 스캘퍼, 데이 트레이더, 스윙 트레이더를 위해 설계된 리페인팅이 없는 고성능 트레이딩 지표입니다. (UZFX-LABS)에서 개발한 이 지표는 가격 움직임 분석, 추세 확인 및 스마트 필터링을 결합하여 모든 통화 쌍과 시간대에서 높은 확률의 매수 및 매도 신호, 경고 신호, 추세 지속 기회를 생성합니다. 거래에 대한 망설임을 멈추고, 명확성, 정밀성, 그리고 규율 있는 시장 실행을 원하는 트레이더를 위해 설계된 체계적인 신호 시스템을 따르기 시작하세요. 제 말을 믿으세요. 이 지표는 MQL5에서 구할 수 있는 최고의 지표 중 하나입니다. 그러니 절대 놓치지 마세요!! “현명한 트레이더를 위한 스마트 신호” 지금 최신 버전 5.0이 출시되었으며, 사전 공지 없이 가격이 최대 $499.99까지 인상될 수 있으니 기회를 놓치기 전에 서둘러 구매하세요!! 최종 구매 전! 무료 체
Zain Gold Scalping
Ahmed Gamal Abdel Nasser Mohamed
A complete price-action analysis tool built around dual independent entry logic, each confirmed against a volatility band, combined with a configurable set of nine optional confirmation filters that let you shape exactly how conservative or aggressive the tool's signals behave. Core Strategy Two independent entry setups, each triggering only when price moves outside a dynamic volatility band — giving two distinct ways to spot potential reversal points, which can be used together or separately.
OmniSync Projection
Antonio-alin Teculescu
5 (1)
Chronos Fractal Engine is an innovative price projection indicator for MetaTrader 5, designed to transform your technical analysis by intelligently identifying and projecting historical price patterns. Built upon an advanced correlation algorithm and the fractal principles of the market, this powerful tool visualizes potential future price movements, giving you a unique edge in your trading decisions. What is Chronos Fractal Engine? At its core, the Chronos Fractal Engine employs a sophisticat
Orderflow Big Trade 추정 델타 히트맵으로 캔들 내부에 숨겨진 매수·매도 압력 포착 일반 캔들 차트 내부 에서 일어나는 결정적인 거래 활동을 놓치고 계신가요? Orderflow Big Trade 는 고도화된 변동폭 및 종가 가중치 알고리즘을 사용하여 그룹화된 가격대별 매수 및 매도 압력을 추정합니다. 단순 거래량에만 의존하는 대신, 프라이스 액션 동역학을 명확한 시각적 델타 맵으로 변환하여 기관의 물량 흡수(Absorption), 모멘텀 돌파, 갇힌 트레이더(Trapped Traders), 그리고 주요 구간의 수용 및 거절을 즉각 식별할 수 있도록 돕습니다. [ 무료 데모 버전 다운로드 ] 지금 바로 실제 차트에서 모든 기능을 테스트해보세요. 구매 전 설정 변경, 시각적 명확성 확인, 본인의 매매 전략과의 적합성을 부담 없이 경험하실 수 있습니다. 트레이딩 핵심 강점 캔들 내부 델타 추정: 캔들의 고저 범위와 종가 위치를 분석하여 특정 가격 클러스터
OrderFlow Absorption – MT5용 전문 델타 & 흡수 신호 인디케이터 OrderFlow Absorption으로 진정한 오더플로우 분석의 힘을 경험하세요. MetaTrader 5를 위한 궁극의 델타 히스토그램 및 흡수 신호 인디케이터입니다. 가격 움직임의 이면에서 실제로 무슨 일이 일어나는지 알고 싶은 트레이더를 위해 설계된 이 도구는, 시장을 움직이는 숨겨진 매수/매도 압력과 흡수 이벤트를 드러냅니다. 주요 기능 델타 히스토그램 시각화:   매수와 매도 압력을 색상별 히스토그램으로 즉시 확인할 수 있습니다. 흡수 신호 감지:   고급 로직으로 강세 및 약세 흡수 이벤트를 식별하여 반전 신호를 미리 알려줍니다. 차트 마커:   흡수 신호가 차트에 직접 표시되어 시각적으로 쉽게 확인할 수 있습니다. 팝업 알림:   새로운 흡수 신호가 발생하면 실시간으로 알림을 받을 수 있습니다. 사용자 지정 임계값:   약한 신호는 필터링하고, 확률이 높은 기회에 집중할 수 있습니다.
Gem SIGNAL
Shengzu Zhong
5 (1)
GEM Signal Pro GEM Signal Pro는 MetaTrader 5용 추세추종형 지표로, 차트에서 더 명확한 신호, 더 구조적인 트레이드 설정, 그리고 더 실용적인 리스크 관리를 원하는 트레이더를 위해 설계되었습니다. 단순한 화살표만 표시하는 것이 아니라, GEM Signal Pro는 전체 트레이드 아이디어를 더 깔끔하고 읽기 쉬운 방식으로 보여줍니다. 조건이 확인되면 진입가, 손절가, 목표가를 차트에 표시하여 트레이더가 설정을 더 효율적으로 검토할 수 있도록 도와줍니다. 작동 방식 이 지표는 먼저 내부 로직에 따라 유효한 초기 신호를 식별합니다. 확인 조건이 충족되면, GEM Signal Pro는 차트에 전체 설정을 표시합니다. 이를 통해 트레이더는 거래 구조를 더 명확하게 보고, 수동 분석 작업을 줄일 수 있습니다. 차트에 표시되는 거래 레벨 확인된 신호에 대해, GEM Signal Pro는 다음을 표시할 수 있습니다. 진입가 손절가 목표가 1 목표가 2 목표가 3 손
TrendMaestro5
Stefano Frisetti
note: this indicator is for METATRADER4, if you want the version for METATRADER5 this is the link:  https://www.mql5.com/it/market/product/108106 TRENDMAESTRO ver 2.5 TRENDMAESTRO recognizes a new TREND from the start, he never makes mistakes. The certainty of identifying a new TREND is priceless. DESCRIPTION TRENDMAESTRO identifies a new TREND in the bud, this indicator examines the volatility, volumes and momentum to identify the moment in which there is an explosion of one or more of these da
Quantum Momentum Guard (QMG) Breakout and Momentum Indicator for MetaTrader 5 Overview Quantum Momentum Guard (QMG) is a technical indicator for MetaTrader 5 designed to identify potential breakout opportunities by combining momentum analysis, breakout conditions, and mathematical validation. The indicator evaluates market conditions to generate directional signals when its configured criteria are met. It is designed primarily for XAUUSD (Gold) and can also be used on other financial instruments
Title:FX-AIEA Supply and Demand Zone Indicator (MT5) — Technical Overview Version: 2.51 | Platform: MetaTrader 5 Introduction Supply and demand zones are considered a core manifestation of institutional order flow, providing a more direct reflection of buying and selling pressure than traditional support/resistance levels. This indicator attempts to automate the identification of high-probability supply and demand zones using an adaptive ZigZag algorithm, reducing the subjectivity and time asso
Naked Forex Kangaroo Tail Pro Indicator Kangaroo Tail Pro Indicator is a pattern recognition indicator for Forex, Stocks, Indices, Futures, Commodities and Cryptos. The Kangaroo Tail is a multi-bar pattern. The Kangaroo Tail pattern is very effective and is very simple to trade. The strategy that comes with the Kangaroo Tail is based on price action. The indicator does what it was designed for: displaying Kangaroo Tail patterns.     Don't expect to follow the up and down arrows and make mone
ORB Seeker MT5
Marcela Goncalves De Oliveira
한정 수량 판매 및 제품 희소성 유지를 위한 특별 가격입니다! 단돈 599달러! 구매 후 저에게 연락 주시면 보너스 ORB Seeker EA와 개인 최적화 설정 파일을 보내드립니다. 깔끔한 세션 브레이크아웃을 자신감 있게 활용하세요! ORB Seeker MT5는 정확성, 단순성, 유연성 및 명확한 차트 구조를 원하는 트레이더를 위해 개발된 전문적인 시가 범위 돌파(ORB) 지표입니다. 이 프로그램은 모든 금융 상품에 대해 장전 거래 또는 사용자 지정 세션 범위를 자동으로 표시하고, 진입, 손절매, 목표 수익 및 선택적으로 50% 부분 목표 수익 수준을 포함한 명확한 돌파 신호를 제공합니다. 모든 계산은 실시간으로 차트에 직접 표시됩니다. 런던 개장, 뉴욕 세션, 아시아 세션 또는 사용자 지정 시장 시간대를 선택하여 거래하세요. ORB Seeker MT5는 사용자가 선택한 세션 시간에 맞춰 작동하므로 시장 범위, 돌파 레벨 및 거래 레벨을 정확하게 확인할 수 있습니다. 모든 구매
Zain Gold ScalpingV5
Ahmed Gamal Abdel Nasser Mohamed
Zain Gold Scalping V5 is a technical analysis indicator for MetaTrader 5 designed for Forex and Gold markets. It provides chart-based market information, trend analysis, signal conditions, and an on-screen dashboard to help traders analyze price movement across multiple timeframes. Main Features The indicator supports multiple timeframes, including M1, M5, M15, M30, H1 and higher timeframes. It can be used with Gold (XAUUSD), Forex currency pairs, indices and other supported instruments. The in
The indicator is designed to close positions on the market in time. For example: to take profits ahead of schedule if the price has not reached TakeProfit, and the market is turning around. The indicator analyzes the momentum, not the trend. He does not give any information about the trend. The indicator is well suited for finding divergence. The Ershov 38 Parrots indicator dynamically adjusts to the market and detects price movement impulses of medium and high amplitude. It almost does not rea
First time on MetaTrader, introducing IQ Star Lines, an original Vedic Astrology Based Intraday Trading Indicator. We don't offer free or bonus indicators in exchange of reviews from you. You won't need any free products with this indicator to make it work. ;) Enjoy! Welcome to the new and updated  IQ Star Lines , the ultimate fusion of ancient planetary cycles and modern quantitative trading, published for the first time on Metatrader. This is an indicator built by the developer, who has spent
AriX
Temirlan Kdyrkhan
1 (4)
AriX Indicator for MT5 A powerful trend-following and signal-evaluation tool AriX is a custom MT5 indicator that combines Moving Averages and ATR-based risk/reward logic to generate clear buy/sell signals. It visualizes dynamic SL/TP levels, evaluates past trade outcomes, and displays win/loss statistics in a clean on-chart panel. Key features include: Buy/Sell signals based on MA crossovers ATR-based SL/TP1/TP2/TP3 levels with visual lines and labels Signal outcome tracking with real-time stat
Meravith Scanner
Ivan Stefanov
5 (3)
MERAVITH SCANNER는 MetaTrader 5용 전문 금융 시장 지표로, 여러 분석 도구를 하나의 통합 시스템으로 결합합니다. 독점적인 거래량 가중 평균 가격(VWAP) 방법론을 사용하여 모든 계산을 자동으로 수행하며, 주관적인 해석을 완전히 배제합니다. 이 지표는 모든 자산 클래스(Forex, 주식, 지수, 상품, 암호화폐)와 M1부터 월간 차트까지 모든 시간 프레임에서 작동합니다. 기본 원리는 “가격은 거래량을 따른다”입니다. MERAVITH는 기관 거래량이 집중되는 위치를 식별하고, 그 집중에서 수학적으로 정확한 가격 수준을 도출합니다. 예측이나 투기를 하지 않으며, 계산만 수행합니다. MERAVITH SCANNER를 사용하면 28개의 주요 Forex 통화쌍을 모든 시간 프레임에서 단 2~3분 만에 스캔할 수 있습니다. 또한 원하는 시장을 스캔할 수도 있으며, 예를 들어 약 100개의 주식을 약 10분 안에 스캔할 수 있습니다. 지표는 소진 레벨, 균형선, 편차, 통계
Boom & Crash & PainX & GainX Ultimate Spike Detector Trade Spikes With Confidence — Not Guesswork Catching spikes should be one of the most profitable strategies in synthetic markets. But for most traders, it becomes one of the most frustrating. You enter too early… price goes against you. You wait for a spike… it never comes. You finally catch one… but don’t know whether to hold or close. You make profit… then give it all back because there’s no exit plan. This is exactly the problem the Ultim
한 문장으로 이해하면 이 인디케이터는 RSI와 MACD, 두 전문가를 하나로 묶은 것 입니다. 두 지표를 따로 보며 판단할 필요 없이, 둘 다 동의할 때만 "매수" 또는 "매도" 화살표를 보여줍니다. 화살표는 다시 그려지지 않습니다 . 한 번 나타나면 그 자리에 고정됩니다. "콤보"의 의미 보통 트레이더는 RSI(가격 움직임의 힘)와 MACD(추세 방향)를 따로 봅니다. 그런데 둘의 신호가 충돌할 때가 많죠. 이 인디케이터는 두 지표가 동시에 같은 방향을 가리킬 때만 신호를 냅니다 . 덕분에 가짜 신호가 훨씬 줄어듭니다. 화면에서 보이는 것 가격 차트와 분리된 인디케이터 창 파란색과 빨간색 화살표 – 바로 쓸 수 있는 매매 신호 확대된 MACD 히스토그램 (모멘텀을 쉽게 파악하도록 더 크고 선명하게 표시) RSI와 MACD 선도 함께 표시되지만, 주목할 것은 화살표 이런 분께 적합합니다 초보자 – 두 지표를 따로 해석하고 모순을 처리할 필요 없음 경험자 – 빠른 신호 필터링, 다시
Chimera Volume
Marko Milenkovic
MetaTrader 5용 Chimera Volume 고급 거래량 분석 및 시장 활동 시각화 Chimera Volume은 MetaTrader 5 전용 사용자 정의 지표로, 정규화된 거래량 활동을 분석하고 역동적인 시각적 프레임워크를 통해 시장 참여도의 변화를 보여주도록 설계되었습니다. 이 지표는 적응형 정규화 알고리즘을 사용하여 틱 거래량 데이터를 처리하며, 다양한 시장 상황 속에서 거래량의 강도, 매집 단계, 활동 변화를 구조화된 형태로 생성합니다. 원시 거래량 값을 표시하는 일반 거래량 지표와 달리, Chimera Volume은 추가 계산을 적용하여 시장 활동의 상대적 변화를 강조하고 차트의 가독성을 향상시킵니다. 주요 기능 루트 인텐트 히스토그램 (Root Intent Histogram): 정규화된 거래량 강도와 시장 참여도를 시각화하는 동적 히스토그램입니다. 적응형 색상 전환을 사용하여 활동 증가 시기와 참여 감소 시기를 명확하게 구분합니다. 관성 라인 (Inertia Line
Meravith MT5
Ivan Stefanov
5 (3)
MERAVITH는 MetaTrader 5용 멀티 타임프레임 거래량·유동성 지표로, 모든 타임프레임에서 추세, 지지와 저항 구간, 진입, 목표, 손절을 보여줍니다. 시장의 완전한 유동성 지도, 헤지펀드 스타일의 유동성 도구를 제공하며, 자체 거래량 가중 평균 가격 방식으로 모든 계산을 자동으로 수행하므로 주관적인 해석이 없습니다. 외환, 금(XAUUSD), 지수, 암호화폐에서 작동하며, 모든 타임프레임에서 사용할 수 있습니다. 구매 후 보너스: MERAVITH로 거래하는 방법에 대한 동영상 강의 모음. 구매 후 저에게 메시지를 보내주세요. MERAVITH의 기능 모든 타임프레임을 분석하고 각 타임프레임에서 현재 유효한 추세를 보여줍니다. 유동성 구간(Volume Equilibrium)을 표시합니다. 상승 거래량과 하락 거래량이 같아지는 지점입니다. 모든 타임프레임의 유동성 레벨을 차트에 직접 표시합니다. 참고용으로 시장의 텍스트 분석을 작성합니다. 현재 추세를 기준으로 진입, 목표,
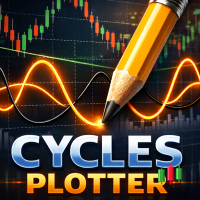
Cycles Plotter
Edoardo Centorame
Cycles Plotter 이동 평균과 시작 날짜가 있는 사용자 지정 가능 사이클 지표 Cycles Plotter는 사용자의 입력에 의해서만 완전히 사용자 지정 가능한 두 개의 사인파 사이클을 그리는 고급 기술 지표입니다. 사이클을 자동으로 생성하지 않습니다. 모든 사이클은 사용자가 설정한 매개변수에만 기반하여 계산되며, 자동 신호나 예측을 생성하지 않고 가격 진동과 잠재적인 추세 변화를 연구하기 위한 시각적 도구를 트레이더에게 제공합니다. 핵심 사항: 사용자 정의 사이클: 사이클 1 P1 및 2 P2는 사용자가 완전히 구성할 수 있습니다. 사이클 길이, 진폭, 이동 평균, 정확한 시작 날짜와 시간을 설정할 수 있습니다. 사용자가 매개변수를 입력하지 않으면 어떤 사이클도 그려지지 않습니다. 진폭 제어: 각 사이클은 다른 진폭을 가질 수 있어 기준 이동 평균에 대한 진동의 높이를 조정할 수 있습니다. 추세 감지: 빠른 이동 평균과 느린 이동 평균은 사이클의 방향을 나타냅니다: Fast
VTrende Pro
Andrii Diachenko
5 (1)
VTrende Pro - MTF indicator for trend trading with a display panel for MT5 *** Videos can be translated into any language using subtitles (video language - Russian) Although the signals of the VTrende Pro indicator can be used as signals of a full-fledged trading system, it is recommended to use them in conjunction with the Bill Williams TS. VTrende Pro is an extended version of the VTrende indicator. Difference between Pro version and VTrende: - Time zones - Signal V - signal 1-2 waves -    S
Volume Arrow Signal Product Description Volume Arrow Signal is a smart trading indicator designed to help traders identify potential buy and sell opportunities using price action, volume behavior, and directional arrow signals. The indicator places clear arrows directly on the chart, making it easy to spot possible market reversals, trend continuations, and entry opportunities without spending hours analyzing charts manually. Whether you are trading Gold (XAUUSD) , Forex pairs, Indices, or Crypt
MasterTrend
Temirlan Kdyrkhan
MasterTrend Indicator for MT5 A powerful trend-following and signal-evaluation tool MasterTrend   is a custom MT5 indicator that combines Moving Averages and ATR-based risk/reward logic to generate clear buy/sell signals. It visualizes dynamic SL/TP levels, evaluates past trade outcomes, and displays win/loss statistics in a clean on-chart panel. Key features include: Buy/Sell signals based on MA crossovers ATR-based SL/TP1/TP2/TP3 levels with visual lines and labels Signal outcome tracking wit
SMC Sweep Fvg MT5
Daniil Sleptsov
5 (1)
SMC Sweep Fvg MT5 — 스마트 머니처럼 시장을 보세요, 차트 위에서 바로 이런 경험, 알고 계실 겁니다. 가격이 스톱을 훑고, 돌아서, 기대했던 방향으로 그대로 갑니다. 방향은 맞았습니다. 틀린 것은 진입뿐이었습니다. 이 지표는 그런 일이 덜 일어나도록 만들어졌습니다. 분석에서 가장 무거운 부분—차트 마킹—을 대신하고, 진짜 중요한 것인 결정은 당신에게 남깁니다. 차트에서 보이는 것 시장 구조 — 실제 구조적 고점·저점에 HH / HL / LH / LL 라벨과 레벨 라인. 추측 없이 추세가 바로 보입니다. 불균형 구간(FVG) — 가격이 너무 빠르게 지나갔고 나중에 자주 되돌아오는 영역. 열린 구간과 이미 메워진 구간은 다른 색으로 표시됩니다. 유동성 행동 — 반전 전에 시장이 레벨을 훑는 순간을 추적합니다. 완성된 트레이드 레이아웃 — 진입 화살표, 손절 레벨, 이익 목표. 모두 그려져 있어 머릿속 계산이 필요 없습니다. 추세 필터 — 상위 타임프레임 라인으로
Gold Xausd Hunter
Metin Erkamoglu
5 (2)
MATADOR GOLD XAUUSD M5 Scalp Signals for MT5 MATADOR GOLD is a decision-support indicator for MetaTrader 5, designed for traders who analyze short-term Gold movement on the M5 timeframe. The indicator does not open, close, or manage trades automatically. It provides buy and sell signal guidance so the user can make their own trading decisions according to their risk plan, broker conditions, and trade management rules. Main purpose MATADOR GOLD is built to help traders avoid noisy signal flow and
제작자의 제품 더 보기
Tun Gold M15
Muhammad Edzwan Ashraf
TUN EDGE M15 - Breakout Retest Expert Advisor for XAUUSD Tun Edge is a fully automated Expert Advisor for Gold (XAUUSD) on the M15 timeframe. It trades one clean setup: a breakout of a recent high or low, followed by a retest of the broken level and a confirmation candle in the breakout direction. Instead of chasing the first breakout candle, it waits for the market to prove the level holds. HOW IT WORKS 1. Breakout - price closes beyond the high/low of the previous 8 candles. 2. Retest - the
FREE
Tun Perak Indicator
Muhammad Edzwan Ashraf
Tun Perak Signal – XAUUSD Hunter A clean and structured XAUUSD trading indicator for MetaTrader 5. Congrats on the early bird who got the free version! Any Feedback would be appreciated Discount Price= 50USD only for 10 downloads Tun Perak Signal – XAUUSD Hunter is designed for Gold traders who prefer a simple chart with clearly defined trading areas instead of a screen filled with complicated indicators. The indicator automatically scans the market and presents the latest detected setup dire
Multi Engine Gold
Muhammad Edzwan Ashraf
Tun Perak Signal is an MT5 trading indicator developed for XAUUSD traders, with particular focus on lower-timeframe trading and scalping. The indicator combines six proprietary signal methods into one system. Users only need to select the preferred entry method while the internal signal conditions and filters are handled automatically. The aim is to keep the setup simple while providing the information needed to evaluate each signal directly on the chart. ------------------------------------
FixedVol100 Signal
Muhammad Edzwan Ashraf
Product name TunVol Zone TP3 Only tested with Broker Vantage Short description Zone-based entry indicator with SL at the zone edge and three take-profit levels. One signal at a time, a clean dashboard and trend view. Built for FixedVol100, and it adapts automatically to other symbols. Full description TunVol Zone TP3 finds high-probability reaction zones and shows a complete trade plan on the chart: entry, stop loss and three take-profit targets. The idea is simple: wait for price to come in
Bangsa Kanan Indicator
Muhammad Edzwan Ashraf
BANGSA KANAN INDICATOR: Look To The Right Method Early Bird Price= 150USD Normal Price= 599USD Most traders draw levels once and forget them. Old lines pile up, the chart gets messy, and you can't tell which level still matters. Bangsa Kanan keeps only the levels that are still alive: • Born from a swing, using the shortest wick in the cluster • Alive while price keeps respecting it on the right side of the chart • Removed automatically once price crosses it twice with no reaction • Every
WTI Hunter
Muhammad Edzwan Ashraf
WTI Pullback EA A disciplined trend-pullback Expert Advisor built specifically for WTI crude oil (USOIL / XTIUSD / WTI) on the H1 timeframe. The EA waits for the market to be in a clear trend, then waits for a pullback, and only enters when price closes back in the trend direction during the most liquid session. Instead of chasing the market, it places a limit order at a better price, so every trade starts with a smaller risk. ------------------------------------------------------------ IMPO
필터:
리뷰 없음
리뷰 답변