M Code AI
- 지표
-
Thomas Bradley Butler
 ALL OF MY PRODUCTS ARE CLEARLY STATED WITH WHAT TO DO AND YOU MUST READ ALL AND FOLLOW DESCRIPTIONS.
 - 버전: 1.0
- 활성화: 5
📊 M Code AI | The Smart Trader.
Professional Trading Indicator
🌟 What This Indicator Does
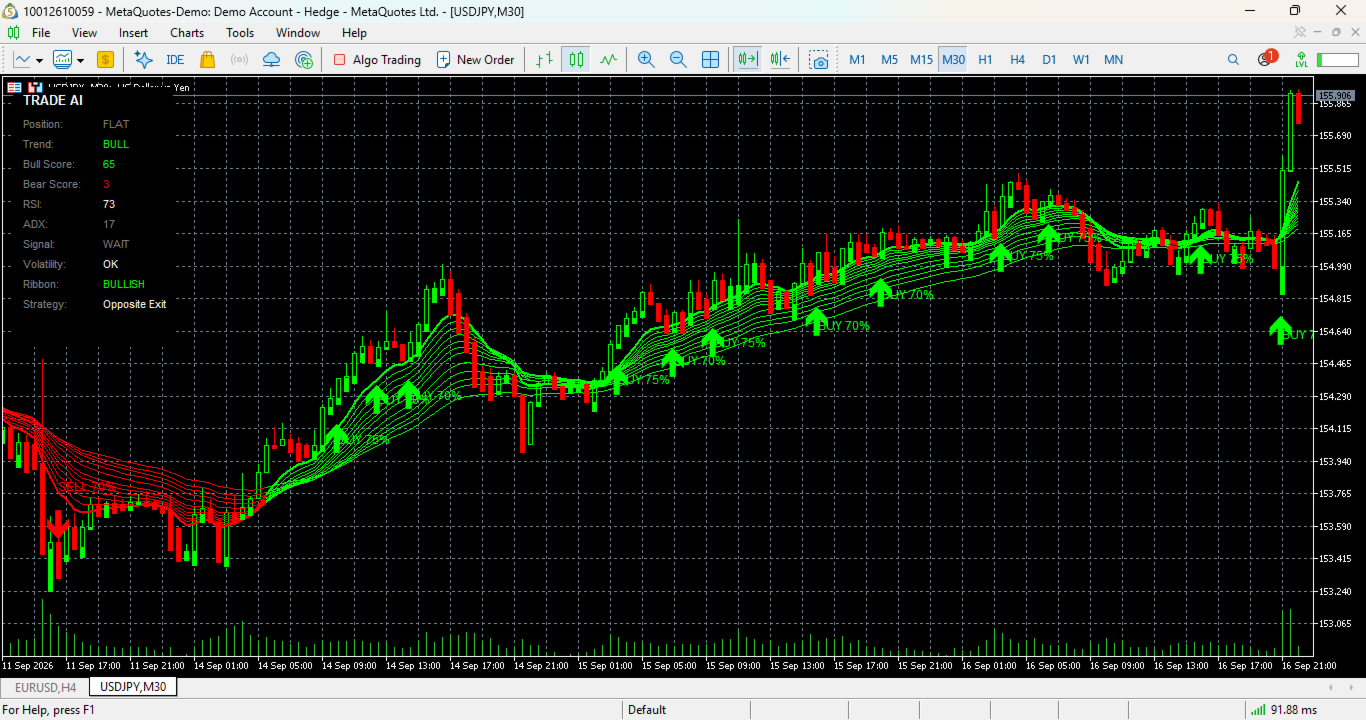
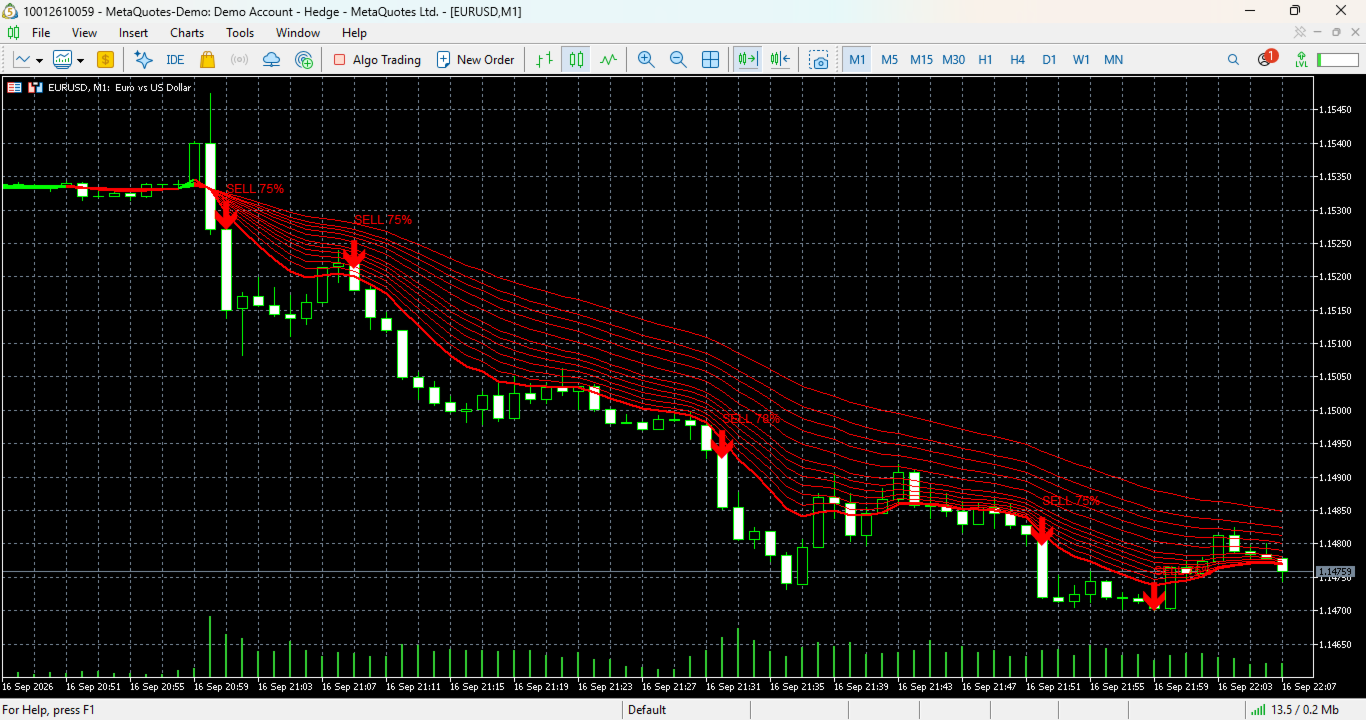
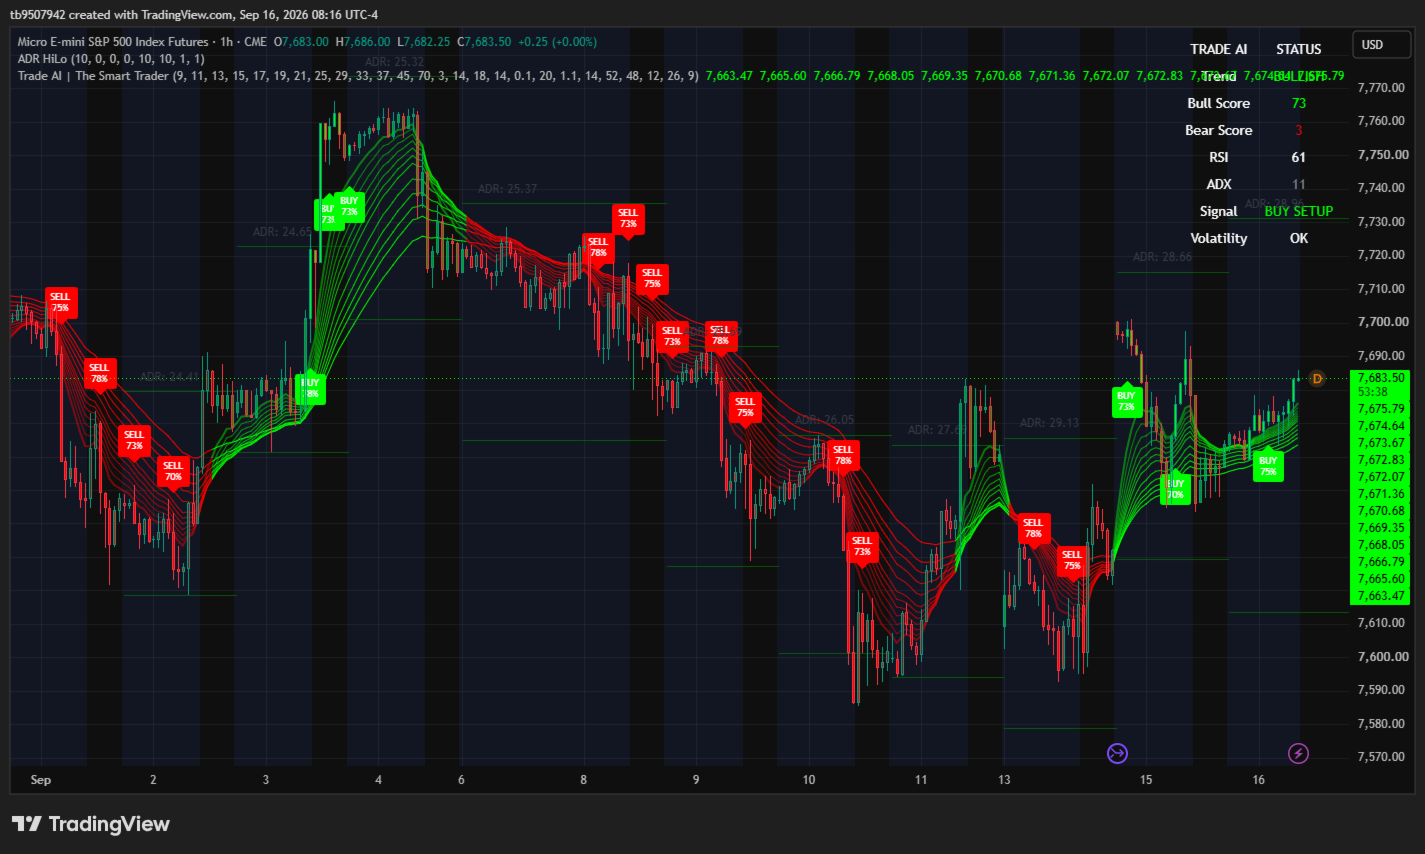
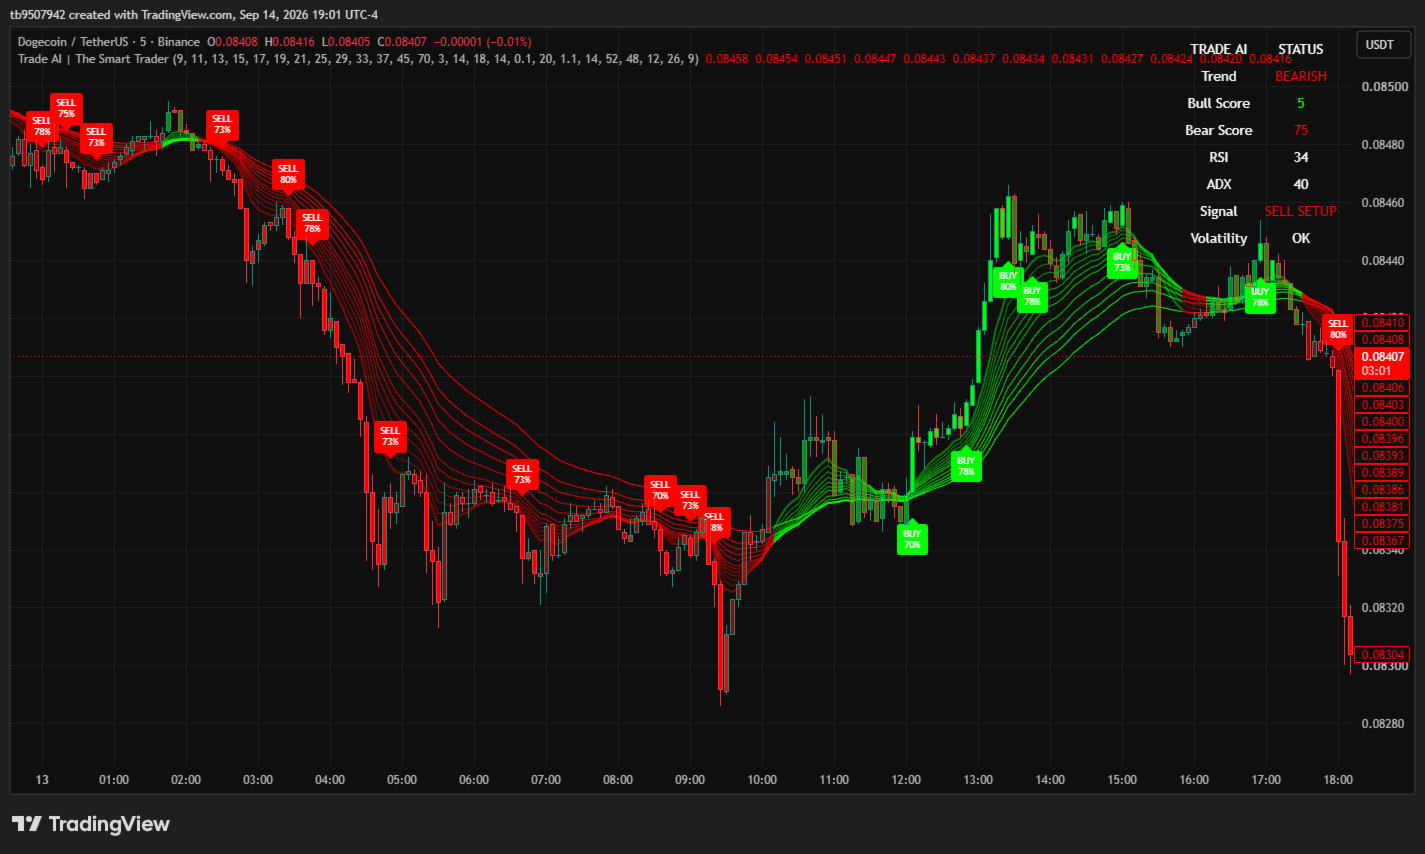
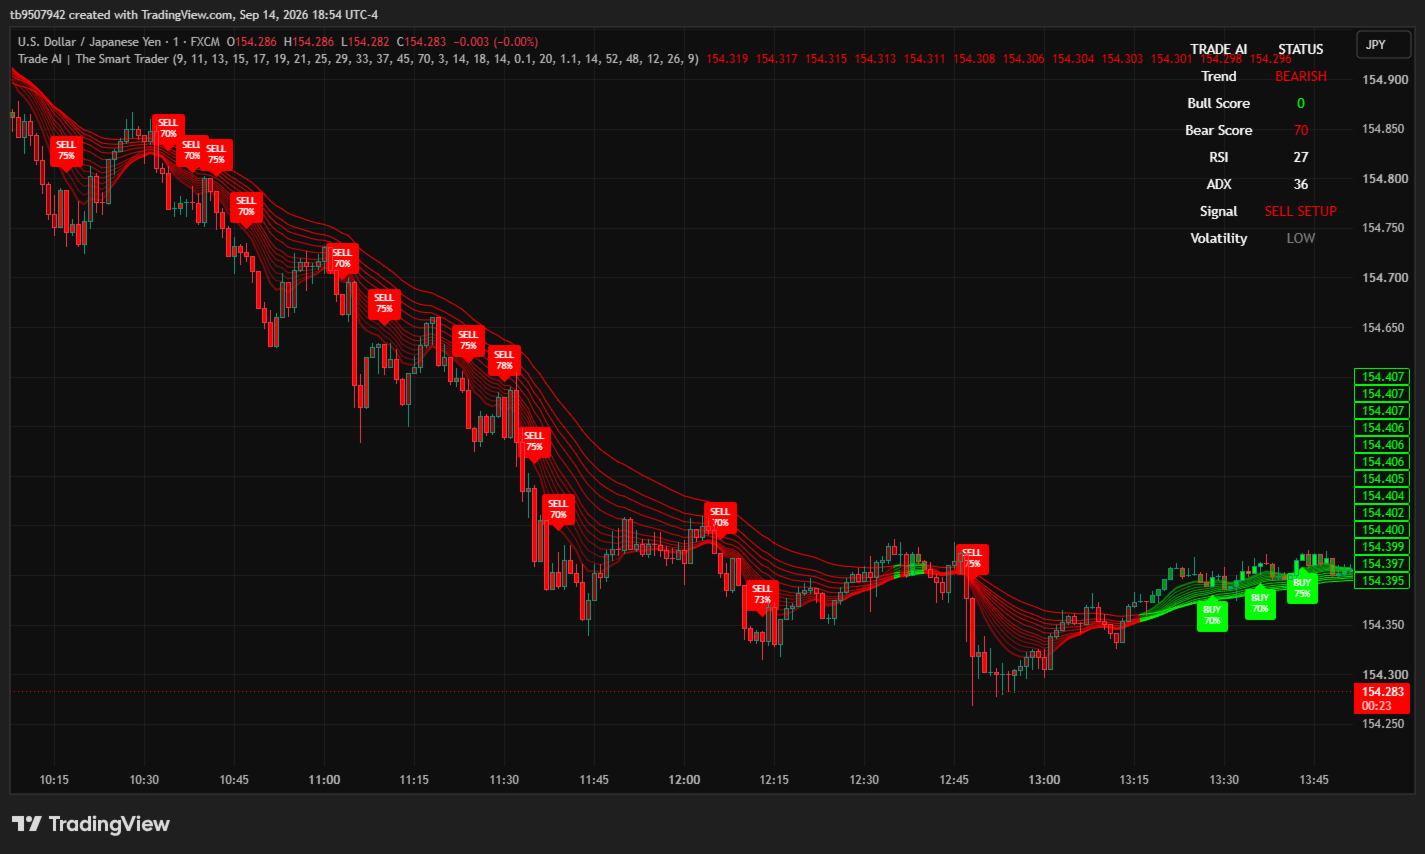
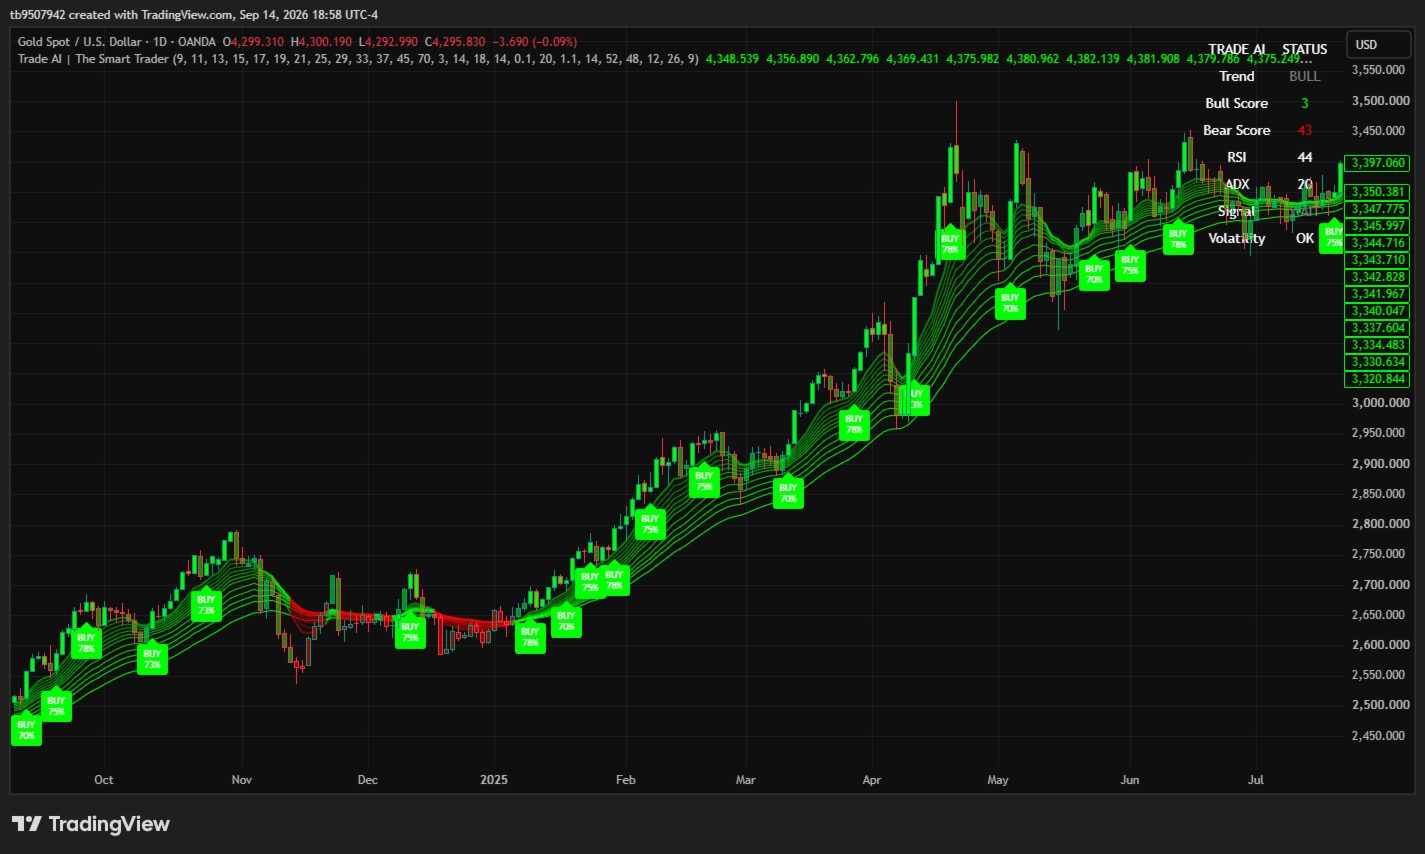
Trade AI is a sophisticated trading indicator that identifies high-probability trend changes using a 12-line EMA Ribbon system. It displays clear buy and sell signals directly on your chart, helping you catch major market moves with confidence.
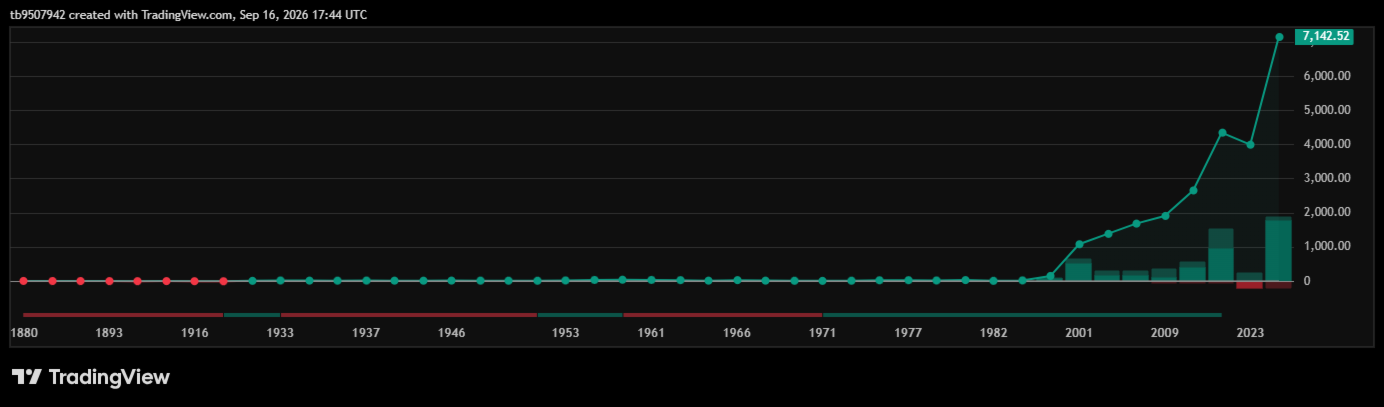
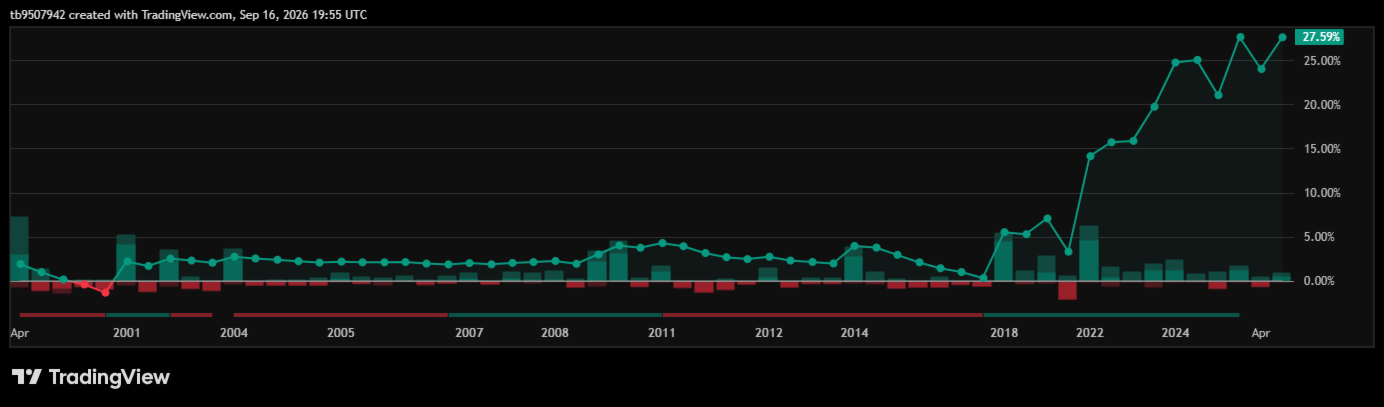
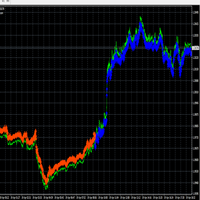
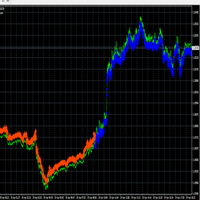
The strategy backset shown is from the start of every first signal to the opposite of the first opposite signal
✨ Features
🎯 EMA Ribbon Visualization
12 color-coded EMA lines create a beautiful "ribbon" effect
Green ribbon = Bullish trend (all EMAs aligned upward)
Red ribbon = Bearish trend (all EMAs aligned downward)
Gray = Neutral/No trend
📈 Smart Buy/Sell Signals
Green Arrow Up = BUY signal when bull ribbon forms
Red Arrow Down = SELL signal when bear ribbon forms
Signals only appear when ADX confirms strong trend (no choppy markets!)
📊 Real-Time Dashboard
Top-left panel shows at a glance:
Trend Status: BULLISH / BEARISH / NEUTRAL
Bull & Bear Scores: 0-100 confidence levels
RSI: Current momentum reading
ADX: Trend strength indicator
Signal Status: BUY SETUP / SELL SETUP / WAIT
Volatility: OK or LOW market conditions
🔧 Fully Customizable
Toggle signals on/off
Adjust ADX minimum threshold
Enable/disable momentum filters
Change colors to match your preference
Show/hide dashboard
Color candles by trend
🎯 Perfect For
Trader Type Why It Works
Trend Traders Catches the beginning of major trends
Swing Traders Identifies multi-day momentum shifts
Scalpers Filters out choppy, range-bound markets
Beginners Clear visual signals eliminate guesswork
📋 Requirements
Timeframes: Works on all timeframes (M1 to D1)
Assets: Forex, Crypto, Stocks, Indices, Commodities
🚀 How To Use
copy source code into new indicator panel
Attach to any chart
Watch for arrow signals + ribbon color changes
Trade in the direction of the ribbon
💡 Pro Tips
Confirm with Dashboard: Check that ADX shows "OK" before taking signals
Higher Timeframes: More reliable signals on H4 and Daily charts
Combine with Support/Resistance: Signals near key levels are higher probability
Wait for Candle Close: Signals appear after bar closes (no repainting)
📦 What's Included
✅ Trade AI Indicator
Past performance is no guarantee nor do I make any claims.