Tick Volum dotes
- 지표
- 버전: 2.10
- 업데이트됨: 22 10월 2026
- 활성화: 5

Tick Volume Dots — Uptick/Downtick Confirmation Indicator
A simple visual filter to confirm momentum, spot exhaustion, and add tick-level confluence to your existing strategy.
Description:
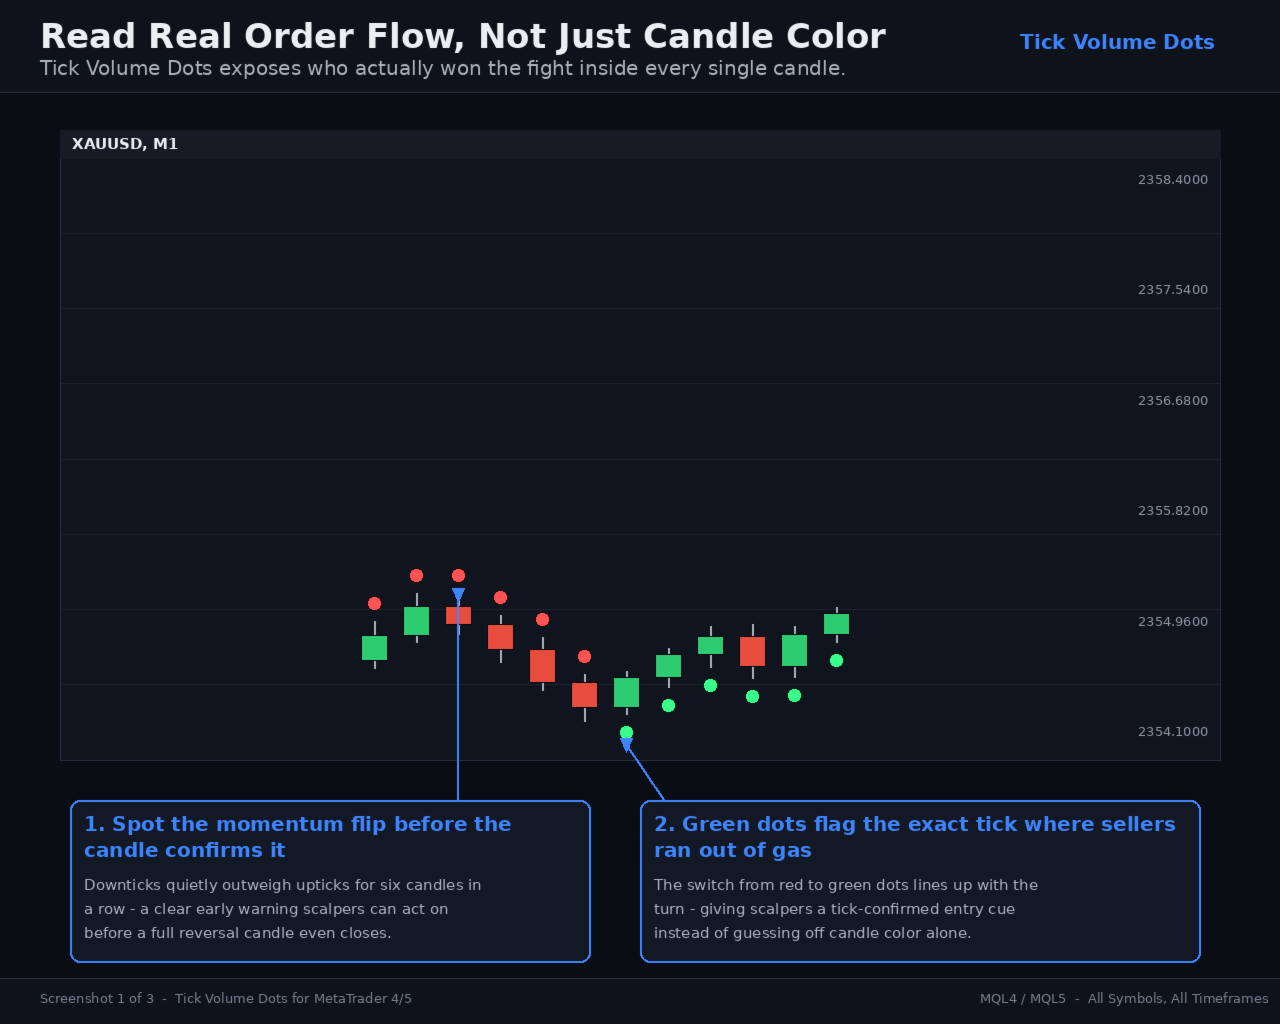
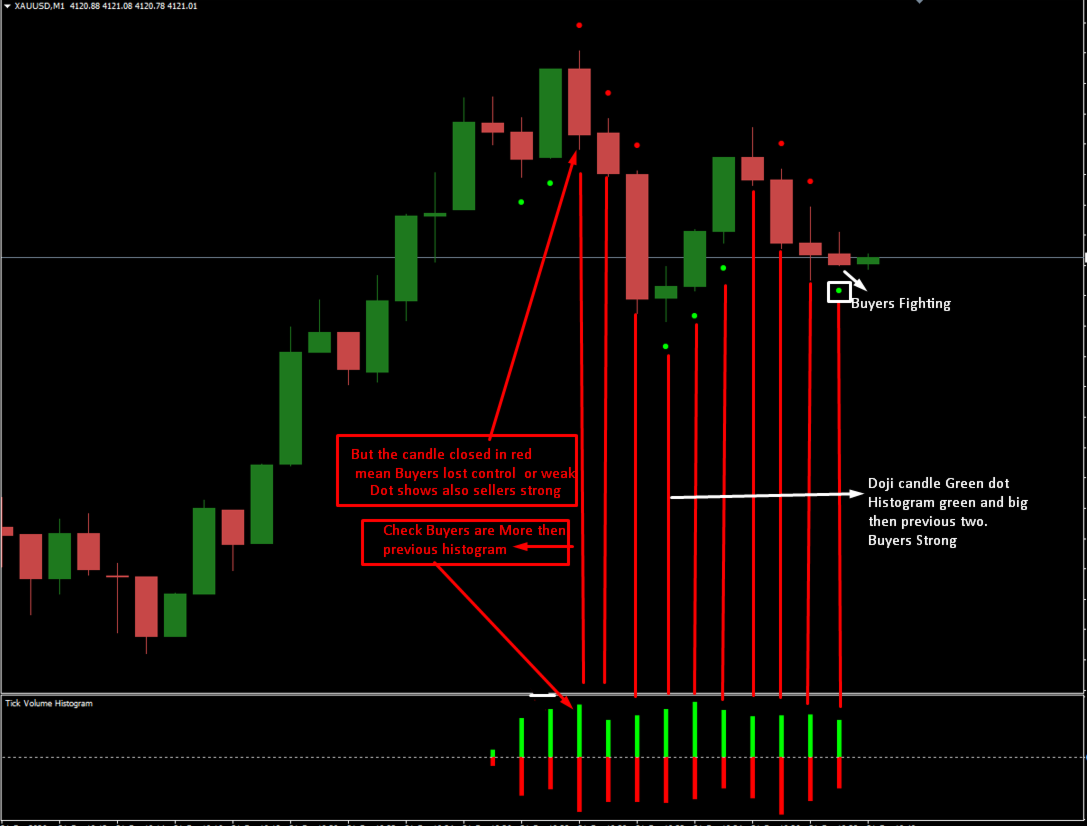
- "Read Real Order Flow, Not Just Candle Color" — shows a run of red dots quietly warning of a reversal before the candles confirm it, then the flip to green dots at the exact turn.
- "Confirm Scalp Entries in Seconds" — pairs the on-chart dots with the histogram subwindow, showing how a burst of green dots + a tall green bar = high-conviction entry, versus choppy mixed signals to skip.
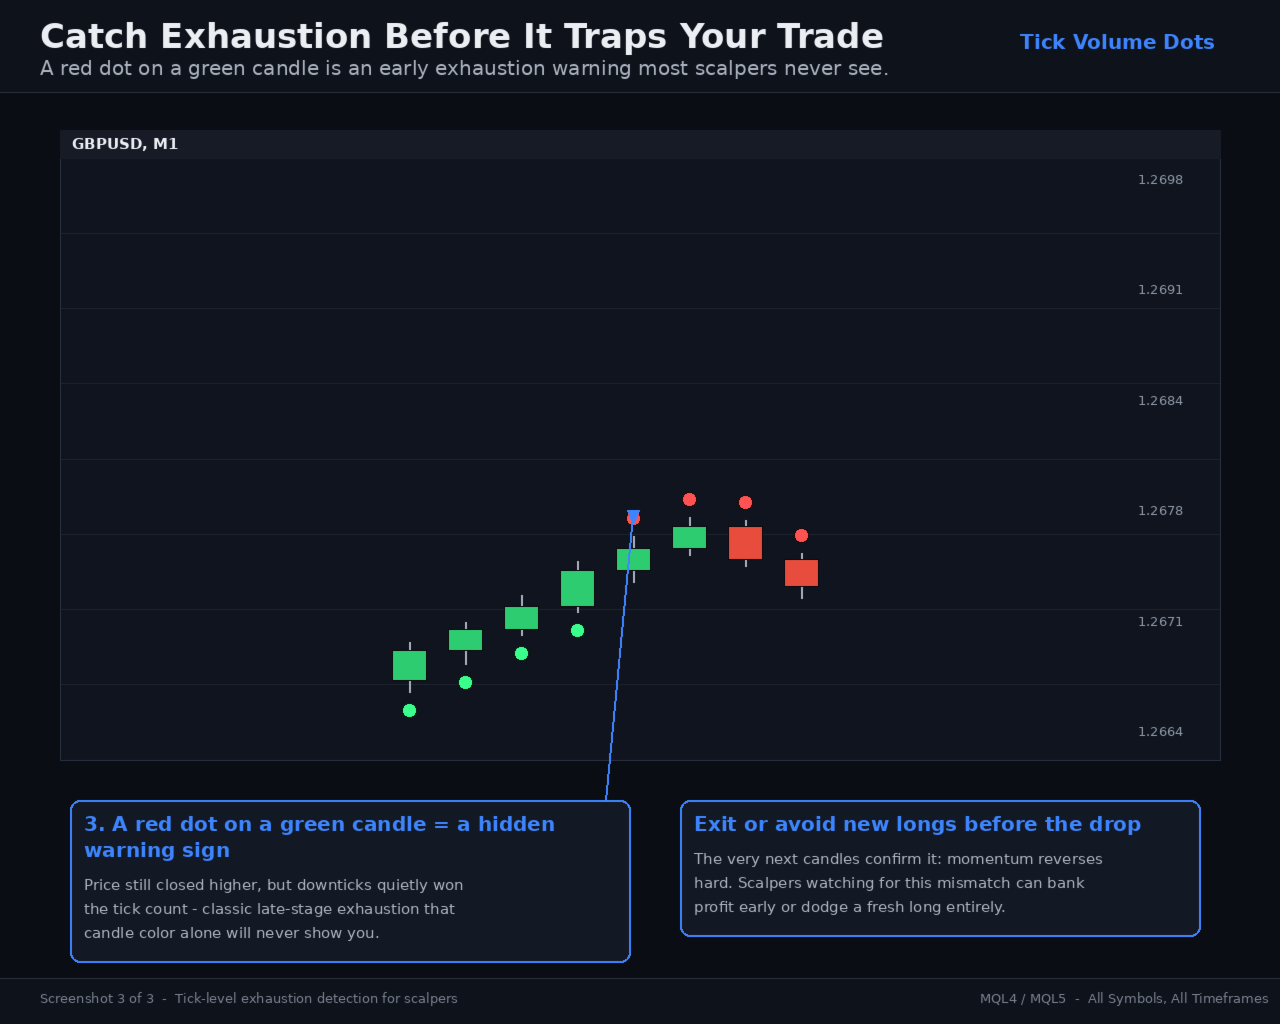
- "Catch Exhaustion Before It Traps Your Trade" — a red dot printing on a green candle flags sellers quietly winning the tick fight even while price still closes up — an early exhaustion warning.
- Get Risk Tool. Template .
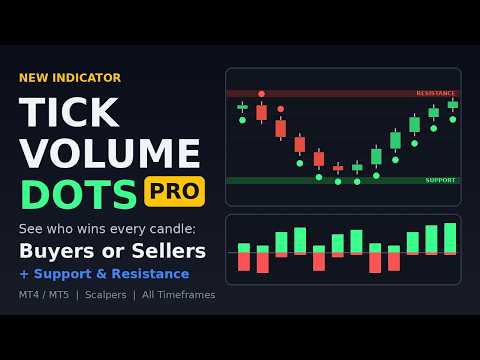
Tick Volume Dots reads the real tick flow behind every candle and shows you who's actually in control — buyers or sellers — the moment the candle closes.
- Counts every uptick and downtick that forms each candle
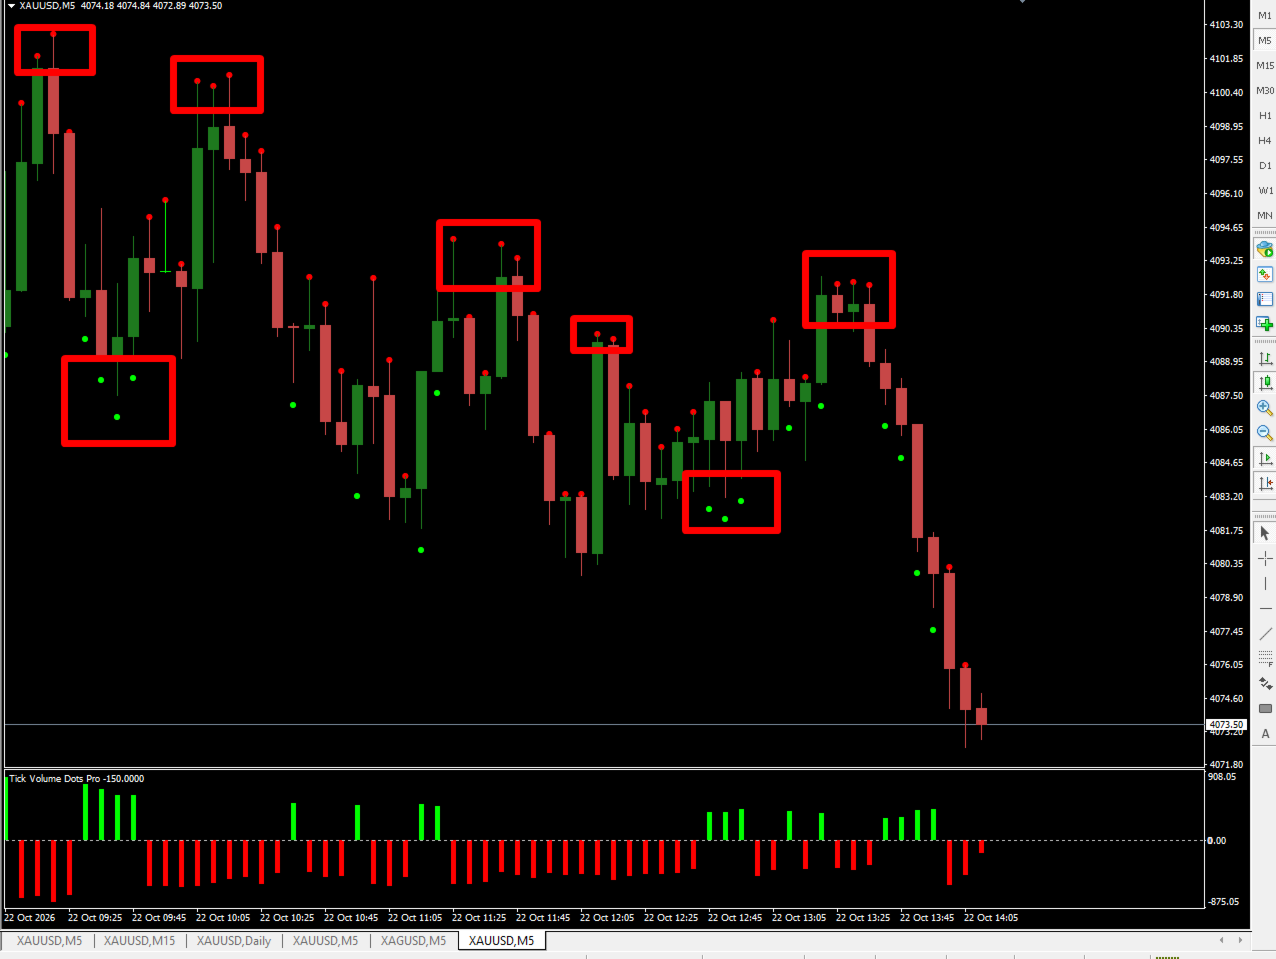
- Plots a small green dot below the candle when upticks dominate
- Plots a small red dot above the candle when downticks dominate
- Dot color, size, and offset are fully customizable from the input settings
- Optional companion subwindow histogram (Show/Hide) displays the summed upticks (green) and downticks (red) per candle, similar to a classic tick-volume panel
- Lightweight, non-repainting on closed candles, works on any symbol and timeframe
-
Features
- Green dot below the candle when upticks beat downticks.
- Red dot above the candle when downticks beat upticks.
- Histogram window (optional): green bars above zero are the sum of upticks, red bars below zero are the sum of downticks.
- Show/Hide inputs for the dots and the histogram, and all colors, dot size and distance are changeable.
- Data is saved to a file, so the dots and histogram survive a chart refresh, a timeframe change or a terminal restart.
- Works on any symbol and timeframe. Dots appear only on closed candles and are not redrawn afterward.
Using it as support and resistance
The indicator does not draw levels, but the dots show where buyers or sellers were really active, and those areas often behave like support and resistance.
- Support (demand) zones: when green dots keep appearing under candles around the same price, buyers are repeatedly absorbing selling there. Watch that area as support on the next retest.
- Resistance (supply) zones: when red dots keep appearing above candles around the same price, sellers are repeatedly capping price there. Watch that area as resistance.
- Zone strength: tall histogram bars confirm the zone is being actively defended, while small or mixed bars mean it is weak.
- Zone failure: a dot that flips color at a known level, such as a red dot where green dots used to appear, is an early warning that the level may break.
Treat these as zones to watch, not exact lines, and confirm with your own strategy and risk management.
Note: MetaTrader keeps no historical tick data, so counting starts when the indicator is attached and runs only while the terminal is open. The dots and histogram will therefore be empty for candles that formed before you attached it.