Abnormal OHLC Candle Detector
- 지표
- 버전: 1.0
- 활성화: 5

Abnormal OHLC Candle Detector - Spot candles that don't build the way they should.
How It Is Used :
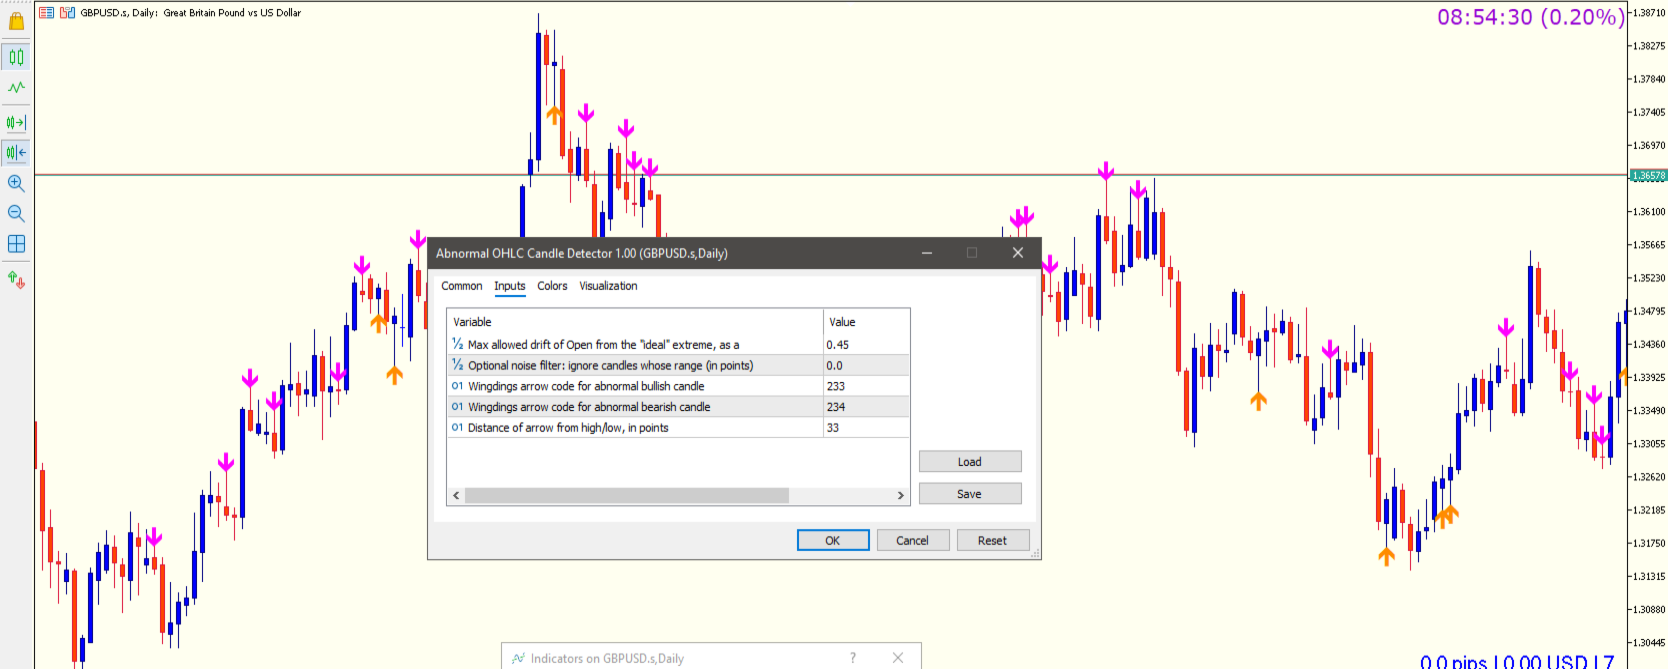
ABNORMAL OHLC CANDLE DETECTOR flags the candles that break this pattern — a bullish candle that opens well above its low, or a bearish candle that opens well below its high — before finishing in that direction anyway.
These candles carry a wick against their own move, often signaling that price was rejected from the opposite side before buyers or sellers regained control. This kind of build-up commonly shows up around exhaustion points, liquidity grabs, and potential reversal zones.
The indicator plots a simple arrow directly on the chart the moment an abnormal candle closes — no repainting, no lag, works on any symbol and any timeframe.
Key Features
- Pure price-action logic — based only on OHLC structure, no repainting or look-ahead
- Adjustable sensitivity — control exactly how much "wrong-side" drift is tolerated before a candle counts as abnormal
- Noise filtering built in
- Ignores weak-bodied / indecision candles (dojis) that would otherwise produce false signals
- Clear visual output — distinct arrow colors for abnormal bullish vs. abnormal bearish build-up
- Lightweight — minimal CPU usage, safe to run on multiple charts simultaneously
- Fully customizable — every threshold, filter, and arrow style is exposed as an input