Institucional Trade
- 지표
- 버전: 1.0
- 활성화: 5

How to Use the Indicator (Best performance: 5 minutes)
It displays two signals on the chart:
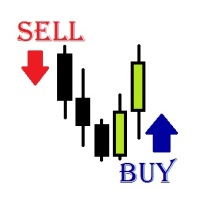
- BUY, in green: price pierced the low of the last 4 candles and closed back above it. This is a false breakdown that trapped the sellers → possible bullish reversal.
- SELL, in red: price pierced the high of the last 4 candles and closed back below it. This is a false breakout that trapped the buyers → possible bearish reversal.
A signal only appears when three conditions line up: the Wyckoff pattern (a false breakout that fails and reverses), volume confirmation (above-average volume and genuine absorption on the preceding candle), and a healthy position relative to VWAP (with room to run ahead). It doesn't flag just any reversal — it flags the ones with an institutional footprint behind them.
How to trade it: it's a decision-making tool, not a robot. Green signal → you evaluate a buy; red → a sell. Use the extreme of the signal candle (the low of the green candle or the high of the red candle) as your stop reference. Target and position size are set by you, according to your own management.
Where it performs best: liquid instruments and higher-flow sessions, especially when the signal coincides with a technical absorption level. It works on futures, stocks and crypto.
Important: the indicator tells you WHERE to look for entries. The final decision — to enter, to exit, how much to risk — is yours. Always trade with risk management.