GZ Structure Matrix
- 지표
- 버전: 1.0
- 활성화: 5

GZ Structure Matrix
GZ Structure Matrix is a professional MetaTrader 5 custom indicator designed for structured chart analysis and visual decision support.
This indicator helps traders read market conditions directly on the chart through market structure mapping, source zones, liquidity context, gap detection, dashboard summaries, and alert support. It is built for traders who want a clean visual framework to monitor trend condition, structure development, and potential reaction areas without converting the tool into an Expert Advisor or auto-trading system.
Main Features
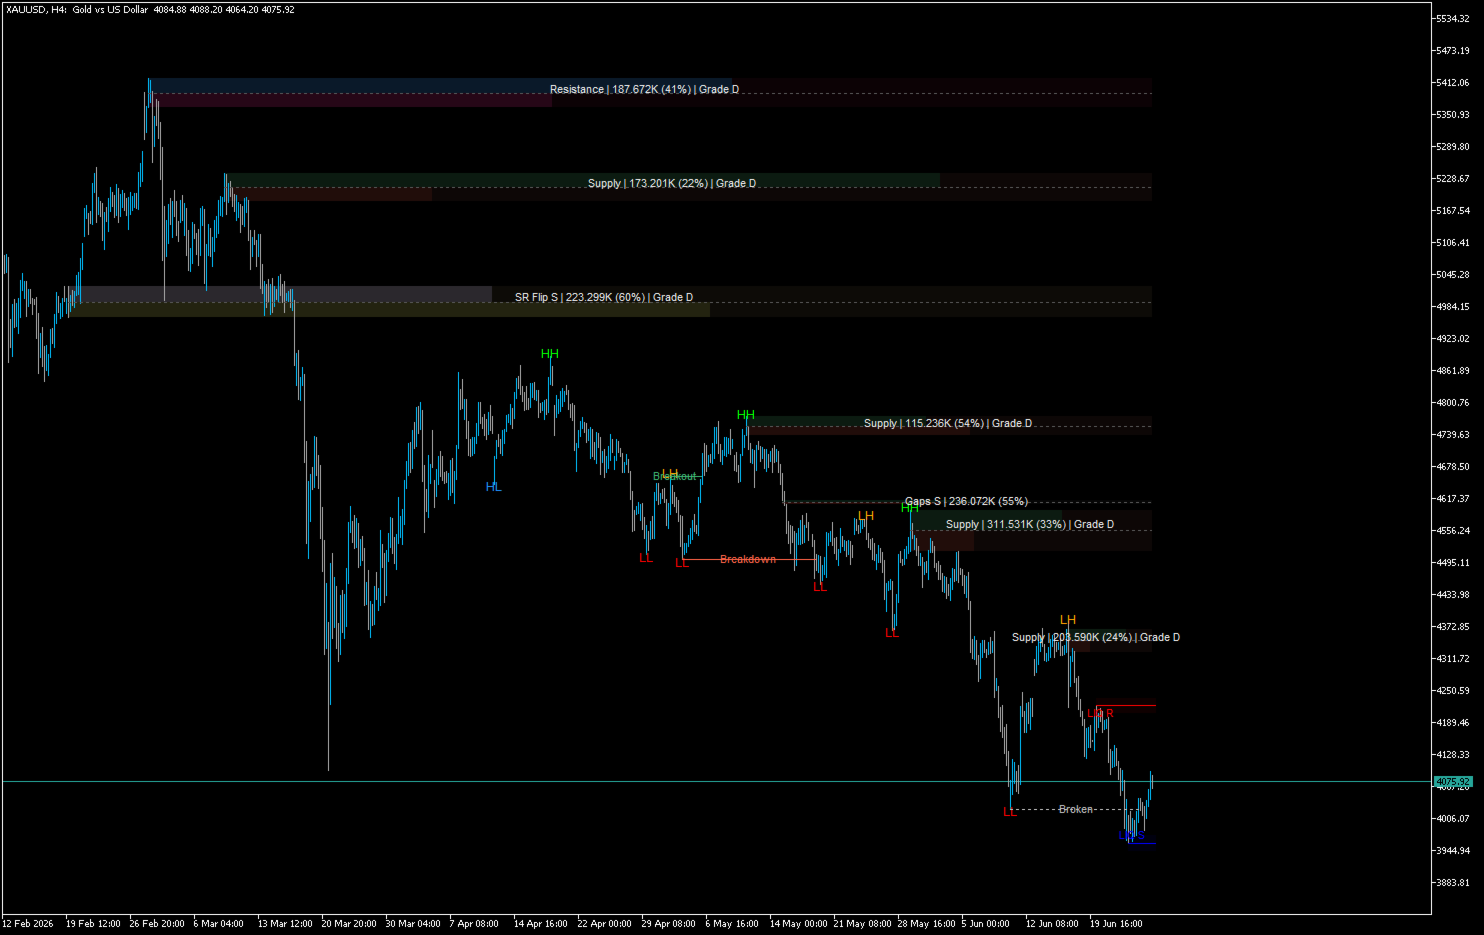
- Market structure visualization with swing-based labels:
HH, HL, LH, LL, Breakout, Breakdown, and Broken
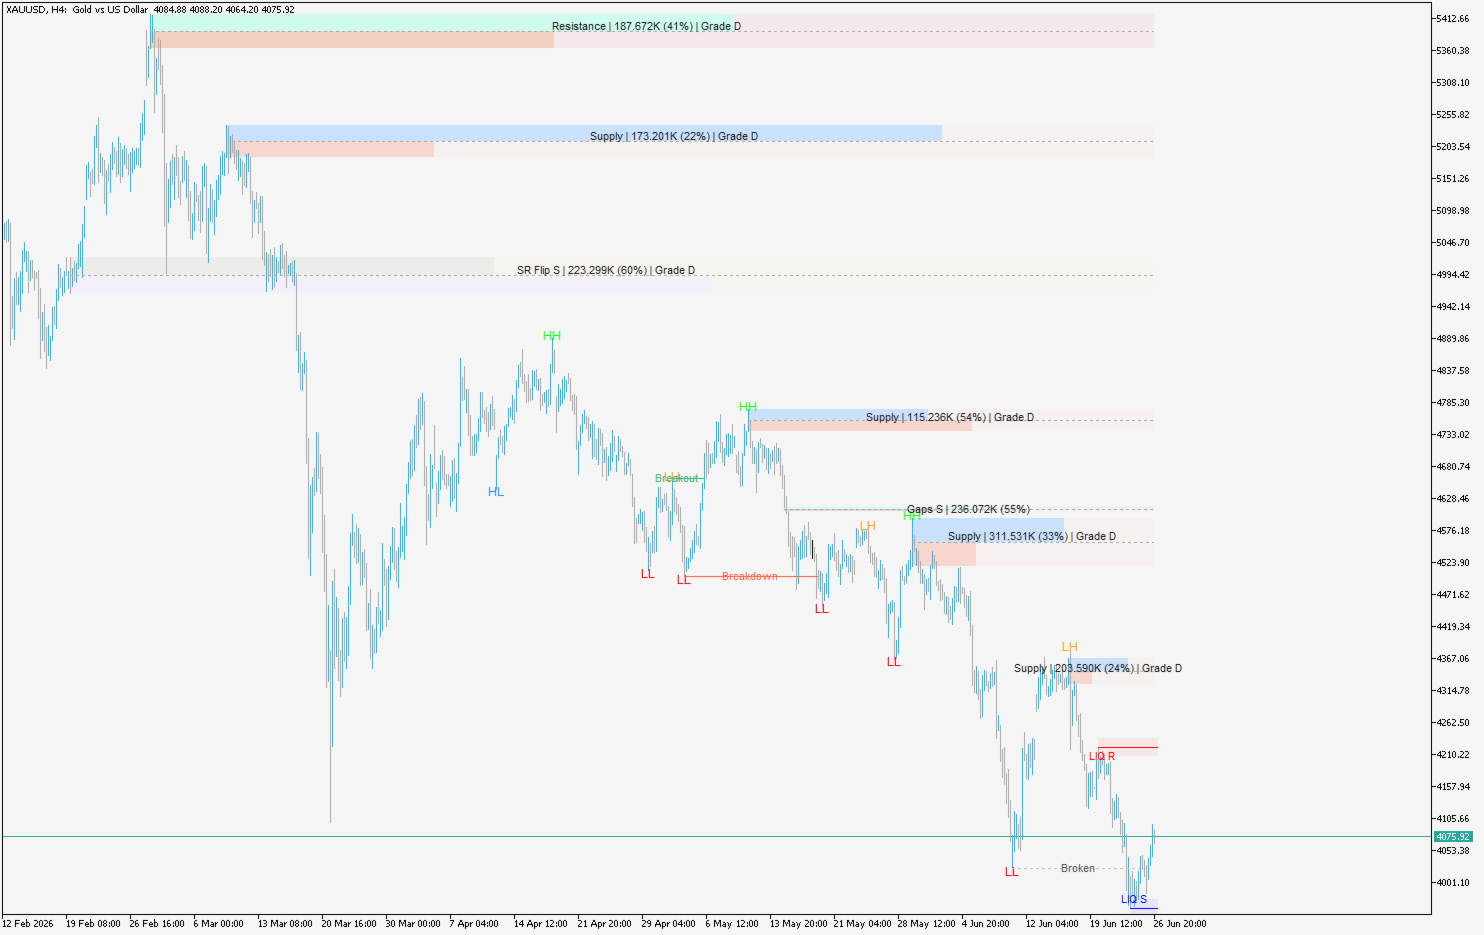
- Source zone visualization:
Support, Resistance, Supply, Demand, SR Flip S, and SR Flip B
- Gap and liquidity context:
Gap zones and liquidity references such as LIQ R and LIQ S
- Main dashboard summary:
Displays a compact structured overview of current market condition, bias, structure state, source context, liquidity, gaps, and other analytical elements
- Signal Matrix panel:
Displays a structured readout of signal condition, decision status, readiness, source alignment, plan, entry context, SL/TP context, quality, and risk information
- Multi-context analysis support:
Designed to assist users in reading chart condition with a broader contextual view, including higher-structure awareness and internal chart development
- Alert support:
Built-in alert text for important analytical events and signal-related conditions
- Chart-based workflow:
All output is visual and displayed directly on the chart for easier monitoring and faster interpretation
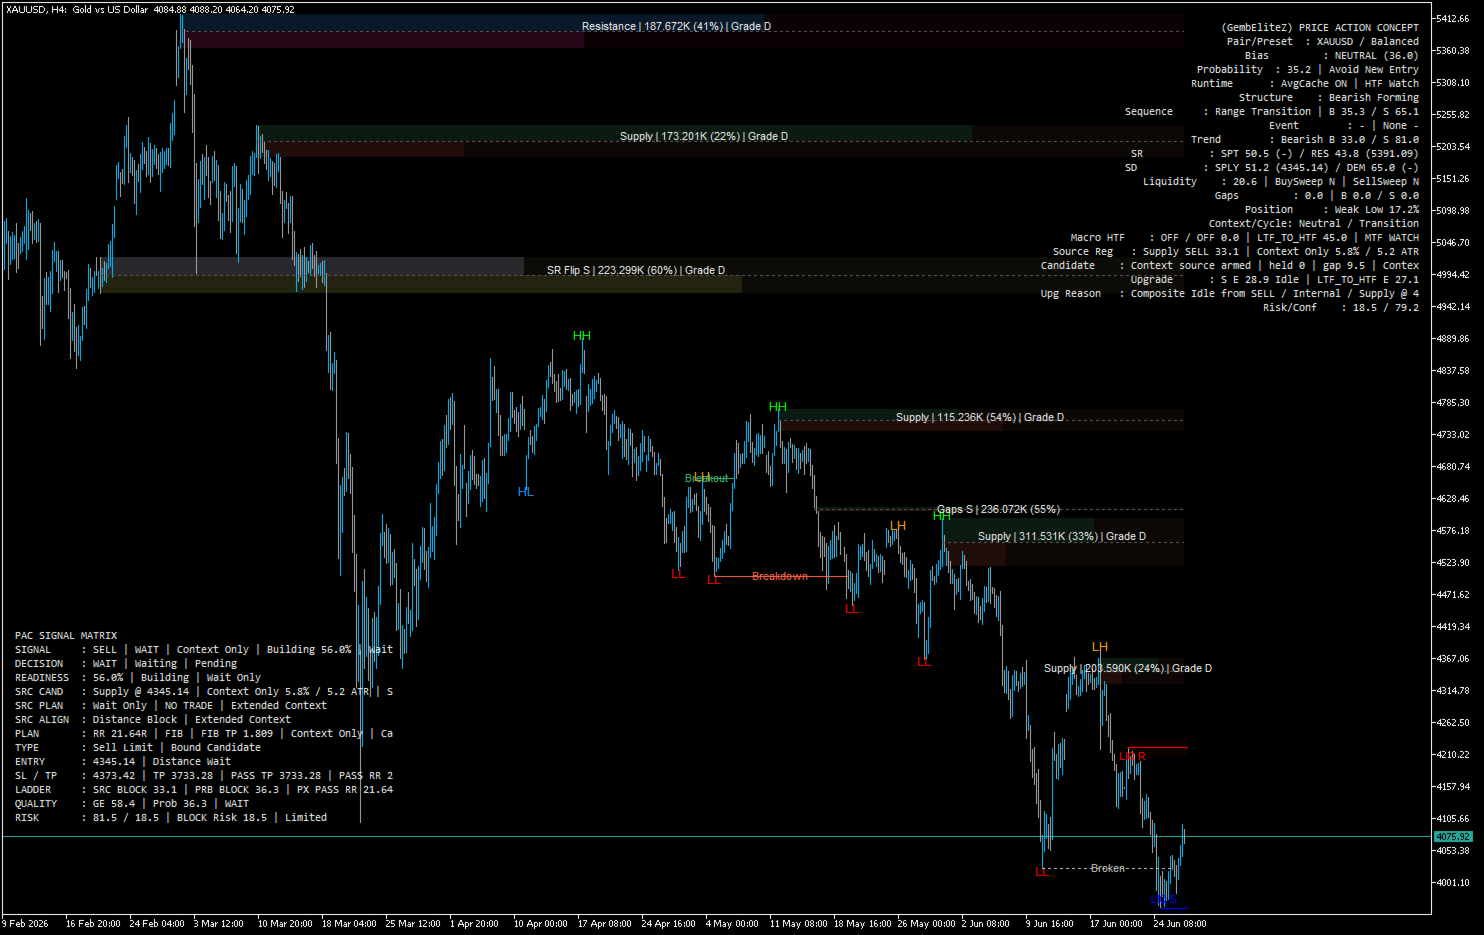
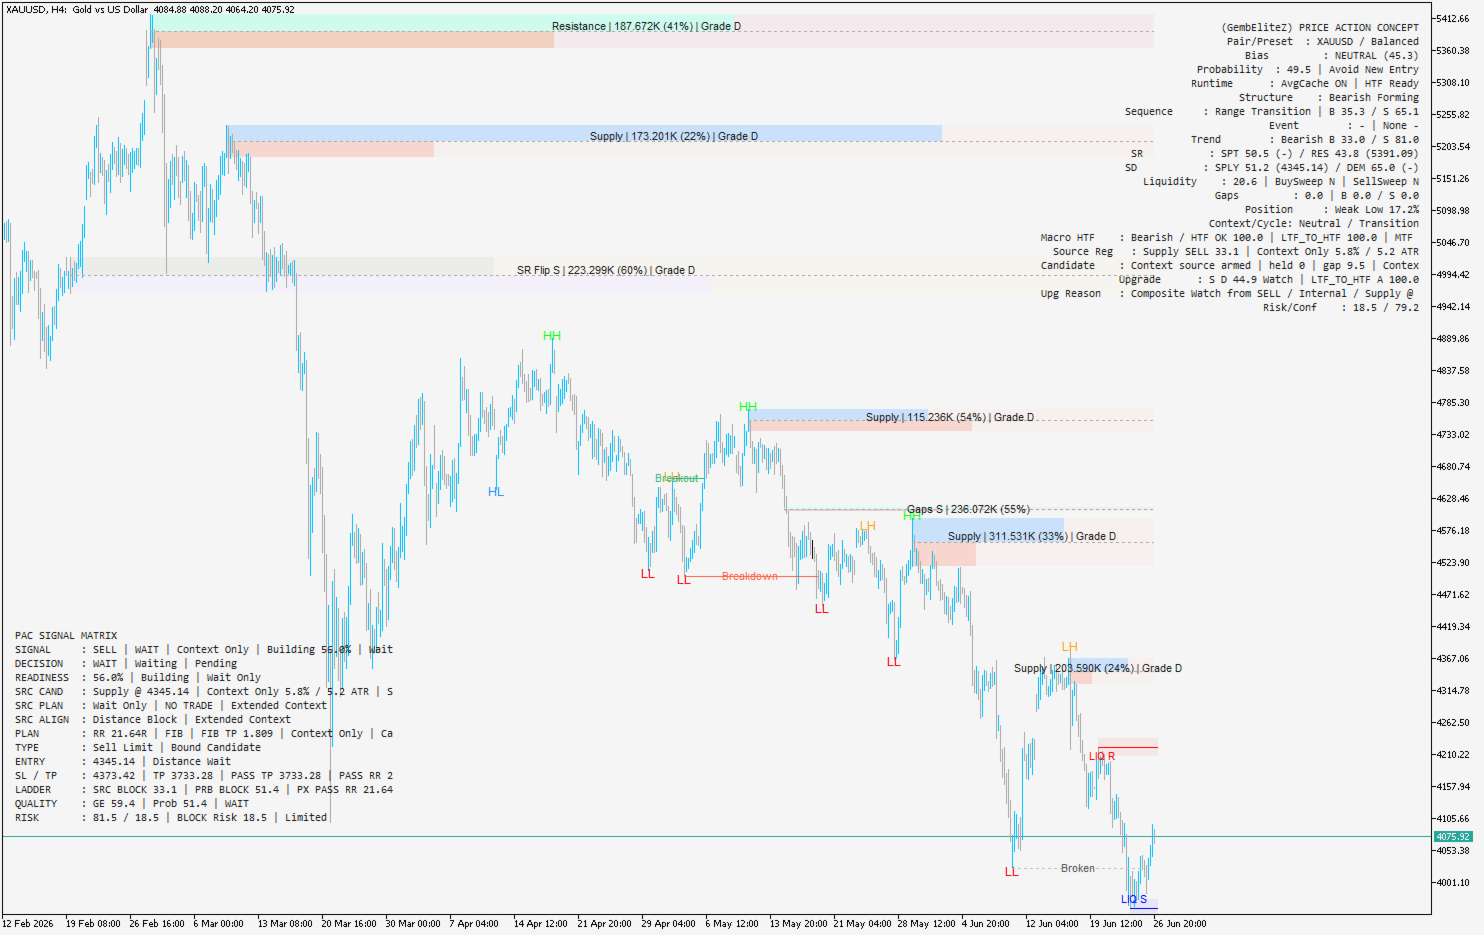
Dashboard Explanation
The main dashboard is designed to provide a quick overview of chart condition in a clean and structured layout.
It summarizes important analytical information such as:
- Pair / preset context
- Bias
- Probability
- Structure
- Trend
- Zones
- Liquidity
- Gaps
- Position
- Context / cycle
- Source registry
- Candidate state
- Upgrade reason
- Risk / confidence
This makes it easier to evaluate chart condition without manually checking every visual element one by one.
Signal Matrix Explanation
The Signal Matrix is a visual decision-support panel that helps organize the current trading context into a more readable format.
It can display information related to:
- Signal state
- Decision state
- Readiness
- Source candidate
- Source plan
- Source alignment
- Plan
- Entry type
- Entry level
- SL / TP context
- Ladder / block context
- Quality
- Risk
The purpose of this panel is to help the trader read the setup in a structured way. It is not an auto-trading engine and it does not place trades.
Alerts
The indicator includes alert support for selected analytical events and signal-related conditions.
Alerts are intended to help the user stay informed when the chart reaches specific structure or zone-related conditions. Alert messages are designed to stay aligned with the visual output on the chart.
Recommended Usage
GZ Structure Matrix is best used as a visual analytical tool for traders who want to:
- Monitor market structure development
- Identify potential support, resistance, supply, and demand areas
- Observe liquidity-related context
- Read chart condition through a structured dashboard
- Keep decision support information visible on the chart
- Use alerts as an additional monitoring tool
It can be used on multiple symbols and timeframes depending on the trader’s workflow and chart preference.
For best interpretation, users should combine the indicator output with their own trading plan, risk management, and chart-reading process.
Important Notes
- This product is a custom indicator, not an Expert Advisor
- It does not open, manage, or close trades
- It is intended for analysis and decision support only
- Visual output may vary depending on symbol, timeframe, broker data, and available history
Risk Disclaimer
Trading involves risk.
This indicator does not guarantee profit, winning trades, or future performance. It is an analytical tool created to support chart interpretation. Users remain fully responsible for their own trading decisions, entry selection, position sizing, and risk management.