RCI 3Lines

RCI 3Lines — Rank Correlation Index with Three Periods

Overview

RCI 3Lines is a powerful momentum and trend indicator based on the Rank Correlation Index (RCI), a Japanese technical analysis tool widely used in Asian markets. It plots three RCI lines simultaneously — Short, Middle, and Long — allowing traders to identify trend direction, momentum shifts, and overbought/oversold conditions across multiple timeframes in a single window.

Unlike RSI or Stochastic, RCI measures the correlation between time rank and price rank using Spearman's Rank Correlation Coefficient. This makes it highly sensitive to trend acceleration and deceleration, while remaining smooth enough to filter market noise.

How RCI Works

RCI is calculated using Spearman's formula:

RCI = { 1 - (6 × Σd²) / (n × (n² - 1)) } × 100

Where:

  • n = period length
  • d = difference between time rank and price rank
  • Time rank: most recent bar = rank 1, oldest bar = rank n
  • Price rank: highest price = rank 1, lowest price = rank n

The result oscillates between -100 and +100, with 0 as the centerline.

Three Lines — Three Perspectives

Line Default Period Purpose
Short 10 Fast signal — early trend detection
Middle 30 Medium signal — trend confirmation
Long 50 Slow signal — overall trend direction

Reading all three together gives a complete picture of market momentum:

  • All three above 0 → Strong bullish trend
  • All three below 0 → Strong bearish trend
  • Short crosses above Middle → Early bullish signal
  • Short crosses below Middle → Early bearish signal
  • Divergence between Short and Long → Trend weakening

Key Levels

Level Meaning
+80 Overbought zone — consider taking profits on longs
0 Centerline — trend neutral zone
-80 Oversold zone — consider taking profits on shorts

When the Short RCI exits the overbought (+80) or oversold (-80) zone, it often signals a potential reversal.

Trading Signals

Trend Following

  • Enter long when Short and Middle RCI cross above 0 while Long RCI is rising
  • Enter short when Short and Middle RCI cross below 0 while Long RCI is falling

Reversal

  • Look for Short RCI reversing from +80/-80 zone
  • Strongest signals occur when all three lines reverse simultaneously from extreme levels

Divergence

  • If price makes a new high but Short RCI makes a lower high → bearish divergence
  • If price makes a new low but Short RCI makes a higher low → bullish divergence

Input Parameters

Parameter Default Description
Short Period 10 Period for the fast RCI line
Middle Period 30 Period for the medium RCI line
Long Period 50 Period for the slow RCI line
Price Close Applied price source
Upper Band +80 Overbought level
Lower Band -80 Oversold level
Show Levels true Show/hide horizontal levels
Short Color Blue Color for Short RCI line
Middle Color Red Color for Middle RCI line
Long Color Green Color for Long RCI line

Recommended Settings

Market Condition Short Middle Long
Scalping (M1-M5) 5 14 26
Day Trading (M15-H1) 10 30 50
Swing Trading (H4-D1) 9 26 52

Comparison with RSI

Feature RSI RCI
Calculation basis Price change magnitude Price rank vs time rank
Sensitivity Medium High
Smoothness Smooth More responsive
Range 0 to 100 -100 to +100
Centerline 50 0
Origin Western TA Japanese TA

Why Use RCI 3Lines?

  •  Japanese market proven — widely used by professional Japanese traders
  •  Three timeframe view — see short, medium, and long-term momentum at once
  •  Clear centerline — 0 as the neutral zone is intuitive
  •  No repainting — all values are calculated on closed bars
  •  Fully customizable — periods, colors, and levels adjustable
  •  Works on all symbols and timeframes — Forex, indices, commodities, crypto

Installation

  1. Purchase and download the indicator
  2. The  .ex5  file will appear in Navigator → Indicators
  3. Drag and drop onto any chart
  4. Adjust input parameters as needed

Notes

  • RCI is most effective when used with price action or trend-following tools such as Moving Averages
  • During strong trending markets, the Long RCI may stay near +100 or -100 for extended periods — this is normal behavior
  • For best results, combine with support/resistance levels

For questions or support, please use the MQL5 comments section.


추천 제품
Currency Strength Meter is the easiest way to identify strong and weak currencies. This indicator shows the relative strength of 8 major currencies + Gold: AUD, CAD, CHF, EUR, GBP, JPY, NZD, USD, XAU. Gold symbol can be changed to other symbols like XAG, XAU etc. By default the strength value is normalised to the range from 0 to 100 for RSI algorithm: The value above 60 means strong currency; The value below 40 means weak currency; This indicator needs the history data of all 28 major currency
TouchGuard Alert – Advanced Price Alert & Notification Indicator for MetaTrader 5 (MT5) TouchGuard Alert is a fast, lightweight, and highly accurate price-touch Alert & Notification system designed for MetaTrader 4 (MT4) and MetaTrader 5 (MT5) . It automatically sends real-time Alerts, Pop-Up Alerts, Email Notifications, Push Notifications and early-warning notifications when price touches or approaches your chart objects. Key Features (High-Precision Alert & Notification System) Comprehensive P
Signal Strike
Murtadha Majid Jeyad Al-Khuzaie
Signal Strike is a professional trading indicator designed for MetaTrader 5 that delivers clear, high‑confidence entry signals directly on your chart. Built with advanced logic that combines trend, momentum, volatility, and volume confirmation, this tool helps traders identify precise BUY and SELL opportunities with confidence. Unlike generic indicators, Signal Strike is engineered to filter out indecision candles and weak setups. When conditions align, the indicator plots entry, stop loss, an
Every indicator has its advantages and disadvantages. Trending ones show good signals during a trend, but lag during a flat. Flat ones thrive in the flat, but die off as soon as a trend comes. All this would not be a problem, if it was easy to predict when a flat changes to a trend and when a trend changes to a flat, but in practice it is an extremely serious task. What if you develop such an algorithm, which could eliminate an indicator's flaws and enhance its strengths? What if such an algorit
표시기는 현재 시세를 작성하여 과거 시세와 비교할 수 있으며 이를 바탕으로 가격 변동을 예측합니다. 표시기에는 원하는 날짜로 빠르게 이동할 수 있는 텍스트 필드가 있습니다. 옵션: 기호 - 표시기가 표시할 기호 선택. SymbolPeriod - 지표가 데이터를 가져올 기간 선택. IndicatorColor - 표시기 색상. HorisontalShift - 지시자가 그린 따옴표를 지정된 막대 수만큼 이동합니다. Inverse - true는 인용 부호를 반대로, false - 원래 보기를 반전합니다. ChartVerticalShiftStep - 차트를 수직으로 이동합니다(키보드의 위/아래 화살표). 다음은 날짜를 입력할 수 있는 텍스트 필드의 설정으로, '엔터'를 누르면 즉시 이동할 수 있습니다.
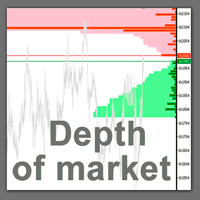
The professional tool of stock traders in now available on MetaTrader 5 . The Actual depth of market chart indicator visualizes the depth of market in the form of a histogram displayed on a chart, which refreshes in the real-time mode. Meet new updates according to user requests! Now Actual Depth of Market indicator displays the current ratio of volume of buy and sell requests (B/S ratio). It shows the share of volume of each type of requests in the entire flow of requests as well as the absolu
SlopeChannelB MT5
MIKHAIL VINOGRADOV
SlopeChannelB – 경사진 가격 이동 채널을 구축하는 기술 분석 도구로, 시장 현황을 평가하고 거래 신호를 찾는 데 독특한 기회를 제공합니다. 지표의 주요 특징: 경사진 가격 이동 채널 : 이 지표는 지지와 저항 수준을 시각화하는 데 도움을 주며, 이는 추세의 반전 또는 지속 가능성을 나타낼 수 있습니다. 다양한 선 색상 및 배경 강조 : 경사진 지지 및 저항 수준은 다양한 색상으로 표시되며, 채널 자체는 배경이 추가로 강조되어 차트의 시각적 분석을 단순화합니다. 선 계산을 위한 세 가지 옵션 : 지표는 회귀 분석을 사용하여 채널 라인을 구성합니다. 세 가지 방법 중 하나를 선택할 수 있습니다: Robust (기본값) – 이상치에 강한 방법입니다. OLS (최소제곱법) . Median (중앙값 계산) . 최적의 모델 선택 : SlopeChannelB는 다섯 가지 품질 기준의 분석을 기반으로 가장 적합한 채널 라인 변형을 자동으로 선택합니다. 품질 매개변수는 차트에
Quant Levels
Abdeljalil El Kedmiri
5 (1)
Quant Levels Indicator   is a premium component of the   Quantitative Trading Analysis Toolkit , designed to transform subjective trading into data-driven decision making. This advanced tool provides institutional-grade support and resistance analysis directly on your MT5 charts. " Please support our work by leaving a review ". As a thank-you gift , we’ll share a special template that helps you display signal trade history directly on your chart. Free indicator to visualize any MT5/MT4 signals i
FREE
Basic information. To perform its work, the indicator takes data on volumes from a lower timeframe, builds Market Profiles for a higher timeframe and a histogram for the current timeframe. The indicator starts in several stages. In this case, messages like: "Build Source & Target TF. Step: …" are output to the log. The process can be accelerated by changing the input parameter Milliseconds between steps - the initialization speed. The final value of this parameter is always individual and is set
Msm Currency Power Meter
Muhammad Sirazul Monir
MSM Currency Power Meter (MT5 Version) The MSM Currency Power Meter is a highly sophisticated, real-time multi-currency strength dashboard engineered exclusively for the MetaTrader 5 platform. This indicator eliminates market guesswork by visually decoding the true relative strength and weakness of the 8 major global currencies: EUR, GBP, AUD, NZD, USD, CAD, CHF, and JPY . Key Features & Mechanics: Real-Time Matrix Calculations: It monitors 16 core currency pairs simultaneously, analyzing cu
Ultimate Candle Patterns
Wojciech Daniel Knoff
Check out my TRADE PLANNER MT5 – strongly recommended to anticipate account scenarios before risking any money. This is a multi-symbol, multi-timeframe, table-based indicator for MetaTrader 5 that identifies 46 types of candlestick formations. Each formation has its own image for easier recognition. The indicator includes popular patterns such as Engulfing, Hammer, Three Line Strike, Piercing, and Doji-like candles. You can check the full list of patterns in the screenshots below. Also you can
RED ZONE Monitor Loss-Cut & Break-Even Risk Monitor for Averaging Traders (MT5) RED ZONE Monitor is a risk management indicator for traders who use averaging, scaling-in, or multiple open positions . It visually displays: The loss-cut (liquidation) risk zone The break-even price Based on current open positions, lots, and margin conditions This indicator does not provide entry signals. It does not promise profits. It shows where your account actually fails if price moves against you. What RED ZO
암호화폐 및 외환(Forex)용 " FORCE Index FLAT Detector " 지표는 효율적인 트레이딩 보조 도구입니다! 리페인팅(값 변경)이 발생하지 않습니다. MT5용으로 출시된 이 훌륭한 지표를 통해 트레이딩 방식을 한 단계 업그레이드해 보세요. - 차트상에서 가격의 횡보(Flat) 구간을 자동으로 표시합니다. - 횡보 감지 기능을 조절하는 'Flat sensitivity(횡보 민감도)' 매개변수가 포함되어 있습니다. - "FORCE Index FLAT Detector"는 프라이스 액션(Price Action) 기반 진입 시점을 확인하거나 다른 지표와 결합하여 활용할 수 있습니다. - 추세 추종 시스템에서 횡보 구간을 감지하여 해당 구간에서의 거래를 피하는 용도로 사용할 수 있습니다. - 횡보 구간의 경계에서 발생하는 반전(reversal)을 공략하는 스캘핑 매매에도 활용 가능합니다. - 표준 Force Index 오실레이터 대신 "FORCE Index FLAT Det
LT Easy Market
Thiago Duarte
5 (3)
LT Easy Market - 모든 시장을 정밀한 트레이딩 존으로 변화시키다 강한 추세 시장에서 거래하려다 길을 잃은 적이 있으신가요? 아니면 횡보(박스권) 구간에서 진입 시점이 명확히 보이지 않아 답답하셨나요? LT Easy Market은 이러한 고민을 해결하기 위해 개발되었습니다. 가격 움직임을 완전히 "정규화"하여 "영원히 횡보하는 듯한" 시각적 효과를 제공하므로, 과매수 및 과매도 극값을 수술과도 같은 정밀함으로 쉽게 포착할 수 있습니다. == 정규화의 마법 == 자산의 자연스러운 변동성 때문에 스트레스를 받는 대신, Easy Market은 스마트 알고리즘을 적용하여 모든 가격 움직임을 표준화된 스케일로 변환합니다. 그 결과, 시장이 추세 중이든 횡보 중이든 상관없이 박스권 및 조정 구간에서 명확한 진입 기회를 포착할 수 있습니다. == 주요 특징 == 100% 자동 정규화: 변동성을 고정되고 예측 가능한 스케일로 변환 극값 감지: 과매수(>70) 및 과매도(<30) 구간 식
Pulse Reversal Zones Pro는 MT5 트레이더가 깔끔한 실시간 대시보드를 통해 잠재적 반전 영역, 시장 소진, 진입 영역, 손절매/실패 예상, 추세 압력을 파악할 수 있도록 도와줍니다. 구매 전에 데모 버전을 다운로드하여 전략 테스터에서 테스트해 보세요. Pulse Reversal Zones Pro는 차트를 복잡하게 만들지 않고 잠재적인 시장 반전, 모멘텀 소진, 가격 반응 영역을 명확하게 파악하고자 하는 트레이더를 위해 개발되었습니다. 이 지표는 고급 모멘텀 및 스트레치 로직에서 영감을 받은 펄스 기반 반전 엔진을 사용합니다. 시장 움직임, 오실레이터 거리, EMA 편향, 제로 라인 위치, 신호 강도, 그리고 선택적으로 더 높은 시간대의 편향 간의 관계를 분석합니다. 이러한 조건이 충족되면 잠재적인 롱 또는 숏 펄스 기회를 차트에 직접 표시합니다. 단순한 화살표 지표와 달리 Pulse Reversal Zones Pro는 완벽한 시각적 거래 프레임워크를 제공합
DoctorEdge V-LINE (Pump it & Dump it) Strategy Pro Confirms trend direction using smart momentum logic and key price behavior How It Works DoctorEdge V-LINE is a smart visual indicator designed to detect trend impulses and confirm their strength based on how price reacts around certain dynamic zones. Buy Trend: When price reaches level -20 , the line turns green , signaling a potential buy . If price breaks above level 0 and the line stays green, the uptrend is confirmed . If price doe
VR Grid Mt5
Vladimir Pastushak
3.25 (8)
VR 그리드 표시기는 사용자 정의 설정으로 그래픽 그리드를 생성하도록 설계 되었습니다. 표준 그리드 와 달리 VR 그리드는 원형 레벨 을 구축하는 데 사용됩니다. 사용자의 선택에 따라 라운드 수준 사이의 단계는 임의적일 수 있습니다. 또한 VR Grid는 다른 인디케이터나 유틸리티와는 달리 기간이 바뀌거나 단말기를 재부팅해도 그리드의 위치 를 유지합니다. 설정, 세트 파일, 데모 버전, 지침, 문제 해결 등은 다음에서 얻을 수 있습니다. [블로그] 다음에서 리뷰를 읽거나 작성할 수 있습니다. [링크] 버전 [MetaTrader 4] 수직 수준 은 실제 시간 간격을 기준으로 하며 누락 또는 존재하지 않는 기간은 무시 합니다. 따라서 레벨 사이의 단계는 사용자가 선택한 값과 엄격하게 일치합니다. VR 그리드 표시기를 사용할 때 트레이더는 모든 수준에서 스타일 , 수직선 및 수평선의 색상 및 두께를 변경할 수 있습니다. 이를 통해 금융 상품의 라운드 수준 을 제어할 수 있습니다. 라운
FREE
FourAverageMT5
Mikhail Sergeev
5 (2)
포라 평균은 트렌드 탐지의 새로운 단어입니다. 정보 기술의 발전과 많은 참가자들로 인해 금융 시장은 구식 지표에 의한 분석에 덜 민감해지고 있습니다. 이동 평균이나 정작과 같은 기존의 기술적 분석 도구는 순수한 형태로 추세의 방향이나 역전 방향을 결정할 수 없습니다. 하나의 지표가 14 년의 역사를 기반으로 매개 변수를 변경하지 않고 미래 가격의 올바른 방향을 나타낼 수 있습니까? 동시에,옆으로 시장의 움직임과 적절성을 잃지 않는다? 답변:예,할 수 있습니다. 우리 팀은 변화하는 시장 상황에 적응하기 위해 상당히 강력하고 효과적인 메커니즘을 가진 지표를 개발했습니다. 2025 년에 선도적 인 추세 지표"평균"은 새로운 개발 단계에 진입하고 있습니다. 현대 암호 화폐 및 주식 시장은이 지표를 위해 만들어진 것 같습니다. 고유 한 스무딩 공식을 사용하면 통화 쌍 또는 기타 악기의 모든 기능에 대한 표시기를 조정(패턴 식별)할 수 있습니다. 지금,이익을 만들기 위해,하나의 지표는 충분하다
Meet the Tweezer Hunter, an essential tool for every Forex trader looking to make accurate, trend-following trades. This powerful, intuitive indicator helps traders spot potential trend reversals before they happen, providing a significant advantage in the fast-paced world of Forex trading. The Tweezer Hunter is more than your average tweezer candle indicator; it's designed with a built-in trend identification feature that accurately detects whether the market is bearish or bullish. By integrat
SQN Max indicator for MT5 by ITC
Renaud Herve Francois Candel
Sqn Max Indicator Sqn Max is an exclusive indicator to trade the market with high effectiveness. The indicator is based on price action, volatility and trend. This indicator is as simple as possible but not too simple. The indicator can generate alerts to ease the trading process. You don't have to stay all day in front of your screen. The indicator can be used with any class of assets and with any time frame. It is possible to achieve better results trading our list of selected assets. We achi
Magic Channel Scalper 는 MetaTrader 5 터미널의 채널 표시기입니다. 이 지표를 사용하면 가장 가능성이 높은 추세 반전 지점을 찾을 수 있습니다. 대부분의 채널 표시기와 달리 Magic Channel Scalper는 다시 그려지지 않습니다. 경고 시스템(경고, 이메일 및 푸시 알림)은 여러 거래 상품을 동시에 모니터링하는 데 도움이 됩니다. 차트에 표시기를 연결하면 신호가 나타나면 경고가 트리거됩니다. 우리의 경고 시스템을 사용하면 단 한 번의 포지션 개시 신호도 놓치지 않을 것입니다! 장점 스캘핑에 딱 맞습니다. 추세 반전을 식별하는 데 탁월합니다. 초보자와 숙련된 거래자에게 적합합니다. 모든 시간대에 작동합니다. 표시기가 다시 그려지지 않습니다. 유연한 경고 시스템. 차트 사용자 정의(선의 크기 및 색상) 권장 기호 USDCAD, EURUSD, USDCHF, AUDNZD, AUDCAD, GOLD. 사용에 대한 권장 사항 가격이 표시기의
Galaxy Elegance
Gezani Paulus Nkuna
G.X.L (GALAXY ELEGANCE) Product Overview G.X.L is an automated trading robot for MetaTrader 5 that operates based on price action analysis. The system processes real-time market data to identify trading opportunities. It provides information and recommendations aligned with user-defined trading preferences. Core Functionality The robot analyzes price movements without relying on traditional lagging indicators. It focuses on current market structure, including swing points and fractals, to determ
Volume Profile Pro 보조지표 이 지표는 "어떤 가격대에서 가장 많은 거래가 일어났는지" 분석하는 Volume Profile Pro 도구입니다. 다음과 같은 특별한 기능이 있습니다: 표시 모드 (Display Modes) Volume Profile (일반): 각 가격대의 총 거래량(Total Volume)을 표시하여 중요한 지지 및 저항 구간을 보여줍니다. Delta / Money Flow: 매수세와 매도세(Buy vs Sell)의 "차이(Delta)"를 표시하여 해당 가격대에서 누가 시장을 주도하는지 보여줍니다. 거래량(Volume) 또는 자금 흐름(Money Flow)으로 선택하여 볼 수 있습니다. 계산 모드 (Calculation Modes) Pro 버전의 강점은 기간 설정의 유연성입니다: Fixed Mode (고정 모드): 과거 캔들 개수를 고정하여 설정합니다 (예: 최근 100개 캔들). Dynamic Mode (핵심 기능): 수직선(Vertical Line)이
Mega Spikes Max
Niccyril Chirindo
2.33 (3)
Mega Spikes Max is a specialized indicator for Boom and Crash synthetic indices that generates trading signals with automatic alert notifications. Features The indicator analyzes market conditions using proprietary algorithms and displays buy/sell arrows directly on the chart. It works specifically with Boom and Crash indices on M5 timeframe. Signal generation combines multiple technical analysis methods to identify potential trading opportunities. The system provides two TP levels and SL calcu
Honest Breakeven
Konstantin Gruzdev
Indicator gives an honest picture of changes in breakeven levels for transactions throughout the account history, and not just for open positions (screenshot 1). Accurate calculation of levels, taking into account accrued commissions, fees and swaps, allows you to evaluate trading results both visually and in Expert Advisors (screenshot 2). For Expert Advisors, the indicator in its standard form provides not only the break-even level, but also the number of positions, volume, and all additional
POC Delta Order Blocks is a rule-based order block and volume-delta indicator designed to help traders clearly understand where real trading activity happened and how price reacts around those zones . Instead of drawing generic candle-based blocks, this indicator uses a Point of Control (POC) approach to identify the most actively traded price level between a swing high/low and a confirmed Break of Structure (BOS). The order block is then anchored to the earliest valid candle that interacted wit
Kiwi Forex Strength Scanner Kiwi Forex Strength Scanner MT5 is a free multi-timeframe Forex strength and market-structure indicator designed to help MetaTrader 5 traders quickly identify strong currencies, weak currencies, and higher-quality currency-pair opportunities. Instead of looking at a single indicator or timeframe, Kiwi Forex Strength Scanner combines currency strength, multi-timeframe analysis, trend alignment and higher-timeframe market structure into one easy-to-read dashboard. The o
FREE
NovaTac Fixed Volume Profile
Okechukwu Maxwell Okeke
NovaTac Fixed Volume Profile displays configurable volume-at-price profiles with POC, value area, nodes and closed-bar context alerts. Overview NovaTac Precision Volume Profile is an analytical chart indicator for MetaTrader 5. It organizes available volume across price rows and displays the areas where trading activity was concentrated within a selected range. The indicator does not open, modify or close trades. It is intended to support chart analysis and discretionary decision-making. Pr
This indicator provides an original mix of WPR, VSA, and volume delta. It shows ratio of buy/sell volumes scaled on 100% range based on total volume change for a selected period. The convetional VSA (Volume Spread Analysis) studies interconnections of price action and volume change in absolute values, whereas WPR (Williams Percent Range) offers a convenient approach of price moves normalization into the fixed percentage metric: 0 - 100%. Hence overbough and oversold states are easily spotted. N
Haven Fibonacci Volume Profiles — 자동 시장 범위 분석기 Haven Fibonacci Volume Profiles 를 소개합니다. 이는 시장 분석을 한 차원 높여주는 강력한 도구입니다. 이 지표는 중요한 피봇 포인트를 기반으로 구축된 핵심 가격 범위를 자동으로 식별하고, 각 범위에 상세한 볼륨 프로파일과 피보나치 레벨을 겹쳐 표시합니다. 이를 통해 트레이더는 유동성이 어디에 집중되어 있는지, 그리고 진정한 지지 및 저항 레벨이 어디에 위치하는지 즉시 파악할 수 있습니다. 다른 제품 -> 여기 . 어떤 범위가 유효한지 더 이상 추측할 필요가 없습니다. 이 지표는 과거 및 현재 가격 범위를 모두 표시하여 시장 상황에 대한 완전한 이해를 제공하며, 모든 복잡한 작업을 대신 처리해 줍니다. 주요 지표 기능 자동 범위 감지: 지표가 중요한 고점과 저점(피봇)을 자동으로 찾아 그 사이에 가격 범위를 구성합니다. 상세한 볼륨 프로파일: 각 범위에 대해 볼륨 프로파일이
이 제품의 구매자들이 또한 구매함
이 제품은 2026년 시장에 맞게 업데이트되었으며 최신 MT5 빌드에 최적화되었습니다. 가격 업데이트 안내: Smart Trend Trading System은 현재 $99 에 제공됩니다. 다음 30회 구매 후 가격은 $199 로 인상됩니다. 특별 혜택: Smart Trend Trading System 구매 후 저에게 개인 메시지를 보내시면 Smart Universal EA를 무료 로 받을 수 있으며, Smart Trend 신호를 자동 거래로 전환할 수 있습니다. Smart Trend Trading System은 리페인트 없음, 재그리기 없음, 지연 없음의 완전한 트레이딩 시스템으로, 더 깨끗한 신호, 더 나은 추세 방향, 그리고 더 체계적인 시장 거래 방식을 원하는 트레이더를 위해 제작되었습니다.   [User Manual]   ,  [PDF]  ,   [Installation manual]   and  [Online course] 이 시스템은 추세 감지, 반전 구간, Smart
Trend Sniper X
Sarvarbek Abduvoxobov
5 (11)
Trend Sniper X 는 MetaTrader 5용 멀티 타임프레임 추세 추종 지표로, 트레이더가 추세 방향과 잠재적 반전 지점을 명확하고 정확하게 식별하도록 돕습니다. 가격 정보: 현재 가격은 프로모션 가격이며, 향후 업데이트 및 새로운 기능 출시 시 변경될 수 있습니다. Code2Profit 채널 멀티 타임프레임 분석으로 시장을 마스터하세요! Trend Sniper X로 승률을 극대화하는 방법: 핵심 규칙 및 세션 팁 기술 사양 플랫폼 MetaTrader 5 지표 유형 멀티 타임프레임 추세 지표 운용 타임프레임 모든 차트 타임프레임 지원, 독립적으로 선택 가능한 상위 타임프레임(M1–MN1) 주요 상품 외환, 금(XAUUSD) 및 기타 CFD 권장 계좌 모든 계좌 유형 시각화 색상별 추세 캔들(매수/매도/약세/변경) + 매수/매도 화살표 추가 모듈 세션 시장 박스(시드니, 도쿄, 런던, 뉴욕) 주요 기능 멀티 타임프레임 추세 분석: 상위 타임프레임의 추세 방향을 현재 차트에
Welcome to ENTRY IN THE ZONE AND SMC MULTI TIMEFRAME Entry In The Zone and SMC Multi Timeframe is a real-time market analysis tool based on Smart Money Concepts (SMC), designed to analyze market structure, price direction, and key trading zones. It supports both Single-Timeframe Analysis and Multi-Timeframe Analysis, providing a clearer view of the overall market structure across multiple timeframes, with real-time BUY / SELL signals that do not repaint. It is designed to help filter trading opp
SuperScalp Pro
Van Minh Nguyen
4.61 (31)
SuperScalp Pro – 전문 멀티 레이어 컨플루언스 스캘핑 시스템 SuperScalp Pro 는 다중 컨플루언스를 기반으로 한 전문 스캘핑 시스템으로, 트레이더가 더 높은 확률의 매매 기회를 식별할 수 있도록 설계되었습니다. 명확한 진입 신호 확인, ATR 기반 손절(Stop Loss) 및 목표가(Take Profit), 그리고 XAUUSD, BTCUSD 및 주요 외환 통화쌍에 대한 유연한 신호 필터링 기능을 제공합니다. 전체 문서는 제품 블로그에서 확인할 수 있습니다:   [User Guide] SuperScalp Pro Auto Trader EA를 통해 자동 매매를 지원합니다:   [Auto Trader] SuperScalp Pro 의 거래 로직을 기반으로 개발된 골드 자동 스캘핑 EA: [SuperScalp Gold] SuperScalp Pro 는 Supertrend, VWAP, EMA, RSI, ADX, 거래량 분석, 볼린저 밴드 및 MACD 다이버전스를 결합하여
Divergence Bomber
Ihor Otkydach
4.89 (94)
가끔은 제가 직접 이 시스템을 이용해 거래를 하곤 합니다. 실계좌에서 제가 직접 수행하는 BOMBER 트레이딩을 확인해 보세요 - LIVE SIGNAL 이 지표를 구매하신 분께는 다음과 같은 혜택이 무료로 제공됩니다: 각 거래를 자동으로 관리하고, 손절/익절 수준을 설정하며, 전략 규칙에 따라 거래를 종료하는 전용 도우미 툴 "Bomber Utility" 다양한 자산에 맞게 지표를 설정할 수 있는 셋업 파일(Set Files) "최소 위험", "균형 잡힌 위험", "관망 전략" 모드로 설정 가능한 Bomber Utility의 셋업 파일 이 전략을 빠르게 설치, 설정, 시작할 수 있도록 돕는 단계별 영상 매뉴얼 주의: 위의 모든 보너스를 받기 위해서는 MQL5 개인 메시지 시스템을 통해 판매자에게 연락해 주세요. 독창적인 커스텀 지표인 “Divergence Bomber(다이버전스 봄버)”를 소개합니다. 이 지표는 MACD 다이버전스(괴리) 전략을 기반으로 한 올인원(All-in-On
Neuro Poseidon MT5
Daria Rezueva
4.85 (54)
Neuro Poseidon is a new indicator by Daria Rezueva. It combines precise trading signals with adaptive TP/SL levels - creating best possible trades as a result! Message me and get  Neuro Poseidon Assistant  as a gift to automize your trading process! What makes it stand out? 1. Proven profitability on all assets and timeframes 2. Only confirmed BUY and SELL signals present on the chart 3. Adaptive TP & SL levels generated by the software for each trade 4. Easy to understand - suitable for al
Entry Points Pro for MT5
Yury Orlov
4.51 (148)
전설이 돌아왔습니다: Entry Points Pro 10. MQL5 마켓 Top-3 자리를 3년간 지켜온 전설적인 지표의 재출시입니다. 수백 개의 호평 리뷰(두 버전 합산 589개), 매일 이 지표로 거래하는 수천 명의 트레이더, 31,000회 이상의 데모 다운로드   MT4+MT5 . 지난 5년간 여러분이 남긴 리뷰를 하나도 빠짐없이 읽었고, 약속 대신 그 답을 버전 10에 담았습니다. 1999년부터 시장에서 활동하며 정직함과 자신의 평판, 그리고 고객을 소중히 여기는 개발자가 만들었습니다. Entry Points Pro의 진입 시그널은 절대 리페인팅되지 않습니다. 그리고 이번에는 개발자의 말뿐이 아니라 검증 가능한 사실입니다: 확정 시그널은 캔들 종가에서만 표시되며, 자동화 테스트에서 리페인팅 0건 이 확인되었습니다(EURUSD, XAUUSD, BTCUSD에서 2,486,568회의 불변조건 검사 — 위반 0건). 검증 방법은 공개되어 있으니 전략 테스터에서 직접 재현해 보실 수
SMC Intraday Formula
Kareem Abbas
5 (22)
먼저 솔직하게 말하겠습니다. 어떤 인디케이터도 단독으로 당신을 수익성 있게 만들어주지 않습니다. 누군가 그렇게 말한다면, 그는 당신에게 꿈을 파는 것입니다. 완벽한 매수/매도 화살표를 보여주는 모든 인디케이터는 완벽하게 보이도록 만들 수 있습니다 — 단지 올바른 과거 구간을 확대하고 승리한 거래만 캡처하면 됩니다. 우리는 그렇게 하지 않습니다.  SMC Intraday Formula는 도구입니다. 시장 구조를 읽고, 가장 높은 확률의 가격 구간을 표시하며, 현재 스마트 머니의 흐름이 어떻게 보이는지 아주 단순한 언어로 보여줍니다. 최종 결정은 여전히 당신이 합니다. 실행도 당신이 합니다. 하지만 이제는 희망이 아니라 정확성으로 거래하게 됩니다. 우리는 이 인디케이터를 지난 약 3년 동안 골드(XAUUSD) 및 주요 외환 통화쌍의 데이 트레이딩 스캘핑에 사용해 왔습니다. M1, M5, M15, M30에서 우리의 핵심 도구입니다. 이 도구는 미래를 예측하려 하지 않습니다 — 지금 형성
Superhero
Ihor Otkydach
5 (2)
SUPERHERO 지표는 “올인원” 방식으로 설계된 다중 통화 거래 시스템입니다. 이 지표는 시장을 독자적으로 분석하여 포지션을 개설하고 청산할 시점에 대한 신호를 제공합니다. 손절매(Stop Loss) 및 익절(Take Profit) 주문을 활용하며, 위험 대비 수익 비율(R:R)은 1:1입니다. 가끔 저는 이 시스템의 신호를 바탕으로 직접 거래를 하는데, 그 결과는 다음과 같습니다— 실시간 신호 이 시스템은 스마트폰으로 푸시 알림을 전송할 수 있으므로, PC에 묶여 있을 필요 없이 “이동 중에도” 매매를 할 수 있습니다. 이는 자체 거래 전문 회사에 안성맞춤입니다. 모든 고객님께 드리는 특별 혜택: 이 지표를 구매하시는 모든 분께는 제가 특별히 준비한 유틸리티를 선물로 드릴 예정이며, 이 유틸리티는 다음과 같은 기능을 제공합니다: 손절매 및 익절 주문을 자동으로 설정합니다 가격이 목표 수준에 도달하면 자동으로 포지션을 청산합니다 미결제 주문 거래를 지원합니다 평균화 거래 모드를
M1 Sniper MT5
Oleg Rodin
5 (6)
M1 SNIPER 는 사용하기 쉬운 거래 지표 시스템입니다. M1 시간대에 맞춰 설계된 화살표 지표입니다. 이 지표는 M1 시간대 스캘핑을 위한 단독 시스템으로 사용할 수 있으며, 기존 거래 시스템의 일부로도 사용할 수 있습니다. 이 거래 시스템은 M1 시간대 거래용으로 특별히 설계되었지만, 다른 시간대에도 사용할 수 있습니다. 원래는 XAUUSD와 BTCUSD 거래를 위해 이 방법을 설계했지만, 다른 시장 거래에도 유용하다는 것을 알게 되었습니다. 이 지표의 신호는 추세 방향과 반대로 거래될 수 있습니다. 저는 지표의 신호를 활용하여 양방향으로 거래할 수 있도록 돕는 특별한 거래 기법을 알려드립니다. 이 방법은 특별한 동적 지지선과 저항선 가격 영역을 활용하는 것을 기반으로 합니다. 구매하시면 M1 SNIPER 화살표 지표를 바로 다운로드하실 수 있습니다. 또한, 아래 스크린샷에 표시된 Apollo Dynamic SR 지표는 M1 SNIPER 도구를 사용하는 모든 사용자에게 무료로
GoldenX Entry MT5
Kareem Abbas
5 (15)
GoldenX Entry는 MT5용 인디케이터로, 적응형 Smart Entry Trend 알고리즘, 신호 스코어링 시스템, 시장 레짐 감지 기능, 그리고 변동성 필터를 포함합니다. 각 신호에는 계산된 진입 레벨, 3개의 익절(TP1, TP2, TP3) 레벨, 그리고 손절(Stop-Loss) 레벨이 포함됩니다. 이 인디케이터는 다양한 시장 환경에 적응하도록 설계된 다중 분석 레이어 구조 위에 구축되어 있으며, 내장 최적화기와 통계 추적 시스템을 결합합니다. 또한 Risk-to-Reward(RR) 지표와 과거 거래 행동 기반의 정량 분석을 제공합니다. 시작은 간단합니다 — 선택한 타임프레임에서 최적화기를 실행한 뒤 차트에서 바로 인디케이터를 사용하면 됩니다. 핵심 기능 GoldenX Entry는 하나의 차트에서 신호 엔진, 트레이드 관리 기능, 그리고 과거 통계 추적을 통합합니다: - 내장 최적화기: 최적화기는 차트에서 원클릭으로 실행됩니다. 200개의 파라미터 조합을 두 단계 탐색
Zoryk Gold
Reda El Koutbane
5 (6)
ZORYK — MetaTrader 5용 XAUUSD 전문 신호 및 트레이드 플래닝 시스템 이런 경험이 있을 것입니다. 골드를 분석하고 진입을 기다린 뒤 마침내 포지션을 열었지만 가격이 곧바로 반대 방향으로 움직입니다. 너무 일찍 청산하거나 Stop Loss를 옮기거나 몇 초 동안 망설입니다. 그 후 시장은 내가 없이도 처음 예상했던 목표까지 정확히 움직입니다. 문제는 항상 방향이 아니었습니다. 진짜 문제는 불확실성이었습니다. 정확한 진입 위치를 몰랐습니다. 어느 지점에서 원래의 트레이드 아이디어가 무효가 되는지 몰랐습니다. 가까운 수익을 확보해야 할지 더 큰 움직임을 기다려야 할지 판단하기 어려웠습니다. 현재 setup이 정말 강한지 아니면 단지 새로운 거래를 억지로 찾고 있는지도 확신하기 어려웠습니다. 골드는 매우 빠르게 움직입니다. 명확한 계획이 없다면 좋은 분석도 몇 초 만에 나쁜 결정으로 바뀔 수 있습니다. ZORYK는 이 문제를 해결하기 위해 개발되었습니다.
Session High Low Lines Indicator that plots key intraday reference levels directly on the chart: the previous day's high/low and the current day's high/low, updated automatically as the new day forms. An optional previous week high/low can also be displayed. These levels are widely used as reference points for potential support and resistance zones, breakout confirmation, and range context during a trading session. Features Previous day High/Low lines Current day High/Low lines (updates in real
Atomic Analyst MT5
Issam Kassas
4.44 (54)
이 제품은 2026년 시장에 맞게 업데이트되었으며 최신 MT5 빌드에 최적화되었습니다. 가격 업데이트 안내: Atomic Analyst는 현재 $99 에 제공됩니다. 다음 30회 구매 후 가격은 $199 로 인상됩니다. 특별 혜택: Atomic Analyst 구매 후 저에게 개인 메시지를 보내시면 Smart Universal EA를 무료 로 받을 수 있으며, Atomic Analyst 신호를 자동 거래로 전환할 수 있습니다. Atomic Analyst는 리페인트 없음, 재그리기 없음, 지연 없음의 Price Action 거래 인디케이터로, 수동 거래, 신호 명확성, EA 자동화를 위해 설계되었습니다. User manual: settings, inputs and strategy.   &   User Manual PDF . 가격 움직임, 강도, 모멘텀, 다중 시간대 방향 및 고급 필터를 분석하여 트레이더가 노이즈를 줄이고 약한 세팅을 피하며 더 체계적인 거래 결정을 내릴 수 있도록
UZFX {SSS} 스캘핑 스마트 시그널 v4.0 MT5는 급변하는 시장에서 정확한 실시간 시그널을 필요로 하는 스캘퍼, 데이 트레이더, 스윙 트레이더를 위해 설계된 리페인팅이 없는 고성능 트레이딩 지표입니다. (UZFX-LABS)에서 개발한 이 지표는 가격 움직임 분석, 추세 확인 및 스마트 필터링을 결합하여 모든 통화 쌍과 시간대에서 높은 확률의 매수 및 매도 신호, 경고 신호, 추세 지속 기회를 생성합니다. 거래에 대한 의구심을 떨쳐버리고, 명확성, 정밀성, 그리고 규율 있는 시장 실행을 원하는 트레이더를 위해 설계된 체계적인 신호 시스템을 따르기 시작하세요. 제 추천* 최적의 시간대: 15분 이상. {H1}이 제가 가장 선호하는 시간대입니다. 그리고 그 결과는 정말 놀라울 정도입니다...!! 주요 기능 업데이트 • 자동 매수 및 매도 신호 감지 • 고급 반전 인식 로직 • 잠재적인 시장 반전 전 조기 경고 신호 • 추세 지속 확인 신호 • 진입, 손절, TP1, TP2,
Gann Made Easy MT5
Oleg Rodin
5 (9)
Gann Made Easy 는 mr.의 이론을 사용하여 최고의 거래 원칙을 기반으로 하는 전문적이고 사용하기 쉬운 Forex 거래 시스템입니다. W.D. 간. 이 표시기는 Stop Loss 및 Take Profit Levels를 포함하여 정확한 BUY 및 SELL 신호를 제공합니다. PUSH 알림을 사용하여 이동 중에도 거래할 수 있습니다. 구매 후 거래 방법 안내 및 유용한 추가 지표를 무료로 받으시려면 저에게 연락주세요! 아마도 Gann 거래 방법에 대해 이미 여러 번 들었을 것입니다. 일반적으로 Gann의 이론은 초보자 거래자뿐만 아니라 이미 거래 경험이 있는 사람들에게도 매우 복잡한 것입니다. Gann의 거래 방식은 이론적으로 적용하기 쉽지 않기 때문입니다. 나는 그 지식을 연마하고 Forex 지표에 최고의 원칙을 적용하기 위해 몇 년을 보냈습니다. 표시기는 적용하기가 매우 쉽습니다. 차트에 첨부하고 간단한 거래 권장 사항을 따르기만 하면 됩니다. 지표는 지속적으로 시장 분석
Trend Catcher ind mt5
Ramil Minniakhmetov
5 (18)
트렌드 캐처 인디케이터 트렌드 캐처 인디케이터는 개발자가 자체 개발한 맞춤형 적응형 트렌드 분석 지표들을 조합하여 시장 가격 움직임을 분석합니다. 단기적인 노이즈를 제거하고 근본적인 모멘텀 강도, 변동성 확대, 가격 구조 움직임에 집중하여 진정한 시장 방향을 파악합니다. 또한 이동 평균, RSI, 변동성 필터와 같은 맞춤형 지표들을 활용하여 가격을 평활화하고 트렌드를 필터링합니다. 실제 운영 모니터링 및 기타 제품은 다음 링크에서 확인하실 수 있습니다:   https://www.mql5.com/en/users/mechanic/seller 텔레그램에서는 EA나 설정 파일을 판매하지 않습니다. 사기이니 주의하세요. 모든 설정 파일은 블로그에서 무료로 제공됩니다. 중요! 구매 후 즉시 연락 주시면 사용 방법 및 보너스를 드립니다!
SkyHammer Signal Pro
Shengzu Zhong
5 (4)
SkyHammer Signal Pro Entry, SL, TP 레벨이 고정되는 전문 No-Repaint 추세 신호 인디케이터 SkyHammer Signal Pro는 명확하고 고정되며 검증 가능한 신호를 원하는 트레이더를 위해 설계된 구조적인 추세 및 모멘텀 신호 인디케이터입니다. 특히 M1 및 M5 같은 낮은 시간대에서 가장 효과적으로 작동합니다. 이 인디케이터는 시장의 고점이나 저점을 예측하려고 하지 않습니다. 대신 신호를 생성하기 전에 확인된 시장 구조, 추세 방향, 모멘텀 강도, 건강한 변동성, 그리고 목표까지의 충분한 공간을 기다립니다. 주요 기능 고정 신호 메커니즘 신호가 확인되면 화살표, Entry, Stop Loss, TP1, TP2 레벨이 차트에 영구적으로 고정됩니다. 이후 캔들 움직임 때문에 신호가 사라지거나, 이동하거나, 변경되지 않습니다. 이를 통해 트레이더는 각 신호를 명확하게 검토할 수 있으며, 실시간 시장에서 신호가 사라지는 일반적인 문제를 피할 수 있습니다
Crystal Heikin Ashi Signals
Muhammad Jawad Shabir
5 (3)
Crystal Heikin Ashi Signals - Professional Trend & Signal Detection Indicator Advanced Heikin Ashi Visualization with Intelligent Signal System for Manual & Automated Trading Final Price: $149 ---------> Price goes up $10 after every 10 sales . Limited slots available — act fast . Overview Crystal Heikin Ashi Signals is a professional-grade MetaTrader 5 indicator that combines pure Heikin Ashi candle visualization with an advanced momentum-shift detection system. Designed for both manual traders
SR Liquidity MT5
Oleg Rodin
5 (2)
SR Liquidity 는 시장 유동성이 집중되고 가격이 가장 강력하게 반응하는 숨겨진 구간을 포착하도록 설계된 트레이딩 지표입니다. 이러한 특수 유동성 구간은 강력한 지지 및 저항선 역할을 하며, 시장 반전 가능성이 가장 높은 지점을 명확하게 보여주는 지도가 되어 줍니다. SR Liquidity는 일반적인 지지 및 저항선을 단순히 그리는 대신, 실제 가격 움직임을 분석하여 매수 및 매도 압력이 집중되는 구간을 포착합니다. 이러한 구간은 실질적인 시장의 흐름을 주도하는 유동성 풀(liquidity pools)에 해당합니다. 이 지표는 해당 구간을 차트에 직접 시각화하여, 가격 반응이 실제로 나타나기 전에 이를 미리 예측할 수 있도록 돕습니다. 즉, 가격 추세가 전환될 가능성을 사전에 파악하게 해주는 것입니다. 결과적으로 이 지표는 가공되지 않은 가격 움직임(price action)을 시장의 핵심 가격대, 다시 말해 추세 전환점이 될 수 있는 지점들을 보여주는 명확하고 실용적인 로드맵
Power Candles MT5
Daniel Stein
5 (9)
Power Candles V3 - 자체 최적화 강도 지표 파워 캔들 V3는 적용된 모든 차트에서 통화 및 상품의 강세를 실행 가능한 거래 계획으로 전환합니다. 단순히 캔들에 색상을 입히는 대신, 백그라운드에서 실시간 자동 최적화를 수행하여 현재 보고 있는 종목에 대한 최적의 손절매, 익절 및 신호 임계값을 제공합니다. 한 번의 클릭으로 실시간 거래에 적용할 수 있으며, 진입점, 손절매 및 익절 선이 정확한 가격에 맞춰 차트에 표시되고, 방향과 함께 알림이 발령됩니다. 이 도구는 Stein Investments 에코시스템의 일부입니다. 18개 이상의 도구와 함께 당신의 1대1 AI 트레이딩 멘토 Max.  항상 대기 중, 모든 인디케이터를 깊이 있게 이해, 무언가를 차근차근 생각해보고 싶은 순간에 도움을 줍니다.  https://stein.investments 에서 만나보세요 매 종가 바마다 3,000회 이상의 트레이딩 시뮬레이션. 9가지 강도 상태. 2가지 전략을 병렬로 테스트.
Azimuth Pro
Ottaviano De Cicco
5 (7)
Azimuth Pro V2: Synthetic Fractal Structure and Confirmed Entries for MT5 Overview Azimuth Pro is a multi-level swing structure indicator by Merkava Labs . Four nested swing layers, swing-anchored VWAP, ABC pattern detection, three-timeframe structural filtering, and closed-bar confirmed entries — one chart, one workflow from micro-swings to macro-cycles. This is not a blind signal product. It is a structure-first workflow for traders who care about location, context, and timing. ️ Summer Sale
The Oracle Pro
Ottaviano De Cicco
5 (1)
The Oracle Pro: Synthetic Multi-Timeframe Bias Engine for MT5 ️ Summer Launch Offer — Get The Oracle Pro for USD 199 (early buyers). Price rises with traction; final price USD 399. The Oracle Pro is a premium multi-timeframe bias engine for MetaTrader 5, built for demanding and professional traders. It answers one question with discipline: what is the directional bias on each timeframe right now, how strong is it, and how much do the timeframes agree? Everything is computed on closed bars only
이 제품은 2026년 시장에 맞게 업데이트되었으며 최신 MT5 빌드에 최적화되었습니다. 가격 업데이트 안내: Smart Price Action Concepts는 현재 $200 에 제공됩니다. 다음 30회 구매 후 가격은 $299 로 인상됩니다. 특별 혜택: 구매 후 저에게 개인 메시지를 보내시면 무료 보너스 + 선물 을 받을 수 있습니다. 먼저, 이 트레이딩 도구는 리페인트 없음, 재그리기 없음, 지연 없음의 인디케이터이므로 전문적인 트레이딩에 적합하다는 점을 강조하고 싶습니다. [Online course] ,   [User Manual]  ,  [How to Install]  ,   [PDF] Smart Price Action Concepts Indicator는 초보자와 경험 많은 트레이더 모두에게 매우 강력한 도구입니다. 20개 이상의 유용한 인디케이터를 하나로 결합하고, Inner Circle Trader Analysis와 Smart Money Concepts Trading
Market Structure Order Block Dashboard MT5는 시장 구조와 주요 가격 반응 구역을 차트에서 직접 읽고자 하는 트레이더를 위해 설계된 MT5 지표입니다. BOS, ChoCH, 오더 블록, Fair Value Gap (FVG), 유동성, Kill Zones, Volume Profile 그리고 빠른 분석을 위한 콤팩트한 대시보드를 결합합니다. 이 지표는 시장 구조, ICT 및 Smart Money 개념을 의사결정 프레임워크로 사용하는 트레이더를 대상으로 합니다. 추세 지속, 가능한 반전, 가격 불균형, 유동성 타겟 및 관심 구역을 보다 체계적으로 식별하는 데 도움을 줄 수 있습니다. 구매자를 위한 포함 리소스 구매 후 MQL5 개인 메시지로 요청하시면 완전한 PDF 사용 설명서와 파라미터 설정 팁을 제공해 드립니다. MQL5 개인 메시지를 통한 직접 기술 지원. 1.20 버전은 두 가지 주요 추가 기능을 제공합니다: Pending BOS / Pending
Axiom Matrix
Issam Kassas
5 (5)
AXIOM MATRIX MT5 출시 가격: $99 Axiom Matrix는 출시 가격 $99에 제공됩니다. 첫 30회 구매 이후 가격은 $199로 인상됩니다. 구매 후, 안내 사항을 받고 독점 선물 보너스를 받기 위해 저에게 직접 DM을 보내주세요. Axiom Matrix는 MetaTrader 5용 전문 멀티 심볼, 멀티 타임프레임 시장 스캐너이자 의사결정 대시보드입니다. Axiom Matrix는 사용자의 Market Watch를 스캔하고, 여러 타임프레임을 분석하며, 여러 근거 엔진을 읽고, 가장 강한 기회를 비교하여 하나의 깔끔한 매트릭스 대시보드 안에서 최적의 BUY, SELL, WAIT 또는 차단 상태를 보여줍니다. 저는 무거운 시장 스캔 작업을 대신 처리해 줄 수 있는 하나의 도구가 필요했기 때문에 Axiom Matrix를 만들었습니다. 저는 RSI만 따로 확인하고 싶지 않았습니다. 그다음 MACD만 따로 확인하고. 그다음 이동평균. 그다음 거래량. 그다음 변동성. 그다음
M1 Quantum MT5
Hamed Dehgani
4.27 (11)
M1 Quantum을 이용한 실시간 트레이딩 신호 : 신호   ( Quantum Trade Assistant 에 의해 거래가 자동으로 실행되며, 이 제품에 무료 로 포함되어 있습니다.) 최신 소식: 버전 1.64가 출시되었습니다. 이제 모든 거래에는 해당 지지/저항 구간 뒤에 Stop Loss가 설정됩니다. 또한 이번 버전에서는 EA의 성능을 향상시키기 위해 Smart Close 기능이 개선되었습니다. 8월 9일부터 라이브 신호는 버전 1.64로 운영되고 있습니다. 가격 계획: 현재 가격: $169 (얼리 어답터 혜택) 다음 예정 가격: $189 예정 소매 가격: $299 개발자 안내: 구매 후 저에게 연락하시면 최신 권장 설정 파일(Set File) , 사용 팁, 그리고 다른 M1 Quantum 사용자들과 소통할 수 있는 VIP 지원 그룹 초대장을 받으실 수 있습니다. 자주 묻는 질문 - 설정 파일 - 설치 가이드 M1 Quantum 은 M1 전용 전문 트레이딩 시스템으로, 손
Crystal Quantum Pro
Muhammad Jawad Shabir
5 (2)
CRYSTAL QUANTUM PRO Institutional Signal & Trade Intelligence for MetaTrader 5 Final Price: 199 USD ----> Price goes up 10 USD after every 10 sales. Limited launch slots available, act fast. Most indicators give you an arrow and leave you alone. A naked arrow is a gamble. Winning consistently requires CONFLUENCE , a clear STOP and TARGET , and honest PROOF that the system works. Crystal Quantum Pro delivers all three in one clean, no-repaint package. Crystal Quantum Pro is a complete decision sy
Reversion King Indicator
Eugen-alexandru Zibileanu
5 (6)
새로운 왕의 등장 - 인디케이터 + 주문 관리 표시(TP1 + TP2 + TP3) + 선택형 텔레그램 시그널 전송 기능 포함 (무료) (완전한 트레이딩 및 시그널 시스템) 골드를 위한 최고의 EA: Gold Slayer 이 인디케이터는 고급 전략, 사용자 지정 가능한 주문 관리 시스템, 그리고 엔벨로프 확장을 결합한 평균 회귀(mean reversion) 시스템을 포함하고 있습니다. 또한 RSI와 같은 여러 지능형 확인 필터를 통해 높은 확률의 반전 진입 구간을 포착하여 BUY 및 SELL 시그널을 제공합니다. 단순히 거래 방법만 배우는 것이 아니라, 여러 포지션을 효과적으로 관리하고 이전에 수익 중인 오픈 포지션으로 손실 거래를 커버하는 방법까지 익힐 수 있습니다. M5 전용으로 설계 및 최적화되었으며, 유동성이 풍부해 시그널이 더 깔끔하고 신뢰도 높은 BTCUSD와 XAUUSD에서 뛰어난 성능을 발휘합니다. 이 인디케이터는 ATR 기반으로 자동 계산된 진입가, 손절가, 익절가와
Smc Pro ToolKit
Talal N Z Aljarusha
5 (9)
SMC PRO TOOLKIT — SMART MONEY ANALYSIS & STRUCTURED TRADE PLANNING SMC Pro ToolKit is a professional Smart Money Concepts analysis workspace for MetaTrader 5. It combines market structure, multi-timeframe analysis, institutional price zones, setup evaluation, confirmation tools, volume context, alerts, and risk planning inside one organized chart environment. One workspace. Multiple layers of confirmation. One structured trading plan. OPEN COMPLETE USER GUIDE MULTI-CONDITION SETUP ENGINE At
필터:
리뷰 없음
리뷰 답변