SMA structure
- 지표
- 버전: 1.45
- 업데이트됨: 4 5월 2026
- 활성화: 5

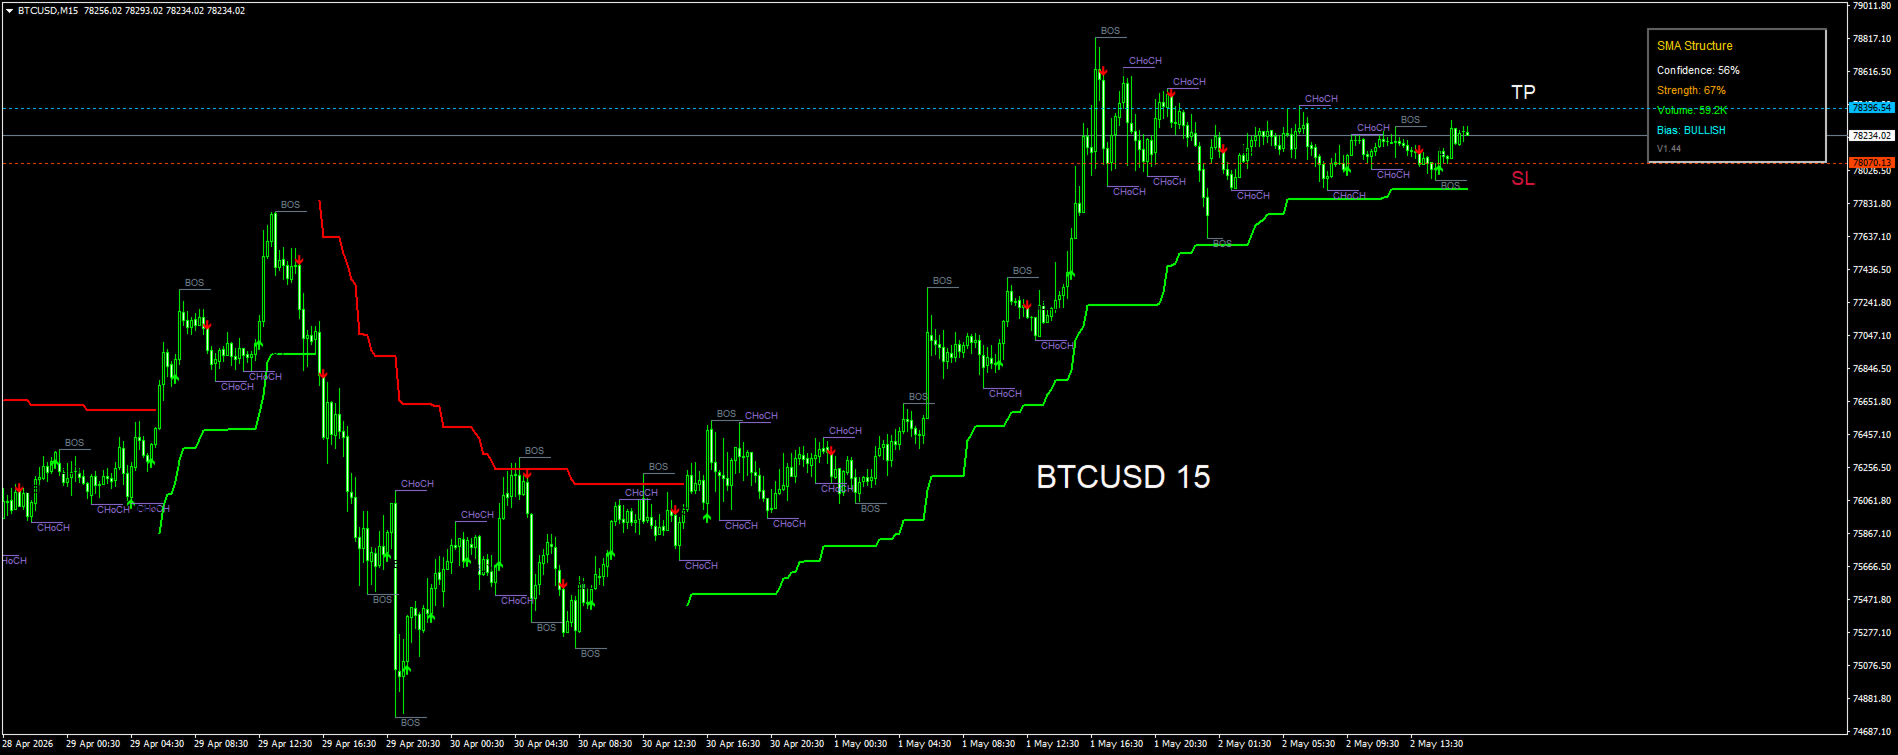
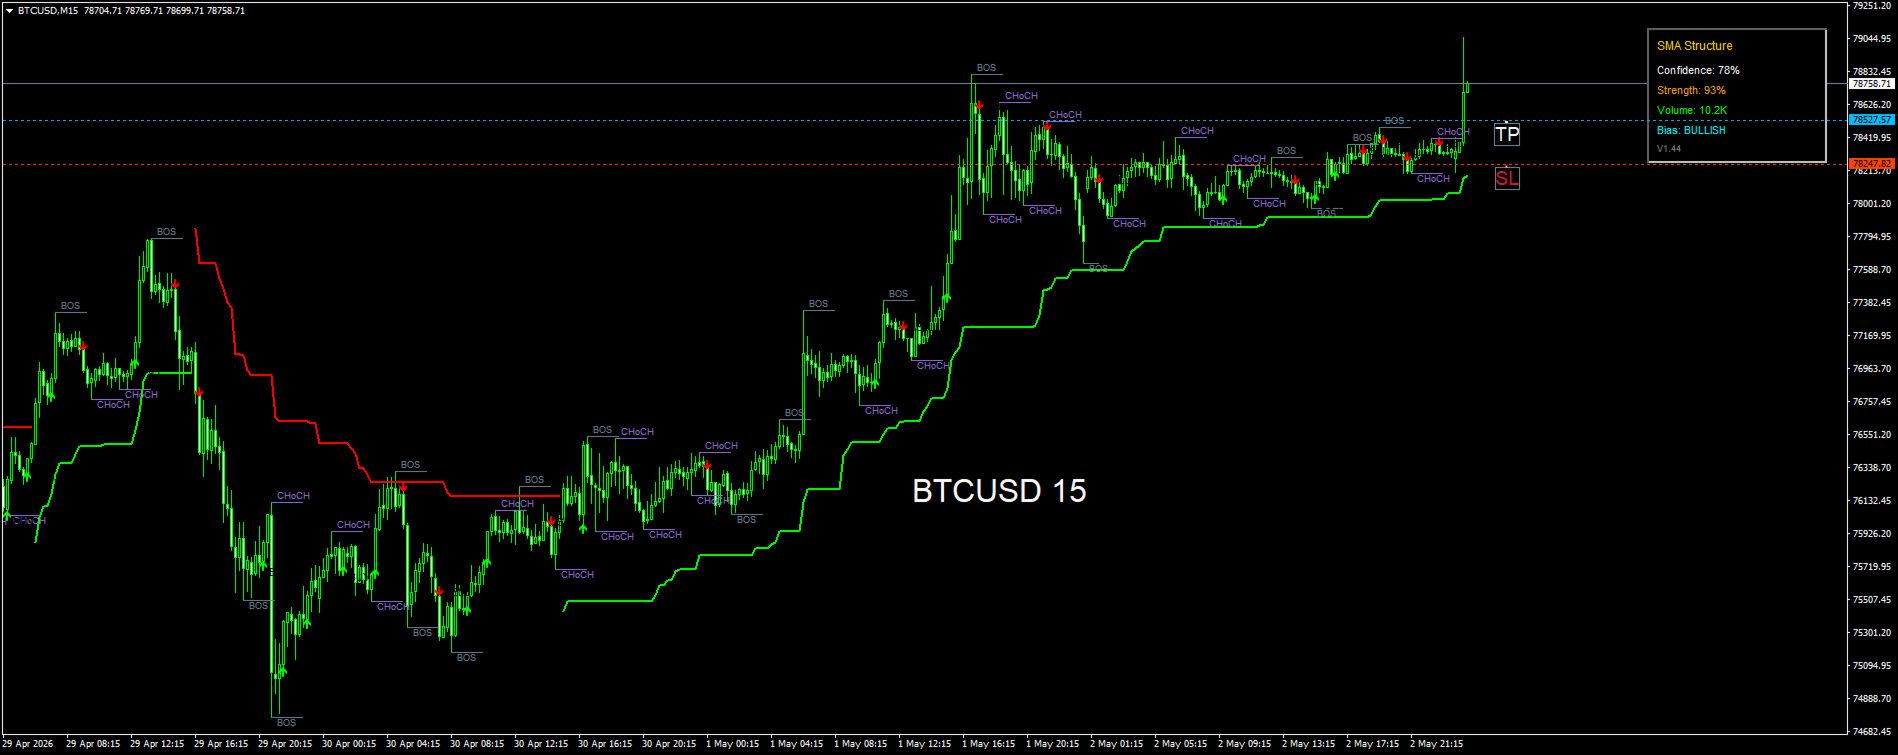
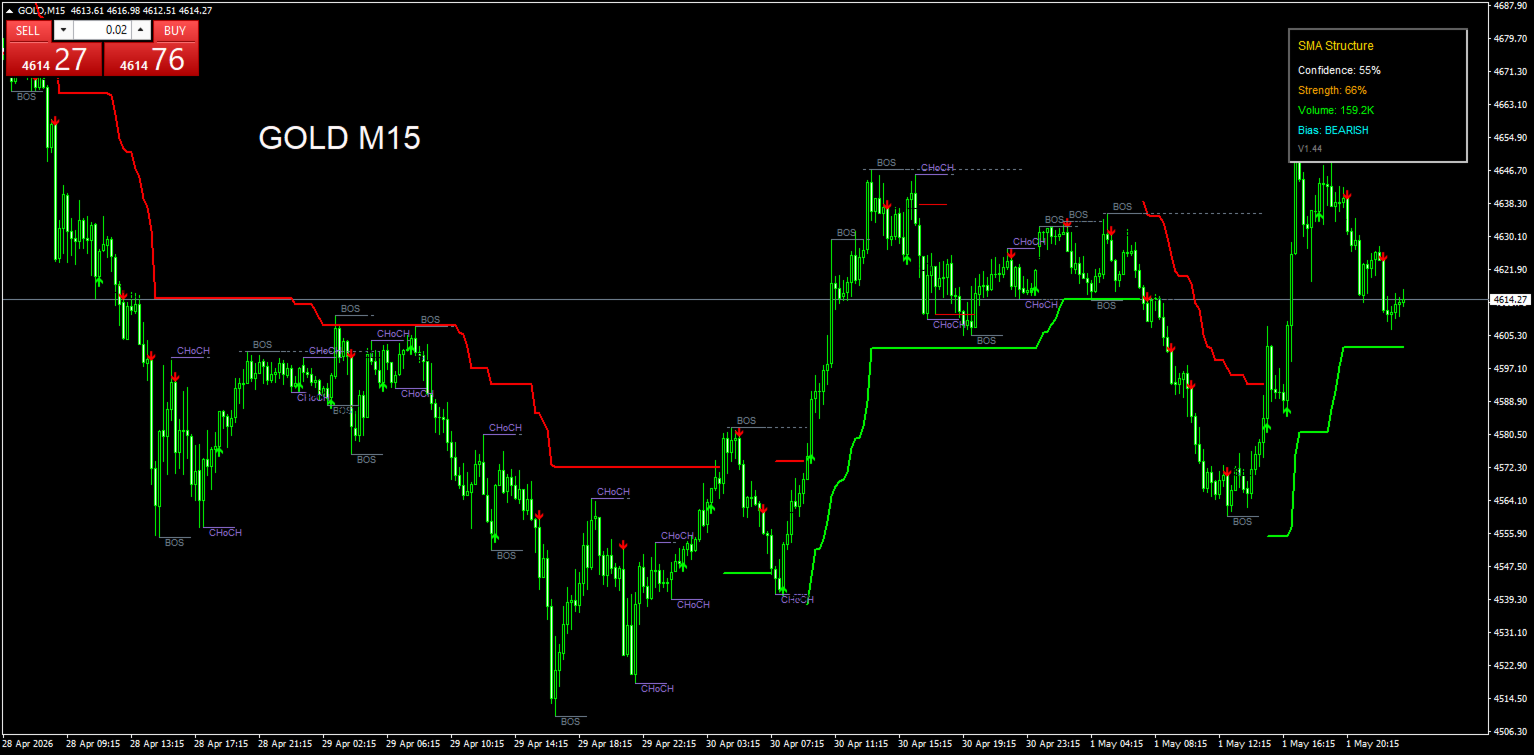
Indicator Overview: SMA Structure 1
The Sma Structure is a trend-following and market structure indicator designed for MT4, heavily inspired by the precision of TradingView’s SuperTrend combined with SMC (Smart Money Concepts). It is designed to identify high-probability entry points while providing a clear visual of the market's current direction.
Key Features:
-
Dual-Engine Trend Analysis: Uses a robust trailing-stop algorithm (Sync TV Engine) to ensure the trend line stays on the correct side of the price during volatile moves.
-
Dynamic Signal Arrows:
-
Buy/Sell Entries: Green and Red arrows appear when trend direction, candle momentum (Stability), and RSI levels align.
-
Management (Break Even): Since the signals appear in trending phases, each subsequent arrow in the same direction can be used as a Break Even point or a trailing stop-loss level for your initial position.
-
-
Market Structure (BOS): Automatically identifies "Break of Structure" levels, helping you see when the market is confirming a continuation of the trend.
-
Live Dashboard: A real-time data window providing:
-
Strength: Current RSI-based momentum.
-
Confidence: A percentage score based on candle body-to-wick ratio and trend alignment.
-
Volume: Real-time tick volume tracking (displayed in Thousands).
-
Parameter Explanations (Simple Guide)
| Parameter | Simple Explanation |
| InpDash X/Y/Color | Adjusts the horizontal/vertical position and background color of the info box. |
| InpST Period & Mult | Controls the SuperTrend sensitivity (Lower = more signals, Higher = smoother trend). |
| InpPivotPeriod | Defines how many candles are needed to identify a new High or Low for SMC levels. |
| InpBOSColor / Size | Sets the color and text size for the "Break of Structure" labels on the chart. |
| InpStability | Filters signals by candle "fullness" (e.g., 0.7 means the body must be 70% of the total candle). |
| InpArrowSize | Changes the visual size of the Buy and Sell arrows. |
| InpRSIPeriod / Limit | Sets the RSI timeframe and the "Overbought/Oversold" ceiling to prevent buying too high. |
| InpLiqThreshold | Price gap tolerance to identify Equal Highs/Lows (Higher = more liquidity zones). |
| InpMinBars | Minimum distance (in candles) between arrows to prevent signal overlap. |
| InpStability | Filters signals based on candle body size (Higher = stronger momentum required). |