Pullback EMA PRO for MT5

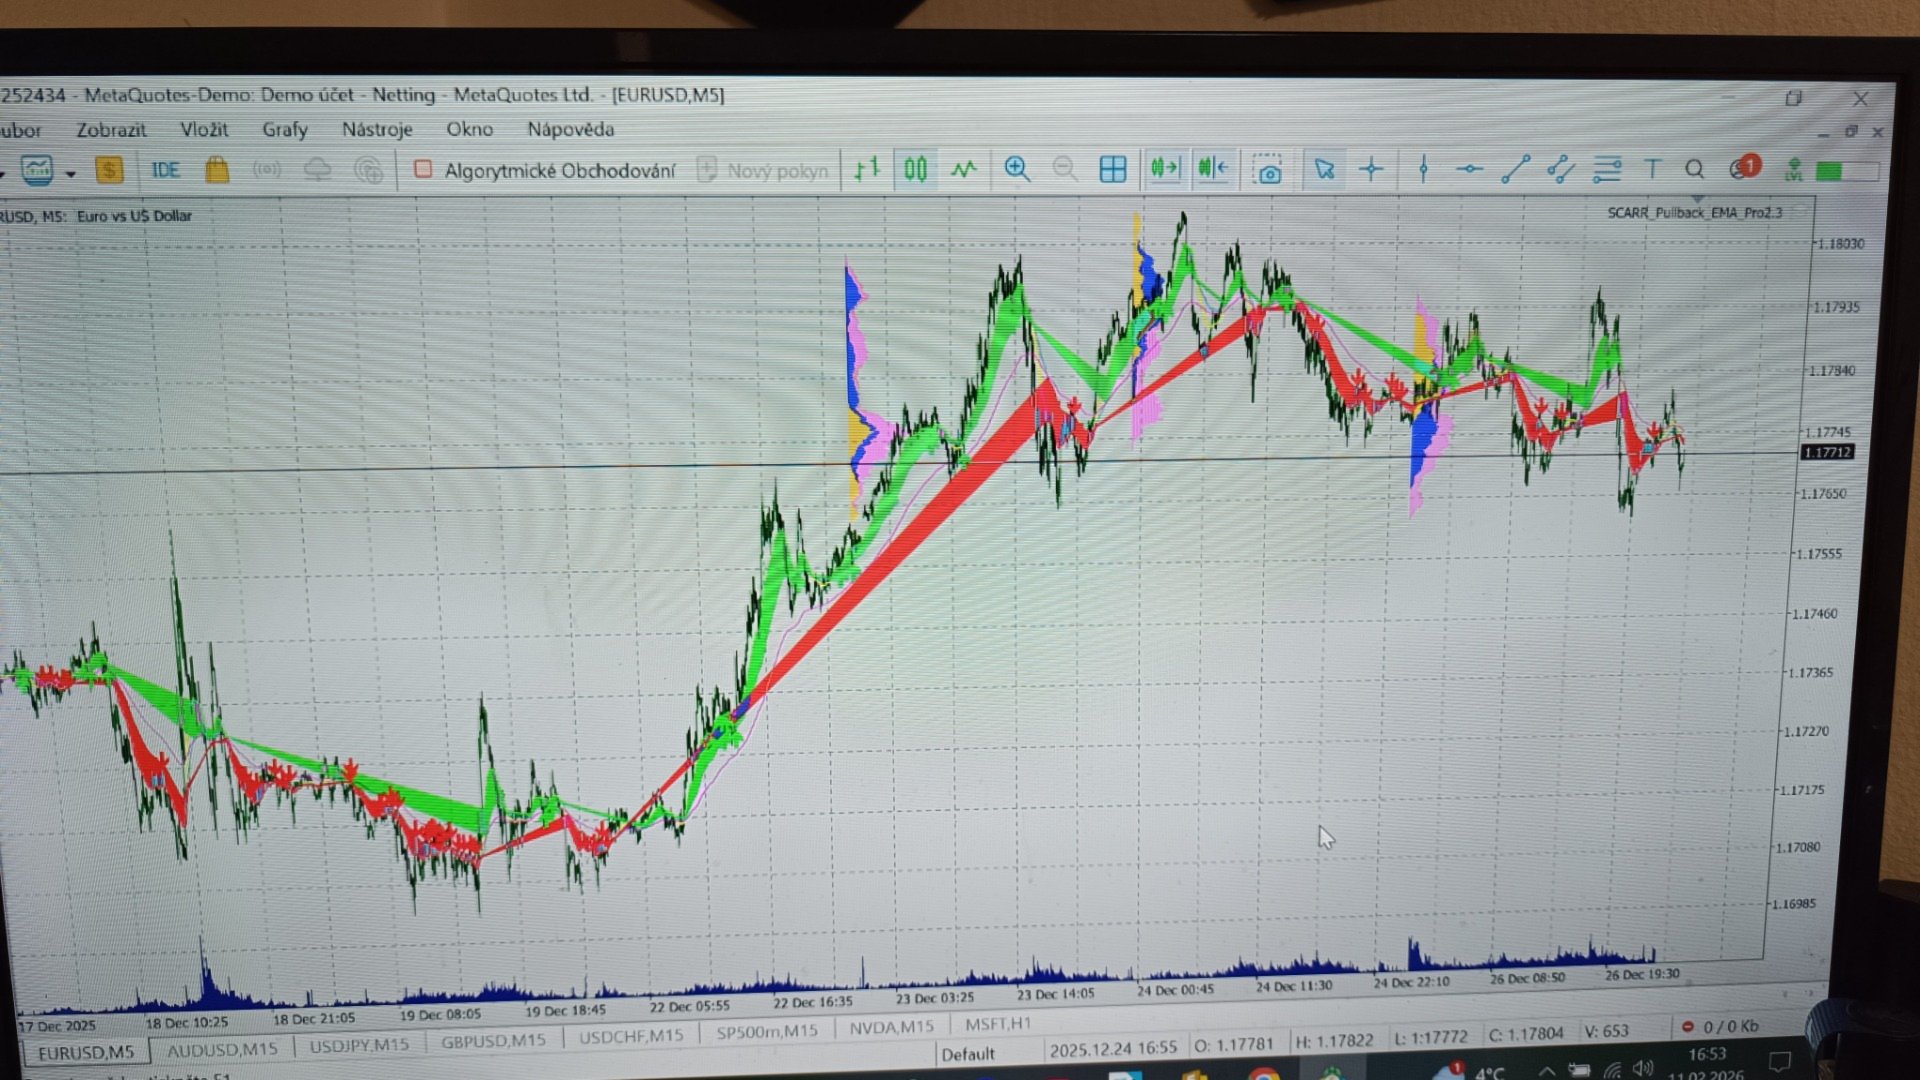
Pullback EMA PRO – Trendový indikátor s EMA Pullbacky a objemem trhu

Popis:
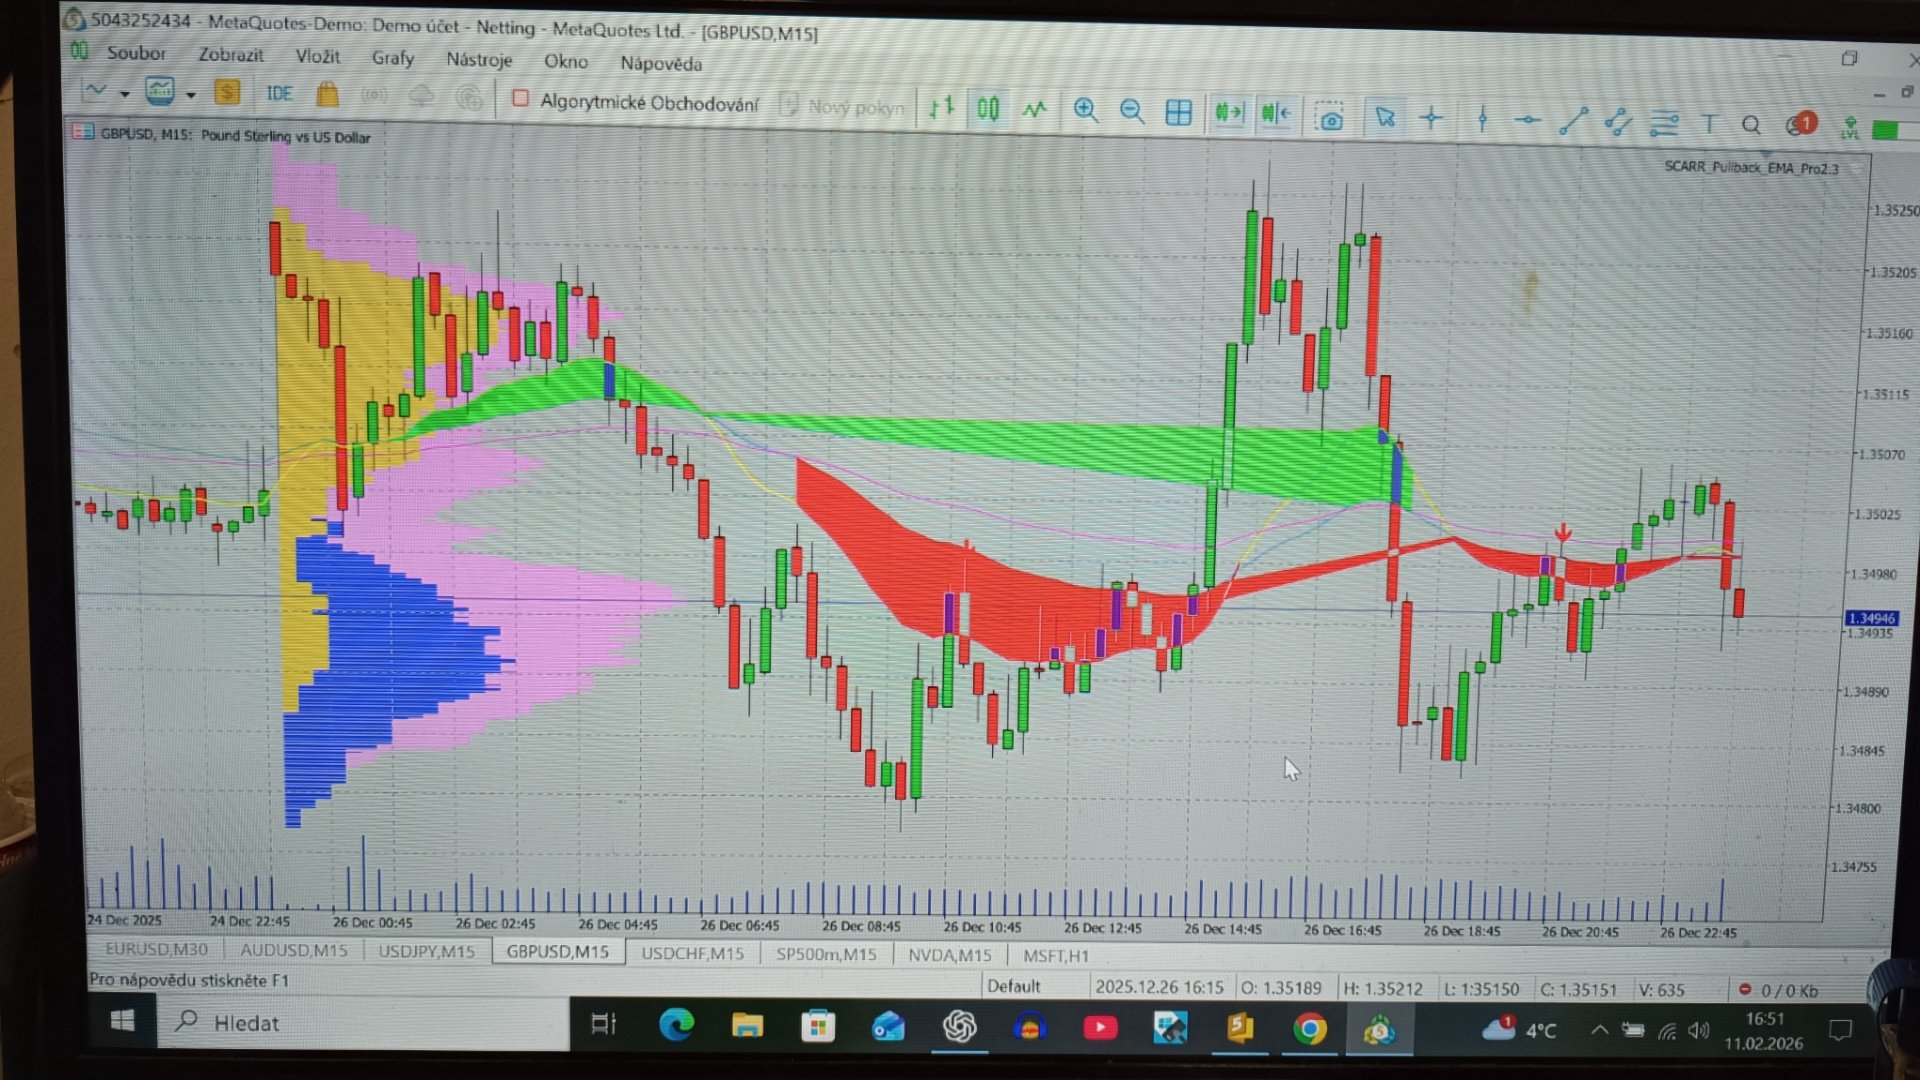
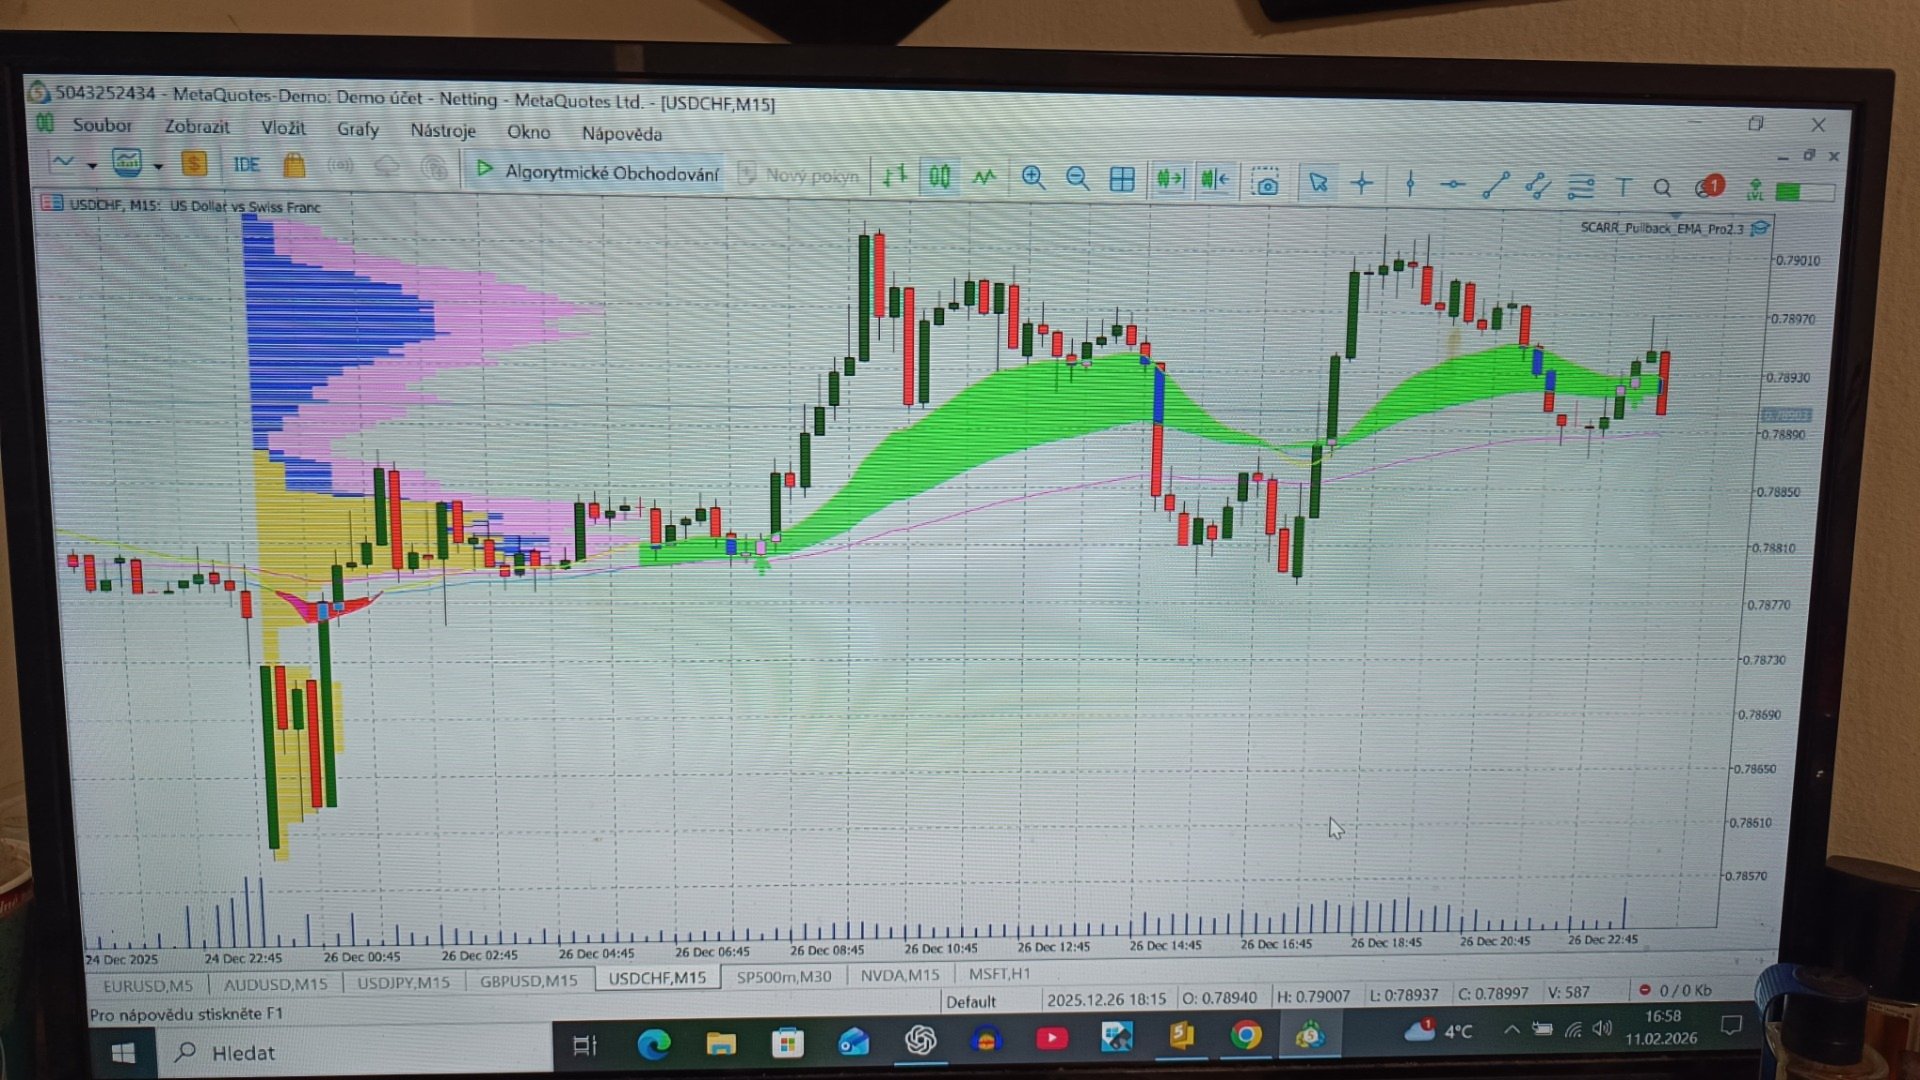
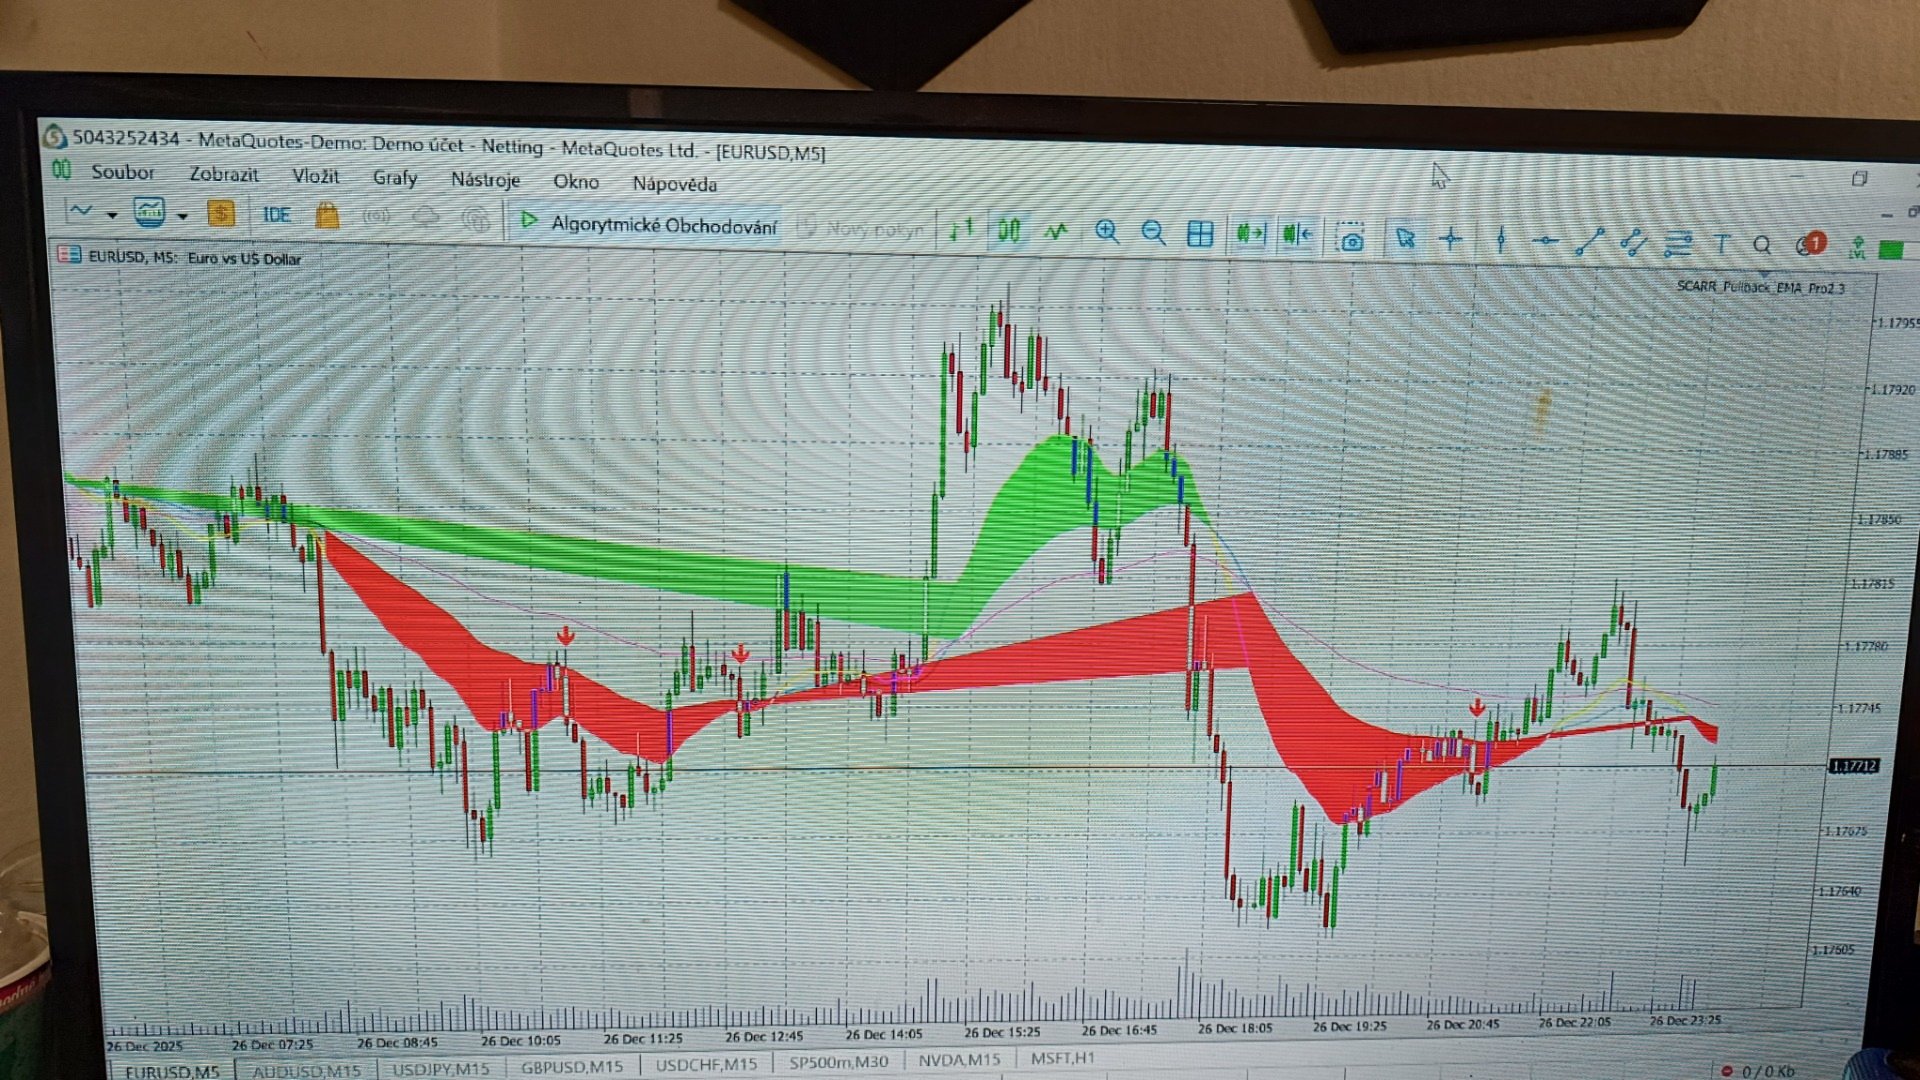
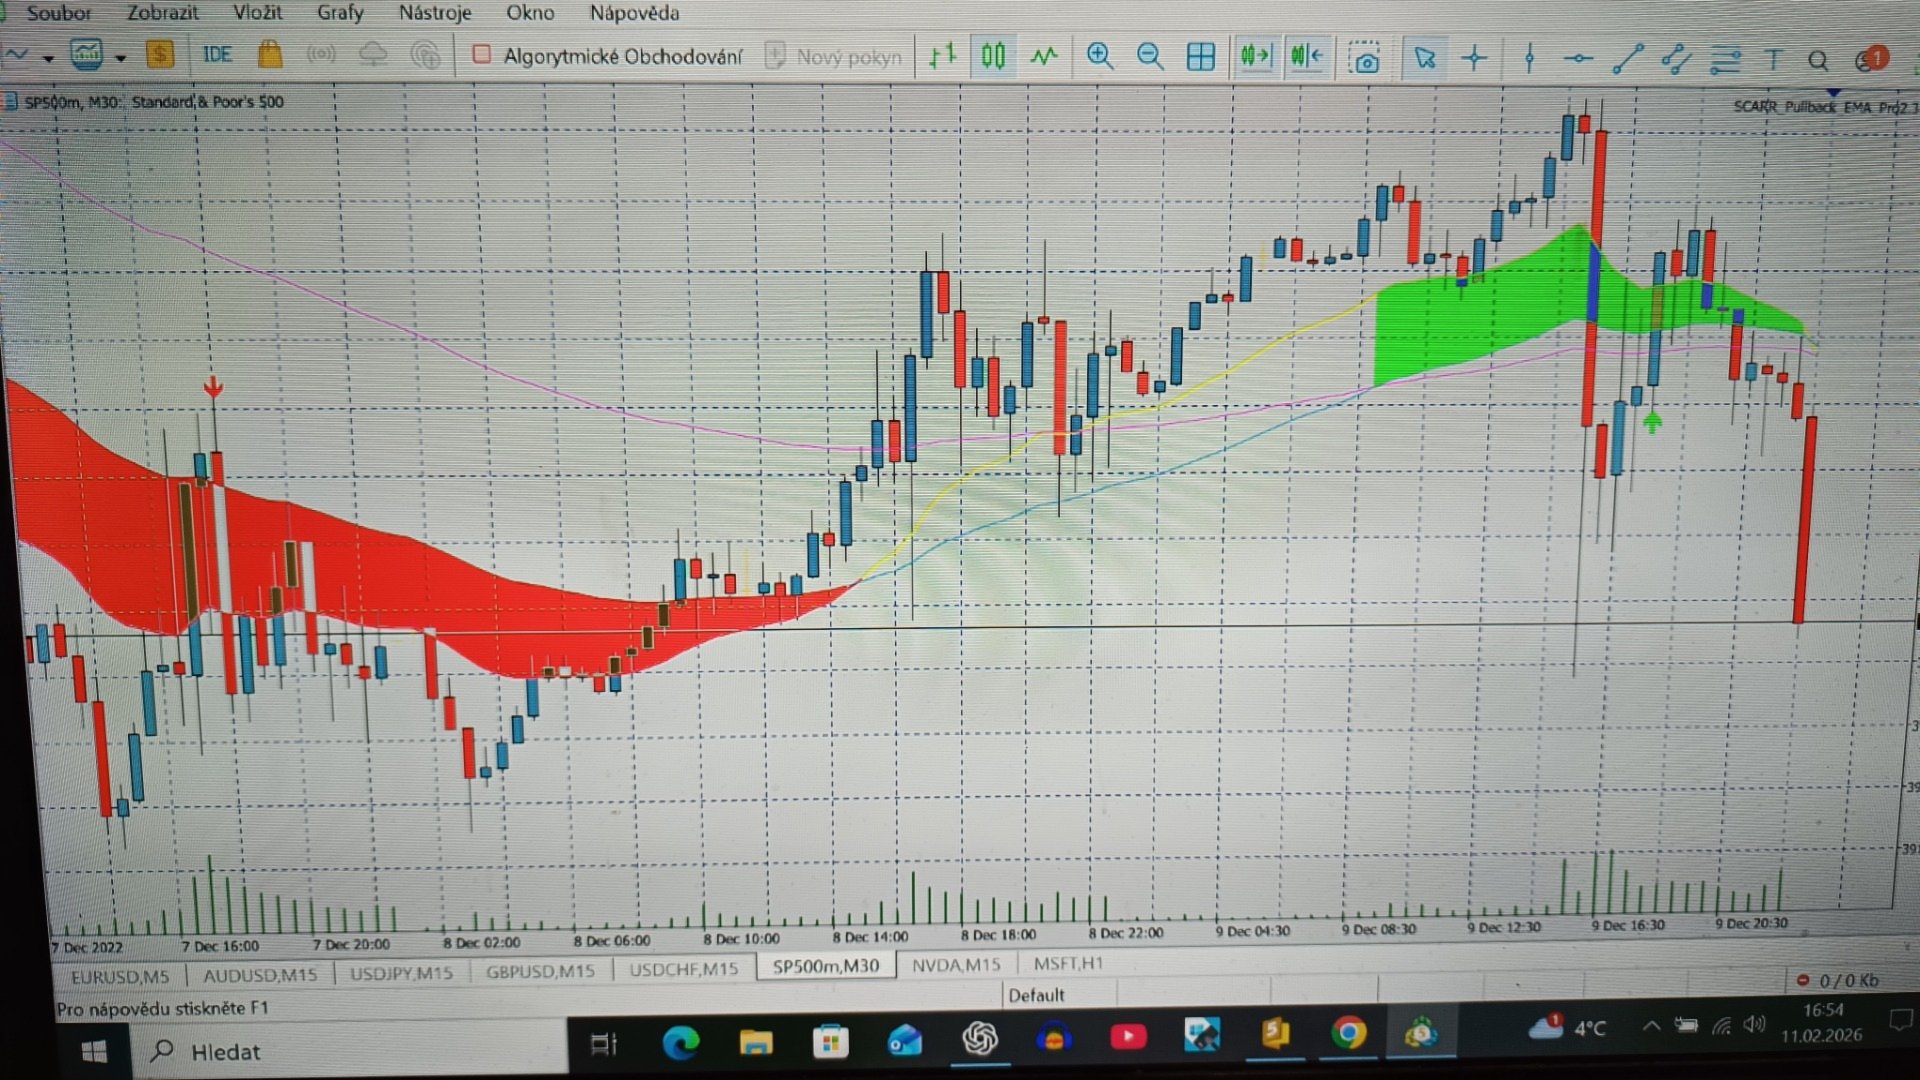
Pullback EMA PRO je pokročilý technický indikátor pro MetaTrader 5, který vizualizuje pullbacky trendu pomocí EMA 20 a EMA 50 , objemu trhu a barevných zón mezi EMA. Indikátor zobrazuje šipky PB LONG / PB SHORT pro snadnou identifikaci potenciálních obchodních příležitostí a je vhodný pro více časových rámců (M1, M5, M15, H1).

Klíčové vlastnosti:

  • Dynamické zóny mezi EMA 20 a EMA 50

  • Šipky pro potenciální signály PB LONG / PB SHORT

  • Vizualizace objemu trhu

  • Funguje napříč více časovými rámcemi

  • Snadná integrace do strategií trend + pullback

Upozornění:
Tento indikátor slouží pouze pro účely technické analýzy a neposkytuje finanční poradenství ani obchodní signály. Nespoléhejte se výhradně na tento nástroj pro obchodní rozhodnutí. Vždy používejte správné řízení rizik a nejprve otestujte signály na demo účtu.


추천 제품
Color Histogram Volume Set
Ricardo Almeida Branco
Do you use volume in your reading of the market? Certainly many traders use it, and do not imagine operating without it. The Color Histogram Volume Set indicator allows the user to choose the value that he considers interesting to monitor. When you pass this you will have visual confirmation and if you want you will also have the audible alert that is given by the indicator. Of course, there are other ways to try to find a high volume, such as assessing whether the volume is above av
VectorMomentum
Alberto Cejudo
Indcador/Oscilador basado en el concepto de la física clásica, "Cantidad de movimiento". Fácilmente adaptable a diferentes pares y activos, como a períodos de time frame. Los parámetros de entrada son los que siguen, y pueden modificarse por el usuario: TrendPeriod  = 14;      // Trend period Smooth       = 3;       // Smoothing period TriggerUp    =  0.05;   // Trigger up level TriggerDown  = -0.05;   // Trigger down level
Delta Footprint Oscillator – Professional Order Flow Tool for MT5 The Delta Footprint Oscillator is a powerful order-flow indicator that lets you see buy/sell pressure directly inside your chart. It tracks micro-price movements tick-by-tick and calculates real-time Delta , Delta% , and a full per-bar footprint history . Perfect for scalpers, day traders, volume/flow traders, and anyone who wants deeper insight into market aggression. Key Features Real order-flow delta from tick-based bid/ask m
GRat Clusters  is an indicator that shows various data in the form of clusters on a price chart: volume, delta, ratio of sales and purchases, etc. It allows you to visually see the market profile in real time and on history at a given depth. Capabilities 1.8 types of cluster data: volume, delta, purchases   and sales , volume and delta, imbalance between sales and purchases , volume profile, delta profile, buy and sell profile. 2. A cluster period can be either any available in MT5 timeframe or
Horizon Prime Consensus - Professional Multi-Dashboard for Trend Confirmation Horizon Prime Consensus is a powerful MT5 custom indicator that precisely detects the "consensus" point when three of the most highly regarded classic technical indicators (MA, MACD, and RSI) align perfectly into the same direction. It features a robust multi-symbol and multi-timeframe dashboard, allowing you to monitor up to 12 different assets across 3 timeframes simultaneously from a single chart. Key Features Tri
Start Midas SD Channel
Ricardo Almeida Branco
5 (1)
Do you already know the Start Midas indicator? What about the Vwap Standard Deviation indicator? And I need to speak again in the book MIDAS Technical Analysis ... The Start Midas SD Channel indicator combines the two in one, bringing the practicality and efficiency of Midas with the statistical calculation of the standard deviation. All of this with the practicality of the White Trader Start indicators, where you can plot the indicator and move them on the screen using keyboard shortcuts
Bullhouse MarketFrequency
Luiz Vinicius Pereira Rocha -
Bullhouse MarketFrequency Description The MarketFrequency indicator displays color-coded histograms that reflect the market’s frequency and momentum over a chosen period. How it helps in trading It helps traders identify buying and selling momentum as well as neutral zones, providing a quick visual reference for potential market shifts. ️ How to use Simply set the desired period (default: 14 candles). The histogram will plot automatically in a separate window, showing momentum with fou
다중 시간대 및 사용자 정의 설정이 가능한 이동 평균선 이동 평균선은 모든 트레이더에게 필수적인 도구입니다. 당사의 고급 이동 평균선 지표는 표준을 뛰어넘어, 비교할 수 없는 유연성과 제어 기능을 제공합니다. 이 지표를 사용하면 현재 차트에 모든 시간대의 이동 평균선을 표시하여, 독특한 관점을 제공하고 놓쳤을 수 있는 추세를 발견하는 데 도움이 됩니다. 주요 특징: 다중 시간대 기능: 현재 차트에 모든 시간대(예: H4, Daily, Weekly)의 이동 평균선을 직접 표시합니다. 사용자 정의 설정: 이동 평균선의 기간 , 이동 및 유형 (SMA, EMA, SMMA, LWMA)을 쉽게 조정하여 특정 거래 전략에 맞출 수 있습니다. 직관적인 인터페이스: 이 지표는 사용자 친화적이며 구성하기 쉽게 설계되었습니다. 당사의 다재다능한 이동 평균선 지표를 사용하여 거래 분석을 강화하고 시장에 대한 더 명확한 시각을 얻으세요.
The Session Volume Profile indicator displays the distribution of trade volume across price levels for a specific trading session. It visualizes areas of high and low trading activity, helping traders identify support and resistance zones. The profile's peak, known as the Point of Control (POC), represents the price with the highest traded volume. The inputs of the indicator: volumeBars(Row Size) : Determines the number of price bins or rows for the volume profile. A larger number results in fi
VWAP Bands
Rafael Caetano Pinto
This indicator uses VWAP and projects this VWAP into up to 3 levels, shifted by a percentage of the chart's symbol. How to configure: Choose the symbol and desired graphic time Set the start time of the symbol (in bovespa, WIN and WDO start at 9 o'clock). This time is used as the cutoff reference for VWAP. Check which VWAP period fits the chart better: Ideally, a period when VWAP is not too distant from the chart Set percentage levels: Ideally, you should set levels based on history, so that le
Weis Wave Scouter
Jean Carlos Martins Roso
Weis Wave Scouter는 MetaTrader 5용으로 개발된 혁신적인 지표로, Wyckoff 방법론과 VSA(Volume Spread Analysis)의 검증된 원칙을 결합했습니다. 높은 정확성과 깊이 있는 분석을 원하는 트레이더를 위해 설계되었으며, 누적 거래량 파동 분석을 통해 시장을 전술적으로 읽고 추세 반전 및 지속의 핵심 포인트를 식별하는 데 도움을 줍니다. 이 지표는 선명한 시각적 인터페이스를 제공하며, Classic, NightVision, OceanBreeze 등 다양한 테마의 사용자 지정 가능한 색상 히스토그램을 통해 상승 및 하락 파동을 시각화합니다. 주요 기능에는 거래량 급증 감지, 낮은 활동 영역(DeadZone) 식별, 거래량 기반 파동 반전 경고 설정이 포함되어 있습니다. 또한 노력 대비 결과 분석, 원인과 결과 분석, 수요와 공급 분석 등 Wyckoff 및 VSA 이론의 핵심 요소를 지원합니다. Brick Size, Volume Scale Fact
Useful tool that will notify you when it detects a possible movement by volume input. Fundamentally in Futures. Detects areas of NO OFFER / NO DEMAND. Compare the volume of the candle in progress with the previous ones. If the volume has been decreasing, when the current contracts, surpass the previous one, ALERT! - It can be loaded in the main graphic or windows. - For any temporality. - It warns you with a pop-up window, on which graph the alarm went off. - When the pattern is de
VolumeTracker4X
Oclair Gallacini Prado
VolumeTracker 4X – High-Volume Candle & VWAP Main Description: VolumeTracker 4X automatically identifies the highest-volume candle of the day in the Forex market and calculates the volume-weighted average price (VWAP) from that candle. It draws dynamic channels based on the high and low prices from the highest-volume candle to the current candle , helping you visualize key support and resistance areas . Created for traders who want more precise decisions using real trading volume as a reference.
MTF VWAP Indicator - Quick Overview   This indicator shows you where institutional money is flowing across multiple timeframes using Volume Weighted Average Price (VWAP) to identify high-probability trading zones.     What It Actually Does:     1. Tracks Smart Money Levels: - Shows Daily, Weekly, and Monthly VWAP lines where big players (banks, funds) are trading - Tells you if price is above or below these key institutional levels - Shows distance from VWAP as a percentage (tells you how extend
Real Volume N1
Khachik Petrosyan
Real Volume N1 – Accurate Volume Insight for Every Candle The Real Volume N1 indicator works with both real volumes and tick volumes. However, I highly recommend using real volumes only, as tick volumes cannot reliably indicate how much was actually bought or sold. To get the most accurate results, use this indicator with brokers that provide real volume data, Works on any timeframe from m1 to month On every candle, the indicator displays the exact volume, helping professional traders make i
Pull It Back MT5
Salvatore Caligiuri
PROMOTIONAL PERIOD - ONLY 2 COPIES LEFT OF FIRST 10 BUYERS AT PRICE 300,00$!!! CHECK SCREENSHOTS AND COMMENTS FOR OUR STRATEGY RULES AND LIVE TRADES SIGNALS PULL IT BACK  is a revolutionary trading system and a complete strategy with advanced algorithm developed to detect the trend direction after a  PULLBACK , a  RETREACEMENT  or a  KEY LEVEL BOUNCE . The goal of this indicator is to get as many pips as possible from market trend. Following strictly the rules of the strategy, you can become a
LiquidXPro Reverse
Alex Amuyunzu Raymond
LiquidX Pro - Precision Reversal Engine "Professional multi-confluence reversal detector that identifies high-probability tops and bottoms using institutional liquidity sweeps, volume exhaustion, and momentum divergence" Overview LiquidX Pro - Precision Reversal Engine is a sophisticated, professional-grade indicator designed for serious traders who want to catch high-probability market reversals with institutional precision. Stop chasing breakouts that fail—start trading reversals that pay. Thi
Buyer Seller Arrows
Oleksandr Sheyko
Buyer Seller Arrows – 자신 있게 거래하세요! 모든 타임프레임(M1 ~ MN1)에서 매수자와 매도자의 힘을 직관적으로 분석할 수 있는 혁신적인 도구입니다. 이 인디케이터는 색상으로 구분된 퍼센트와 화살표 를 통해 시장 역학을 즉시 파악 할 수 있도록 도와줍니다. 주요 기능: 녹색 위쪽 화살표 = 매수세 우위 빨간색 아래쪽 화살표 = 매도세 우위 각 타임프레임(M1, M5, M15, M30, H1, H4, D1, W1, MN1)의 퍼센트 강도 표시 색상 코드 로 빠른 식별 가능 (선명한 녹색과 빨간색) 작동 원리: 매수 압력과 매도 압력의 균형 을 추적 EMA와 SMA 계산 을 통해 강도 측정 실시간으로 트렌드 우위 를 표시 최적의 진입 및 청산 포인트 를 식별하는 데 도움 트레이더들이 좋아하는 이유: 매우 직관적인 시각화 – 복잡한 차트 없이 순수한 시장 강도만 표시 빠른 의사결정 가능 – 스캘핑 및 스윙 트레이딩에 적합 완전한 사용자 맞춤화 –
Title: Predictive SMC Signals PRO The Ultimate Smart Money (SMC) & ICT Trading Operating System. Precision Execution by Dawe Trading! Trading Smart Money Concepts is one of the most profitable ways to navigate the markets, but manually analyzing multiple timeframes for Order Blocks, Fair Value Gaps, and Market Structure is exhausting and prone to human error.   Predictive SMC Signals PRO , engineered by   Dawe Trading , is a complete, institutional-grade algorithm that transforms complex data i
Markets Heat MT5
Viktor Yatsyshyn
Markets Heat indicator can help you determine correct course of action at current market situation, by calculating market's "heat level". What is market's "heat level"? Well, it's my own way of simplifying complex market conditions to ease decision-making process. How does it work? Most of time market is moving in some narrow range and can't "decide" where to go -> flat market -> cold market. Other times, price goes Up or Down -> making trend movements -> heating the market. More powerful trends
Heiken Ashi Supertrend Combine
Tri Yasin Satrio Adji Pranoto
Headline: Stop Guessing, Start Winning. Unleash the Power of the Heiken Ashi Supertrend Indicator. Body: Are you tired of market noise, confusing charts, and missed opportunities? The Heiken Ashi Supertrend Indicator is the ultimate tool designed to bring clarity and confidence to your trading, once and for all. We've combined two of the most powerful concepts in technical analysis into one seamless, easy-to-use indicator: Crystal-Clear Trends with Heiken Ashi: Say goodbye to choppy price action
MTF Dashboard
Andres Espinoza Curilla
This  RSI, ADX, MA, ATR, CCI   MTF Dashboard v1 – Professional Multi-Timeframe Consensus ======================================================================== Professional-grade Multi-Timeframe (MTF) Dashboard with Intelligent Weighted Consensus A powerful, clean, and CPU-optimized visual tool that combines RSI, ADX, EMA, ATR, and CCI across up to 6 timeframes (W1 to M5) with a dynamic consensus engine. Key Features: • Real MTF analysis using native iRSI, iADX, iMA, iATR, iCCI – no repaint
SAR Vision MTF
Michal Hrubes
SAR Vision MTF – MT5용 다중 타임프레임 Parabolic SAR 지표 SAR Vision MTF 는 상위 타임프레임의 Parabolic SAR 값을 현재 차트에 직접 표시하는 다중 타임프레임 기술 분석 도구입니다. 여러 차트를 전환하지 않고도 더 넓은 시장 추세를 분석하는 데 도움을 줍니다. 주요 기능 다중 타임프레임 기능 – 상위 타임프레임(예: M5, M15, H1, H4)의 SAR 신호를 하위 타임프레임 차트에서 확인할 수 있습니다. 사용자 지정 가능 – 점 크기, 색상 및 선택한 타임프레임을 사용자 취향에 맞게 조절할 수 있습니다. 명확한 시각적 표현 – 각 타임프레임마다 다른 색상을 사용하여 추세 신호를 구분하기 쉽습니다. 가볍고 효율적 – 다양한 차트 유형에서 원활하게 작동하도록 최적화되었습니다. 사용 사례 추세 관찰 – 상위 타임프레임의 SAR 신호를 모니터링하면 현재 차트 움직임에 대한 추가적인 시장 상황을 파악할 수 있습니다. 잠재적 반전 탐지 – 다
DBS Delta
Dmitriy Burlachenko
The delta indicator is used to display the difference between the volume that passed on the exchange at the Ask price and above (market buys) and the volume that passed at the Bid price and below (market sales). This indicator shows the delta of each candle on the timeframe of your choice. The data is displayed as a colored histogram in a separate indicator window. The indicator is calculated from the tick history, therefore, to speed up the calculations and reduce the load on the system, the n
Be notified of every color change of Heiken Ashi (HA) candles. The indicator will trigger past and new signals every time that HA candles change their colors. ( Note : this tool is based on the code of Heiken Ashi indicator developed by MetaQuotes Software Corp.) Features The signals are triggered at closing of last bar/opening of a new bar; Any kind of alerts can be enabled: Dialog Box, Email message, SMS notifications for smartphones and tablets, and Sound alerts; By default, up arrows are pl
The Market Structure Analyzer is a powerful tool designed for traders who follow market structure and smart money concepts. This comprehensive indicator provides a suite of features to assist in identifying key market levels, potential entry points, and areas of liquidity. Here's what it offers: 1. Swing High/Low Detection : Accurately identifies and marks swing highs and lows, providing a clear view of market structure. 2. Dynamic Supply and Demand Zones: Draws precise supply and demand zone
MT5용 Crypto_Forex 지표 Bears Power HTF - Bears Power HTF 오실레이터는 "매도" 진입 시점을 위한 훌륭한 필터입니다. HTF는 상위 시간대를 의미합니다. - Bulls 및 Bears Power 지표는 거래에서 해당 추세의 강도를 측정하는 데 사용됩니다. - Bears Power는 매도 포지션의 강도를 측정합니다. - Bears Power HTF 지표는 가격 변동 진입 시점을 포함하거나 다른 지표와 함께 사용하는 다중 시간대 거래 시스템에 매우 적합합니다. - 이 지표를 사용하면 상위 시간대의 Bears Power를 현재 차트에 추가할 수 있습니다. - 지표에는 0 레벨 교차 시 모바일 및 PC 알림 기능이 내장되어 있습니다. 여기를 클릭하여 고품질 트레이딩 로봇과 지표를 확인하세요! 이 제품은 MQL5 웹사이트에서만 제공되는 오리지널 제품입니다.
Simple and fast MACD oscillator with MACD and signal lines and two-color histogram. I wasn't happy with the Meta Trader MACD oscillator as it's not immediate to read and the other ones I tried felt a bit laggy or added unneeded features on top, so I decide to make one that feels familiar to me. I hope you will find it useful! Contact me for any issues or bugs and I will try to help the best I can.
11 Modules Description & Final Analyzer Trading Guide 1. Reaction Engine 2.0 Purpose : Measures market pressure by analyzing tick movements, volume, and speed within a time window.   How it works : Calculates weighted price changes, considers tick velocity and volatility, and applies EMA smoothing.   Trading use : Strong positive values indicate buying pressure Strong negative values indicate selling pressure Use as confirmation for entry/exit signals 2. Flow Pattern Detector Purpose : Identifie
Supply Demand areas
Makarii Gubaydullin
공급/수요 구역: 과거에 가격이 여러 번 접근한 관찰 가능한 영역. 다기능 유틸리티:  66+ 기능 , 이 인디케이터 포함  |   문의 사항이 있으면 저에게 연락  하세요  |  MT4 버전 이 인디케이터는 가격이 다시 반전될 수 있는 위치를 보여줍니다. 일반적으로 가격이 해당 수준에서 거부된 횟수가 많을수록 그 수준은 더 중요합니다. 입력 설정에서   다음 사항을 조정할 수 있습니다: 약한 구역 을 활성화 또는 비활성화합니다; 구역 설명 을 표시하거나 숨깁니다; 글꼴 크기;   기본 색상 설정:   서포트와 저항 각각에 대해 별도로: 선택한 색상은 약한 구역에서 덜 강렬하게 표시되어 차트를 시각적으로 분석하는 데 도움이 됩니다; 수요와 공급 지대 는 가격 차트에서 이전에 상당한 매수(수요) 또는 매도(공급)가 발생한 주요 영역입니다. 이러한 지대는 트레이더가 가격 움직임의 잠재적 반전 또는 지속 을 예측하는 데 도움이 됩니다. 수요와 공급 트레이딩은 추세선, 이동 평균 또는 오
이 제품의 구매자들이 또한 구매함
SuperScalp Pro
Van Minh Nguyen
5 (14)
SuperScalp Pro – 고급 다중 필터 스캘핑 인디케이터 시스템 SuperScalp Pro는 클래식 Supertrend와 여러 지능형 확인 필터를 결합한 고급 스캘핑 인디케이터 시스템입니다. 해당 인디케이터는 M1부터 H4까지 모든 타임프레임에서 효율적으로 작동하며, 특히 XAUUSD, BTCUSD 및 주요 외환 통화쌍에 적합합니다. 독립형 시스템으로 사용하거나 기존 거래 전략에 유연하게 통합할 수 있습니다. 이 인디케이터는 11개 이상의 필터를 통합하며, 빠른/느린 EMA, 추세 판별용 3개의 EMA, EMA 기울기(EMA slope), RSI, ADX, 거래량(Volume), VWAP, 볼린저 밴드 돌파(Bollinger Bands Breakout) 및 MACD 다이버전스 필터 등을 포함합니다. 스마트 캔들 필터는 캔들 종가를 확인하여 약한 신호를 제거하고, 3 EMA와 MACD 다이버전스 필터를 결합한 추세 인식 메커니즘은 더 높은 승률의 신호를 선별하는 데 도움을 줍니
Azimuth Pro
Ottaviano De Cicco
5 (6)
LAUNCH PROMO Azimuth Pro price is initially set at 299$ for the first 100 buyers. Final price will be 499$ . THE DIFFERENCE BETWEEN RETAIL AND INSTITUTIONAL ENTRIES ISN'T THE INDICATOR — IT'S THE LOCATION. Most traders enter at arbitrary price levels, chasing momentum or reacting to lagging signals. Institutions wait for price to reach structured levels where supply and demand actually shift. Azimuth Pro maps these levels automatically: swing-anchored VWAP, multi-timeframe structure lines, an
Divergence Bomber
Ihor Otkydach
4.9 (86)
이 지표를 구매하신 분께는 다음과 같은 혜택이 무료로 제공됩니다: 각 거래를 자동으로 관리하고, 손절/익절 수준을 설정하며, 전략 규칙에 따라 거래를 종료하는 전용 도우미 툴 "Bomber Utility" 다양한 자산에 맞게 지표를 설정할 수 있는 셋업 파일(Set Files) "최소 위험", "균형 잡힌 위험", "관망 전략" 모드로 설정 가능한 Bomber Utility의 셋업 파일 이 전략을 빠르게 설치, 설정, 시작할 수 있도록 돕는 단계별 영상 매뉴얼 주의: 위의 모든 보너스를 받기 위해서는 MQL5 개인 메시지 시스템을 통해 판매자에게 연락해 주세요. 독창적인 커스텀 지표인 “Divergence Bomber(다이버전스 봄버)”를 소개합니다. 이 지표는 MACD 다이버전스(괴리) 전략을 기반으로 한 올인원(All-in-One) 거래 시스템입니다. 이 기술 지표의 주요 목적은 가격과 MACD 지표 간의 다이버전스를 감지하고, **향후 가격이 어느 방향으로 움직일지를 알려주는
Entry In The Zone and SMC Multi Timeframe is a real-time market analysis tool developed based on Smart Money Concepts (SMC). It is designed to analyze market structure, price direction, reversal points, and key zones across multiple timeframes in a systematic way. The system displays Points of Interest (POI) and real-time No Repaint signals, with instant alerts when price reaches key zones or when signals occur within those zones. It functions as both an Indicator and a Signal System (2-in-1), c
CGE Trading Suite
Carl Gustav Johan Ekstrom
5 (1)
CGE Trading Suite delivers the analytical edge typically reserved for professional trading desks. The platform integrates a full suite of analytical tools into one seamless workflow: dynamic grid mapping, liquidity behavior analysis, ECM, trend lines, MIDAS, trade cycles, and directional channel projections. Together, these provide a unified view of market structure and momentum. Directional clarity is further enhanced by the capital flow index, which measures currency basket strength to identif
이 지표를 구매하면 제 프로페셔널 트레이드 매니저를 무료로 드립니다. 우선 이 거래 시스템이 리페인팅, 리드로잉 및 레이그 인디케이터가 아니라는 점을 강조하는 것이 중요합니다. 이는 수동 및 로봇 거래 모두에 이상적인 것으로 만듭니다. 온라인 강좌, 설명서 및 프리셋 다운로드. "스마트 트렌드 트레이딩 시스템 MT5"은 새로운 및 경험이 풍부한 트레이더를 위해 맞춤형으로 제작된 종합적인 거래 솔루션입니다. 10개 이상의 프리미엄 인디케이터를 결합하고 7개 이상의 견고한 거래 전략을 특징으로 하여 다양한 시장 조건에 대한 다목적 선택이 가능합니다. 트렌드 추종 전략: 효과적인 트렌드 추이를 타기 위한 정확한 진입 및 손절 관리를 제공합니다. 반전 전략: 잠재적인 트렌드 반전을 식별하여 트레이더가 범위 시장을 활용할 수 있게 합니다. 스캘핑 전략: 빠르고 정확한 데이 트레이딩 및 단기 거래를 위해 설계되었습니다. 안정성: 모든 인디케이터가 리페인팅, 리드로잉 및 레이그가 아니므로 신뢰
Power Bar MT5
Daniel Stein
실제 자금을 투입하기 전에 어떤 전략이 내 심볼에서 효과적인지 확인하세요. Power Bar는 모든 심볼과 모든 타임프레임에서 극단적인 가격 바 를 감지한 다음, 3가지 다른 트레이딩 전략을 즉시 백테스트하여 승률, 수익 팩터, 손익을 나란히 비교할 수 있습니다. 모든 것이 하나의 인터랙티브 패널에 담겨 있습니다. 추측 없음. 커브 피팅 없음. 오직 데이터뿐입니다. Power Bar가 특별한 이유 대부분의 인디케이터는 신호를 주고 그것이 효과가 있는지는 추측에 맡깁니다. Power Bar는 한 걸음 더 나아갑니다 - 모든 신호를 세 가지 전략 에 대해 테스트하고 통계를 보여줍니다. FlipFlop, Momentum, Reversal을 원클릭으로 전환하고 숫자가 즉시 변하는 것을 확인하세요. FlipFlop - 항상 포지션 유지. 신호에 진입하고, 반대 신호에 청산. 당사의 연구에 따르면 US30, US500, DAX와 같은 추세가 있는 지수에서 가장 효과적입니다. Momentum
FX Trend MT5 NG
Daniel Stein
5 (4)
FX Trend NG: 차세대 멀티 마켓 트렌드 인텔리전스 개요 FX Trend NG 는 다중 시간 프레임 기반의 전문 트렌드 분석 및 시장 모니터링 도구입니다. 몇 초 만에 전체 시장 구조를 파악할 수 있도록 설계되었습니다. 여러 차트를 일일이 전환할 필요 없이, 어떤 종목이 추세에 있는지, 어디에서 모멘텀이 약화되고 있는지, 그리고 어떤 시간 프레임이 서로 정렬되어 있는지 즉시 확인할 수 있습니다. 출시 기념 특별 혜택 – FX Trend NG 를 $30 (6개월) 또는 $80 평생 라이선스 로 이용할 수 있습니다. 이미 Stein Investments 고객이신가요? -> 메시지를 보내 전용 고객 그룹에 참여하세요. 설정이나 사용 방법이 필요하신가요? -> Stein Investments 공식 페이지 를 방문하세요. 1. FX Trend NG가 특별한 이유 3단계 추세 로직 – 단순한 Buy / Sell이 아닙니다 • 대부분의 지표는 Buy 또는 Sell 두 가지 상태만 제
Trend Screener Pro MT5
STE S.S.COMPANY
4.84 (103)
트렌드 표시기, 트렌드 트레이딩 및 필터링을 위한 획기적인 고유 솔루션, 하나의 도구 안에 내장된 모든 중요한 트렌드 기능! Forex, 상품, 암호 화폐, 지수 및 주식과 같은 모든 기호/도구에 사용할 수 있는 100% 다시 칠하지 않는 다중 시간 프레임 및 다중 통화 표시기입니다. Trend Screener는 차트에 점이 있는 화살표 추세 신호를 제공하는 효율적인 지표 추세 추종 지표입니다. 추세 분석기 표시기에서 사용할 수 있는 기능: 1. 트렌드 스캐너. 2. 최대 이익 분석이 있는 추세선. 3. 추세 통화 강도 측정기. 4. 경고가 있는 추세 반전 점. 5. 경고가 있는 강력한 추세 점. 6. 추세 화살표 Trend Screener Indicator가 있는 일일 분석 예, 일일 신호 성능...등은 여기에서 찾을 수 있습니다. 여기를 클릭하십시오. LIMITED TIME OFFER : Trend Screener Indicator는 50$ 및 평생 동안만 사용할 수 있습니다.
RelicusRoad Pro MT5
Relicus LLC
5 (24)
RelicusRoad Pro: 퀀트 시장 운영 체제 70% 할인 평생 이용권 (한정 시간) - 2,000명 이상의 트레이더와 함께하세요 왜 대부분의 트레이더는 "완벽한" 지표를 가지고도 실패할까요? 진공 상태에서 단일 개념 만으로 거래하기 때문입니다. 문맥 없는 신호는 도박입니다. 지속적인 승리를 위해서는 컨플루언스(중첩) 가 필요합니다. RelicusRoad Pro는 단순한 화살표 지표가 아닙니다. 완전한 퀀트 시장 생태계 입니다. 독점적인 변동성 모델링을 사용하여 가격이 이동하는 "공정 가치 로드"를 매핑하고, 단순 노이즈와 실제 구조적 돌파를 구분합니다. 추측은 그만두세요. 기관급 로드 로직으로 거래를 시작하세요. 핵심 엔진: "Road" 알고리즘 시스템의 중심에는 시장 상황에 실시간으로 적응하는 동적 변동성 채널인 Road Algo 가 있습니다. 세이프 라인(평형) 과 가격이 수학적으로 반전될 가능성이 높은 확장 레벨 을 투영합니다. Simple Road: 일반적인 시장을 위
Currency Strength Dashboard Pro
Anastasia Danilova
5 (1)
Currency Strength Dashboard Pro MetaTrader 5 를 위한 실시간 통화 강도 분석 전문 대시보드 입니다. 이 지표는 8개의 주요 통화 (EUR, USD, GBP, JPY, CHF, AUD, CAD, NZD)의 강도를 계산하고, 28개의 통화쌍 을 동시에 여러 시간 프레임에서 분석하여 표시합니다. 이 대시보드는 트레이더가 추가 계산이나 여러 차트 간 전환 없이 한눈에 시장 전체 상황을 파악 할 수 있도록 해줍니다. 계산 방법 이 지표는 고급 수학적 통화 강도 분석 방법 을 기반으로 합니다. 이는 유사한 지표에서 널리 사용되는 RSI 기반 방법 보다 더 정확하고 객관적인 결과를 제공합니다. 이 방법은 28개의 모든 통화쌍 간의 관계를 동시에 분석 하여 시장에서 실제로 형성되는 힘의 균형을 보다 명확하고 편향 없이 보여줍니다. 실시간 대시보드 메인 테이블에는 8개의 통화 에 대한 전체 데이터가 표시됩니다. Rank (순위) — 전체 강도 기준 통화 순위, 1
Btmm state engine pro
Garry James Goodchild
5 (3)
BTMM State Engine Pro is a MetaTrader 5 indicator for traders who use the Beat The Market Maker approach: Asian session context, kill zone timing, level progression, peak formation detection, and a multi-pair scanner from a single chart. It combines cycle state logic with a built-in scanner dashboard so you do not need the same tool on many charts at once. What it does Draws the Asian session range; session times can follow broker server offset or be set in inputs. Tracks level progression (L
Meridian Pro
Ottaviano De Cicco
5 (1)
Meridian Pro: Professional Multi-Timeframe Trend Matrix for MT5 Overview Meridian Pro is a multi-timeframe trend matrix by Merkava Labs that compresses directional state, strength, momentum condition and matrix agreement into one compact panel. One adaptive engine, applied consistently from M1 to W1. No per-symbol tuning. No indicator stacking. One structured readout across every asset and every timeframe. Launch Offer — Get Meridian Pro for USD 99 (introductory). Regular price: USD 149. 1. Why
Atomic Analyst MT5
Issam Kassas
3.94 (31)
우선적으로 언급할 점은이 거래 지표가 다시 그리지 않고 지연되지 않으며 이를 통해 수동 및 로봇 거래 모두에 이상적이라는 점입니다. 사용자 매뉴얼: 설정, 입력 및 전략. Atomic Analyst는 가격의 강도와 모멘텀을 활용하여 시장에서 더 나은 이점을 찾는 PA Price Action Indicator입니다. 고급 필터를 장착하여 잡음과 거짓 신호를 제거하고 거래 잠재력을 높이는 데 도움이 됩니다. 복잡한 지표의 다중 레이어를 사용하여 Atomic Analyst는 차트를 스캔하고 복잡한 수학적 계산을 간단한 신호와 색상으로 변환하여 초보 트레이더가 이해하고 일관된 거래 결정을 내릴 수 있도록합니다. "Atomic Analyst"는 새로운 및 경험이 풍부한 트레이더를위한 종합적인 거래 솔루션입니다. 프리미엄 지표와 최고 수준의 기능을 하나의 거래 전략에 결합하여 모든 종류의 트레이더에 대한 다재다능한 선택지가되었습니다. 인트라데이 거래 및 스캘핑 전략 : 빠르고 정확한 일일
Quantum TrendPulse
Bogdan Ion Puscasu
5 (22)
SuperTrend   ,   RSI   ,   Stochastic   의 힘을 하나의 포괄적인 지표로 결합하여 트레이딩 잠재력을 극대화하는 궁극의 트레이딩 도구   인 Quantum TrendPulse를   소개합니다. 정밀성과 효율성을 추구하는 트레이더를 위해 설계된 이 지표는 시장 추세, 모멘텀 변화, 최적의 진입 및 종료 지점을 자신 있게 식별하는 데 도움이 됩니다. 주요 특징: SuperTrend 통합:   주요 시장 추세를 쉽게 따라가고 수익성의 물결을 타세요. RSI 정밀도:   매수 과다 및 매도 과다 수준을 감지하여 시장 반전 시점을 파악하는 데 적합하며 SuperTrend 필터로 사용 가능 확률적 정확도:   변동성이 큰 시장에서 숨겨진 기회를 찾기 위해 확률적 진동   을 활용하고 SuperTrend의 필터로 사용 다중 시간대 분석:   M5부터 H1 또는 H4까지 다양한 시간대에 걸쳐 시장을 최신 상태로 유지하세요. 맞춤형 알림:   맞춤형 거래 조건이 충족되면
FX Power MT5 NG
Daniel Stein
5 (31)
FX Power: 통화 강세 분석으로 더 스마트한 거래 결정을 개요 FX Power 는 어떤 시장 상황에서도 주요 통화와 금의 실제 강세를 이해하기 위한 필수 도구입니다. 강한 통화를 매수하고 약한 통화를 매도함으로써 FX Power 는 거래 결정을 단순화하고 높은 확률의 기회를 발견합니다. 트렌드를 따르거나 극단적인 델타 값을 사용해 반전을 예측하고자 한다면, 이 도구는 귀하의 거래 스타일에 완벽히 적응합니다. 단순히 거래하지 말고, FX Power 로 더 스마트하게 거래하세요. 1. FX Power가 거래자에게 매우 유용한 이유 통화와 금의 실시간 강세 분석 • FX Power 는 주요 통화와 금의 상대적 강세를 계산하고 표시하여 시장 역학에 대한 명확한 통찰력을 제공합니다. • 어떤 자산이 앞서고 있고 어떤 자산이 뒤처지는지 모니터링하여 보다 현명한 거래 결정을 내릴 수 있습니다. 포괄적인 멀티 타임프레임 뷰 • 단기, 중기 및 장기 타임프레임에서 통화와 금의 강세를
OmniSync Projection
Antonio-alin Teculescu
5 (1)
Chronos Fractal Engine is an innovative price projection indicator for MetaTrader 5, designed to transform your technical analysis by intelligently identifying and projecting historical price patterns. Built upon an advanced correlation algorithm and the fractal principles of the market, this powerful tool visualizes potential future price movements, giving you a unique edge in your trading decisions. What is Chronos Fractal Engine? At its core, the Chronos Fractal Engine employs a sophisticat
Gann Made Easy 는 mr.의 이론을 사용하여 최고의 거래 원칙을 기반으로 하는 전문적이고 사용하기 쉬운 Forex 거래 시스템입니다. W.D. 간. 이 표시기는 Stop Loss 및 Take Profit Levels를 포함하여 정확한 BUY 및 SELL 신호를 제공합니다. PUSH 알림을 사용하여 이동 중에도 거래할 수 있습니다. 구매 후 거래 방법 안내 및 유용한 추가 지표를 무료로 받으시려면 저에게 연락주세요! 아마도 Gann 거래 방법에 대해 이미 여러 번 들었을 것입니다. 일반적으로 Gann의 이론은 초보자 거래자뿐만 아니라 이미 거래 경험이 있는 사람들에게도 매우 복잡한 것입니다. Gann의 거래 방식은 이론적으로 적용하기 쉽지 않기 때문입니다. 나는 그 지식을 연마하고 Forex 지표에 최고의 원칙을 적용하기 위해 몇 년을 보냈습니다. 표시기는 적용하기가 매우 쉽습니다. 차트에 첨부하고 간단한 거래 권장 사항을 따르기만 하면 됩니다. 지표는 지속적으로 시장 분석
ARICoins
Temirlan Kdyrkhan
ARICoin is a powerful trading companion designed to generate high-probability entry signals with dynamic TP/SL/DP levels based on volatility. Built-in performance tracking shows win/loss stats, PP1/PP2 hits, and success rates all updated live. Key Features: Buy/Sell signals with adaptive volatility bands Real-time TP/SL/DP levels based on ATR Built-in MA Filter with optional ATR/StdDev volatility Performance stats panel (Success, Profit/Loss, PP1/PP2) Alerts via popup, sound, push, or email Cust
Grabber System MT5
Ihor Otkydach
4.83 (23)
탁월한 기술적 지표인 Grabber를 소개합니다. 이 도구는 즉시 사용 가능한 “올인원(All-Inclusive)” 트레이딩 전략으로 작동합니다. 하나의 코드 안에 강력한 시장 기술 분석 도구, 매매 신호(화살표), 알림 기능, 푸시 알림이 통합되어 있습니다. 이 인디케이터를 구매하신 모든 분들께는 다음의 항목이 무료로 제공됩니다: Grabber 유틸리티: 오픈 포지션을 자동으로 관리하는 도구 단계별 영상 매뉴얼: 설치, 설정, 그리고 실제 거래 방법을 안내 맞춤형 세트 파일: 인디케이터를 빠르게 자동 설정하여 최고의 성과를 낼 수 있도록 도와줍니다 다른 전략은 이제 잊어버리세요! Grabber만이 여러분을 새로운 트레이딩의 정점으로 이끌어 줄 수 있습니다. Grabber 전략의 주요 특징: 거래 시간 프레임: M5부터 H4까지 거래 가능한 자산: 어떤 자산이든 사용 가능하지만, 제가 직접 테스트한 종목들을 추천드립니다 (GBPUSD, GBPCAD, GBPCHF, AUDCAD, AU
RFI levels PRO MT5
Roman Podpora
3.67 (3)
이 지표는 추세 반전 지점과 가격 반등 영역을 정확하게 보여줍니다.       주요 투자자들   . 새로운 트렌드가 형성되는 곳을 파악하고 최대한 정확하게 의사결정을 내리며 모든 거래를 완벽하게 통제합니다. TREND LINES PRO   지표와 함께 사용할 때 최대의 잠재력을 발휘합니다.  VERSION MT4 지표가 보여주는 내용: 새로운 추세의 시작 시 활성화되는 반전 구조 및 반전 수준. 최소한의 위험 대비 수익률을 갖는 이익 실현   (TAKE PROFIT)   및   손절매(STOP LOSS)   레벨 표시       RR 1:2   . 지능형 손실 감소 로직이 적용된 손절매 기능. 지정된 지표에서 두 가지 추세 유형에 대한 반전 패턴을 표시합니다. 지표: 트렌드를 따라   트렌드 라인 프로   (글로벌 트렌드 변화) 트렌드 프로   (빠른 트렌드 변화) 간단하고 효과적입니다       스캐너       실시간 추세 (신규). 다중 시간 프레임 도구 필터링. 표시하다  
ARIPoint
Temirlan Kdyrkhan
ARIPoint is a powerful trading companion designed to generate high-probability entry signals with dynamic TP/SL/DP levels based on volatility. Built-in performance tracking shows win/loss stats, PP1/PP2 hits, and success rates all updated live. Key Features: Buy/Sell signals with adaptive volatility bands Real-time TP/SL/DP levels based on ATR Built-in MA Filter with optional ATR/StdDev volatility Performance stats panel (Success, Profit/Loss, PP1/PP2) Alerts via popup, sound, push, or email Cu
Crystal Heikin Ashi Signals
Muhammad Jawad Shabir
5 (1)
Crystal Heikin Ashi Signals - Professional Trend & Signal Detection Indicator Advanced Heikin Ashi Visualization with Intelligent Signal System for Manual & Automated Trading Final Price: $149 ---------> Price goes up $10 after every 10 sales . Limited slots available — act fast . Overview Crystal Heikin Ashi Signals is a professional-grade MetaTrader 5 indicator that combines pure Heikin Ashi candle visualization with an advanced momentum-shift detection system. Designed for both manual traders
Pips Stalker mt5
Abdulkarim Karazon
5 (2)
핍스 스토커는 롱 숏 화살표 유형의 지표로, 모든 수준의 트레이더들이 더 나은 시장 결정을 내릴 수 있도록 돕습니다. 이 지표는 절대 재도색되지 않고 RSI를 주요 신호 로직으로 사용합니다. 화살표가 주어지면 절대 다시 도색되거나 다시 도색되지 않고, 화살표 지연도 없습니다. MT4 버전 <---- PIPS STALKER ARROW 기능 : 통계 패널 전체 승률 %와 연속 최대 승리 및 패배 거래 등 유용한 통계, 기타 유용한 정보를 보여주는 독특한 정보 대시보드입니다. TP와 SL, 내장된 자금 관리 이 지표는 각 화살표마다 TP와 SL 객체를 제공하므로, 거래자는 자금 및 위험 관리를 내장하고 있으며, SL은 ATR을 기반으로 하며, TP는 현재 ATR SL 가치를 기반으로 한 위험 대비 보상 비율을 기반으로 합니다. 재도색 없음, 높은 조정 가능성 이 인디케이터는 신호 품질 개선을 위한 다양한 옵션을 제공하여 어떤 쌍에서도 약간의 기간 조정만으로 작동하며, 패널은
중국천기 글로벌 시장 상태 분석 시스템은 어떤 종목과 어떤 시간 주기에도 사용할 수 있는 MT5 시장 상태 분석 지표입니다. 현재 시장이 박스권인지 추세장인지 더 명확하게 판단할 수 있도록 도와주며, 어떤 가격 구간이 더 주목할 가치가 있고 어떤 구간은 매력적으로 보이지만 실제로는 위험이 더 높은지 판단하는 데 도움을 줍니다. 중국천기 글로벌 시장 상태 분석 시스템은 시장 상태, 가격 구조, 방향 변화를 더 명확하게 이해할 수 있도록 설계된 분석형 지표 시스템입니다. 단순히 매수나 매도 신호만 보여주기 위한 도구가 아닙니다. 현재 시장이 박스권인지 추세장인지, 그리고 지금의 가격 구간이 기회에 더 가까운지 아니면 위험에 더 가까운지를 더 분명하게 이해하도록 돕는 것이 핵심입니다. 많은 트레이더들은 매일 같은 질문을 반복합니다. 이미 가격이 많이 떨어졌는데 여기서 반등할까? 지금 매수해야 할까? 이 자리가 진짜 저점일까, 아니면 가짜 저점일까? 이 반등 이후에도 시장은 다시 더 내려갈
Trend Hunter MT5
Andrey Tatarinov
5 (4)
Trend Hunter 는 Forex, 암호화폐 및 CFD 시장에서 작업하기 위한 추세 지표입니다. 이 지표의 특별한 특징은 가격이 추세선을 약간 돌파할 때 신호를 변경하지 않고 자신있게 추세를 따른다는 것입니다. 표시기는 다시 그려지지 않으며 막대가 닫힌 후에 시장 진입 신호가 나타납니다. 추세를 따라 이동할 때 표시기는 추세 방향에 대한 추가 진입점을 표시합니다. 이러한 신호를 바탕으로 작은 StopLoss로 거래할 수 있습니다. Trend Hunter 는 정직한 지표입니다. 표시 신호 위로 마우스를 가져가면 신호의 잠재적 이익과 가능한 중지가 표시됩니다. 새로운 신호가 나타나면 다음 알림을 받을 수 있습니다. 알리다 푸시 알림 이메일로 알림 텔레그램 알림 차트 스크린샷도 텔레그램으로 전송되므로 거래 결정을 내리기 위해 단말기를 열 필요가 없습니다. 표시 신호는 텔레그램 채널 https://www.mql5.com/ko/market/product/11085#!tab=com
Dragos Clean Execution
Dragos-cristian Craciun
Please contact me  https://t.me/RomaniaTrading Dragos Clean Execution is a price action execution indicator designed to simplify a high-probability intraday workflow based on liquidity sweep, market structure shift, and fair value gap confirmation. The indicator combines a higher-timeframe sweep concept with a lower-timeframe execution model to help traders identify cleaner entry locations, define invalidation clearly, and visualize realistic take-profit targets directly on the chart. Instead of
Auto Optimized Parabolic RSI: 고급 3D 모멘텀 엔진 대부분의 개인 투자자용 보조지표는 시장의 변동성이 변하는 순간 무용지물이 되는 정적인 입력값에 의존하기 때문에 실패합니다. Auto Optimized Parabolic RSI는 자체적인 수학적 우위를 지속적으로 재계산하여 "보조지표 노후화" 문제를 해결하며, 기관급 퀀트 트레이딩의 적응력을 귀하의 MT5 터미널에 직접 제공합니다. 핵심 이점: 맞춤형 인메모리 3D 최적화 표준 자동 최적화 도구들은 일반적인 보조지표 호출로 터미널에 과부하를 일으켜 MT5 플랫폼을 멈추게 하는 경우가 많습니다. 이 도구는 이러한 병목 현상을 완전히 우회합니다. 맞춤형 네이티브 RAM 기반 계산기로 구축된 내부 엔진은 차트를 로드하거나 타임프레임을 변경할 때마다 빛처럼 빠른 3D 그리드 검색을 실행합니다. RSI 기간(주기), SAR 스텝(가속도) 및 SAR 최대치(속도 제한)를 동시에 스캔하여 플랫폼 지연 없이 수만 개의 파라
소개       Quantum Breakout PRO   , 브레이크아웃 존 거래 방식을 변화시키는 획기적인 MQL5 지표! 13년 이상의 거래 경험을 가진 숙련된 트레이더 팀이 개발한       퀀텀 브레이크아웃 PRO       혁신적이고 역동적인 브레이크아웃 존 전략으로 거래 여정을 새로운 차원으로 끌어올리도록 설계되었습니다. Quantum Breakout Indicator는 5개의 이익 목표 영역이 있는 브레이크아웃 영역의 신호 화살표와 브레이크아웃 상자를 기반으로 한 손절 제안을 제공합니다. 초보자 거래자와 전문 거래자 모두에게 적합합니다. Quantum EA 채널:       여기를 클릭하세요 중요한! 구매 후 설치 매뉴얼을 받으려면 개인 메시지를 보내주십시오. 추천: 기간: M15 통화쌍: GBPJPY, EURJPY, USDJPY,NZDUSD, XAUUSD 계정 유형: 스프레드가 매우 낮은 ECN, Raw 또는 Razor 브로커 시간: GMT +3 중개인 :
Volume flow Profile
Israr Hussain Shah
Master Edition은 거래량과 자금 흐름의 관점을 통해 시장 구조를 시각화하도록 설계된 전문가급 분석 도구입니다. 표준 거래량 지표와 달리, 이 도구는 차트에 일일 거래량 프로필을 직접 표시하여 가격 발견이 발생한 위치와 "스마트 머니"가 위치한 곳을 정확하게 볼 수 있게 합니다. 이 Master Edition은 명확성과 속도를 위해 설계되었으며, 로드 시 차트 레이아웃을 즉시 아름답게 만드는 독특한 자동 테마 동기화 시스템을 특징으로 합니다. 주요 기능: 진정한 자금 흐름 계산: 표준 틱 거래량을 넘어섭니다. "Use Money Flow"를 활성화하면 거래량이 가격에 따라 가중치가 부여되어 특정 가격 수준에서의 실제 자본 투입을 드러냅니다. 가치 영역(VA) 시각화: 가치 영역(기본값: 거래량의 70%)을 자동으로 계산합니다. VA Fill: 통제 구역을 즉시 식별하기 위해 가치 영역 배경을 음영 처리합니다. 주요 수준: 통제점(POC), 가치 영역 고점(VAH), 가치 영
필터:
리뷰 없음
리뷰 답변