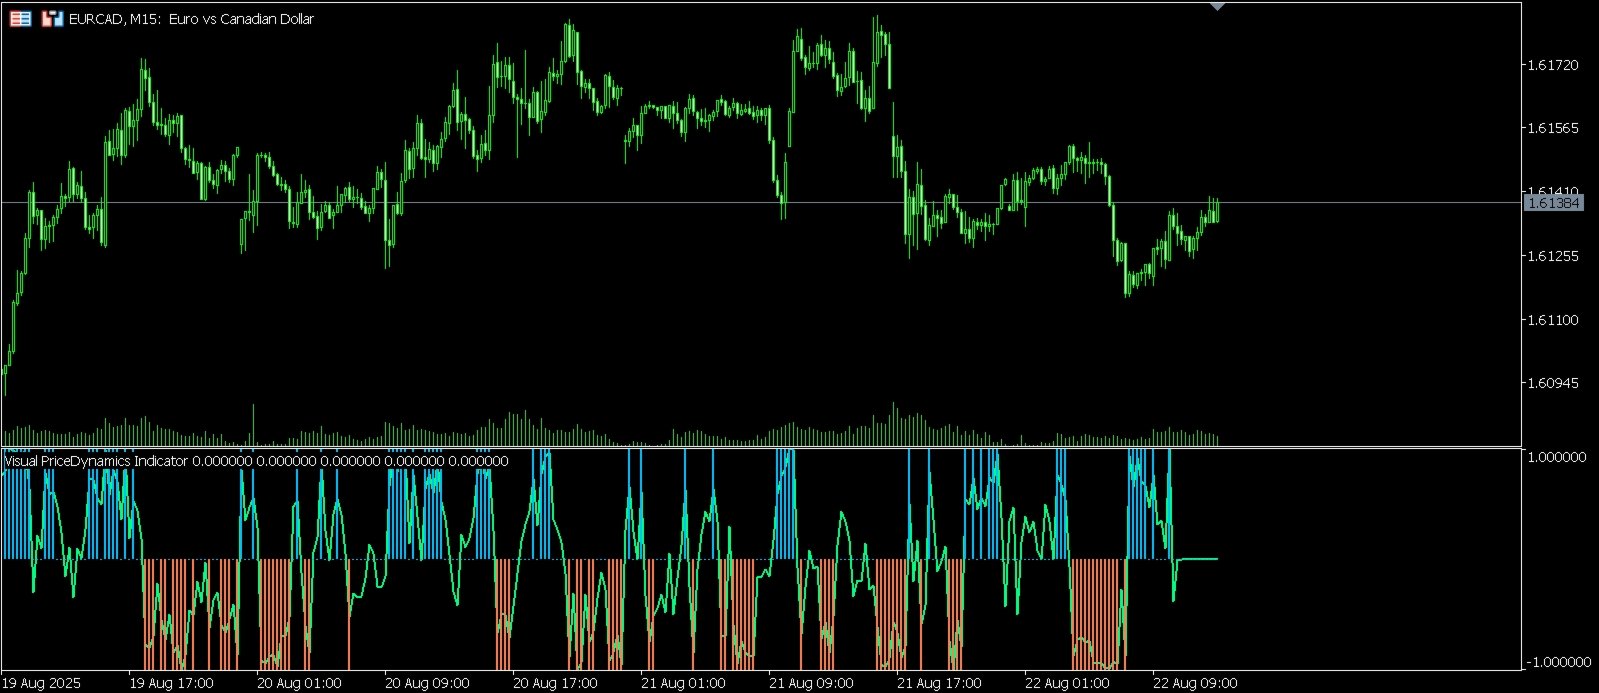
Visual PriceDynamics Indicator
- 지표
-
AL MOOSAWI ABDULLAH JAFFER BAQER
 To trade successfully we need to go through the proven path that others had gone and reached!
Here are 17 quotes from such successful investors:
1- Limit your size in any position so that fear does not become the prevailing instinct guiding your judgment.
Joe Vidich - 버전: 1.0
- 활성화: 5
• Please test the product in the Strategy Tester before purchasing to understand how it works.
• If you face any issues, contact me via private message—I’m always available to help.
• After purchase, send me a screenshot of your order to receive a FREE EA as a gift.
Visual PriceDynamics Indicator: See The Market's Future Potential
• If you face any issues, contact me via private message—I’m always available to help.
• After purchase, send me a screenshot of your order to receive a FREE EA as a gift.
Unlock a new perspective on the markets with the Visual PriceDynamics Indicator for MetaTrader 5.
Have you ever looked back at a chart and wished you could have seen the full potential of a move before it happened? The Visual PriceDynamics Indicator is a powerful and innovative tool designed to help you study the market's historical dynamics by analyzing future price action to reveal the underlying momentum of major moves. Instead of guessing, you can now visualize the potential strength behind every setup.
For just $30, this indicator will become an essential part of your strategy development and market analysis toolkit.
The Logic: A Forward-Looking Analysis
The core of the Visual PriceDynamics Indicator is its unique and powerful calculation engine. Unlike traditional indicators that rely solely on past data, our indicator takes a forward-looking approach to analyze market potential.
For every bar on your chart, the indicator looks ahead a specified number of bars (your Forward Analysis Period ) and performs a sophisticated analysis:
-
Potential Calculation: It identifies the highest high and the lowest low within that future window of bars.
-
Momentum Measurement: It then calculates the total potential upward movement and the total potential downward movement from the open of the current bar.
-
Normalization: This data is transformed into the "Momentum Wave," a smooth oscillator that moves between +1 (indicating strong future upward potential) and -1 (indicating strong future downward potential).
This unique method provides an unparalleled view of the market, allowing you to see which historical price points offered the greatest potential for a profitable trade. It is an exceptional tool for learning, backtesting ideas, and refining your trading intuition.
Two Distinct Analysis Methods for Signal Generation
The Visual PriceDynamics Indicator is not a one-size-fits-all tool. It comes with two powerful and fully customizable analysis methods to generate signals, allowing you to tailor its logic to your specific trading style.
-
Method 1: Momentum Threshold: This method generates signals based on pure strength. When the calculated Momentum Wave crosses a certain threshold that you define, it indicates that the future price potential is exceptionally strong in one direction. A green arrow will appear for a buy signal, and a red arrow for a sell signal. This is ideal for traders looking to capture strong, high-momentum breakouts.
-
Method 2: Risk to Reward Ratio: This method is designed for the systematic trader. It generates a signal only when the potential reward of a future move is significantly greater than the potential risk. You can define the exact target and risk in points. For example, a buy signal will only appear if the market's future upward potential is greater than your target, while the downward risk remains below your defined risk level. This helps you identify historical setups that align with sound risk management principles.
Key Features
-
Advanced Forward-Looking Analysis: The core logic provides a unique way to study market dynamics and develop strategies.
-
Dual Signal Modes: Choose between the Momentum Threshold and Risk to Reward analysis methods to fit your trading plan.
-
Clear and Intuitive Visuals: The indicator displays a separate window with the Momentum Wave and a Signal Strength histogram, plus clear buy, sell, and exit arrows directly on your main chart.
-
Fully Customizable: Change everything from the analysis periods and thresholds to the colors, sizes, and position of the signal arrows to create a setup that is perfect for you.
-
Built-in Signal Filter: An optional bar delay feature helps to reduce noise and prevent signals from clustering too closely together, allowing you to focus only on the most significant opportunities.
-
Lightweight and Efficient: Coded for performance, the indicator includes a Maximum Bars to Calculate setting to ensure it runs smoothly without slowing down your terminal.
How to Use the Visual PriceDynamics Indicator
This tool is incredibly versatile. Use it to:
-
Develop and refine new trading strategies by seeing which parameters would have identified the best historical opportunities.
-
Gain a deeper understanding of market momentum and how it builds before significant price swings.
-
Visually backtest trading ideas to see how they would have performed over time.
-
Use it as a powerful confirmation tool alongside your existing technical analysis methods.
Stop trading in the dark. Add the Visual PriceDynamics Indicator to your chart and start analyzing the market with a new level of insight.