Squeeze and Momentum Indicator
Squeeze and Momentum Indicator
Indicator — Version 1.0
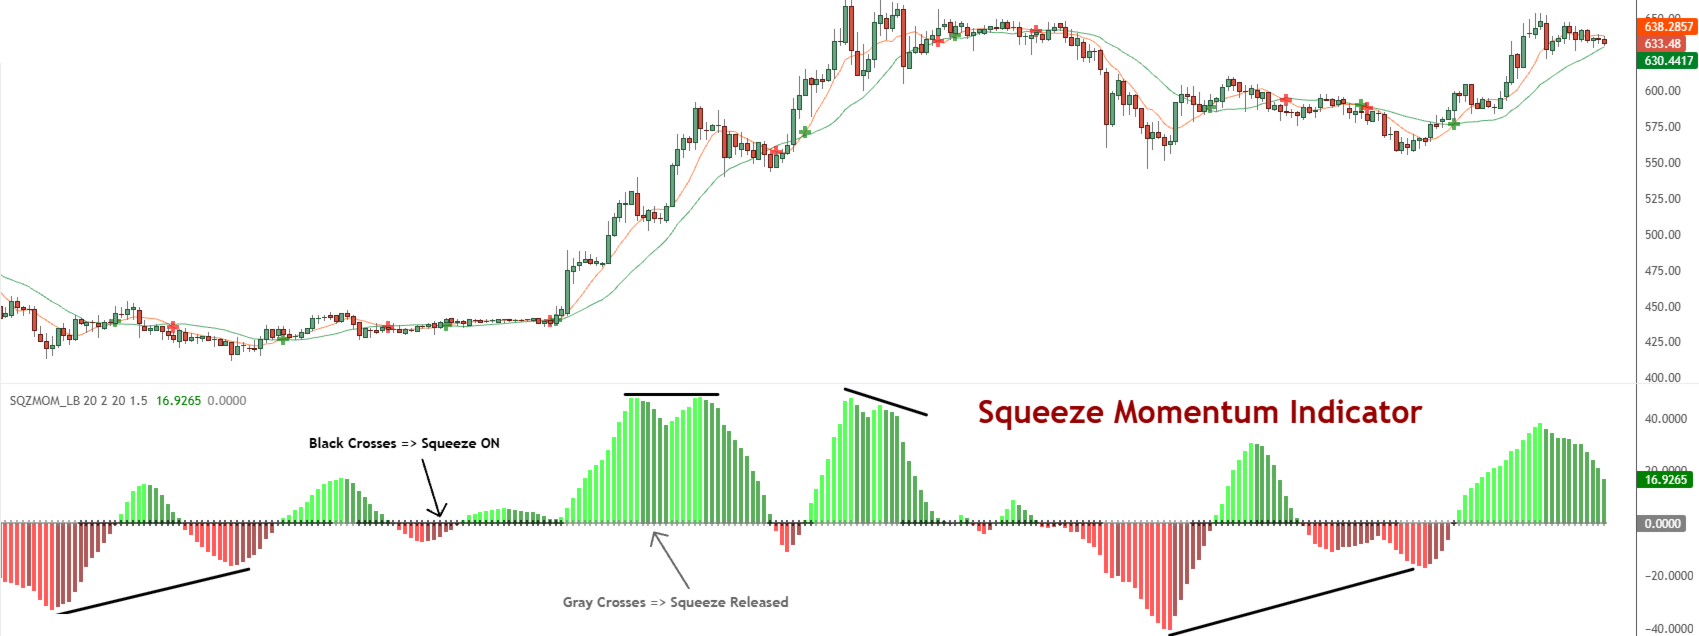
The Squeeze and Momentum Indicator is designed to highlight periods of low volatility followed by potential expansions in market activity. It combines Bollinger Bands and Keltner Channels to identify “squeeze” conditions and uses a momentum histogram to estimate the likely direction of the move once volatility expands.
How it works:
A squeeze occurs when the Bollinger Bands contract inside the Keltner Channels. This condition is marked with black crosses on the zero line.
When the Bollinger Bands expand back outside the Keltner Channels, the squeeze is released. This is shown by gray crosses.
The histogram provides a momentum gauge using a regression-based calculation:
Values above zero indicate bullish momentum.
Values below zero indicate bearish momentum.
Bright colors represent strengthening momentum.
Dim colors represent weakening momentum.
Typical usage:
Identify a squeeze phase (black crosses).
Monitor for the first release signal (gray cross).
Consider the direction of the histogram at the time of release:
Above zero → potential long bias.
Below zero → potential short bias.
Momentum shifts (color changes or zero-line crosses) can be used for trade management.
Inputs:
BB Length / Multiplier: Bollinger Band lookback period and width.
KC Length / Multiplier: Keltner Channel lookback period and width.
Use True Range (KC): Builds Keltner Channel width from True Range for responsiveness.
Notes:
Default parameters are suitable for most markets. Larger multipliers produce fewer but stronger signals, while smaller multipliers generate more frequent signals.
The indicator is intended as a technical analysis tool. It does not guarantee profits and should be combined with proper risk management and additional confirmation methods.
 Trader | MQL4 & MQL5 Programmer | MQL5 Freelancer