PipStartex
- 지표
-
Andrey Kozak
 Laboratory of Automatic Systems (LAS) - more than 10 years, we have been developing, testing and programming automatic trading robots for the forex market.
 - 버전: 1.0
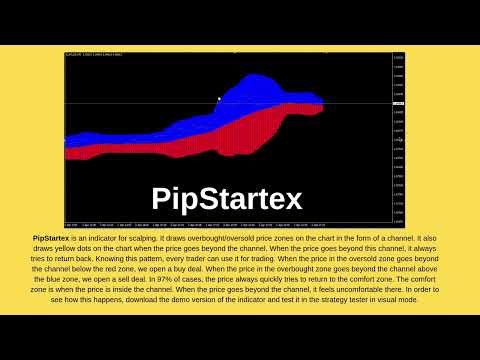
PipStartex is an indicator for scalping. It draws overbought/oversold price zones on the chart in the form of a channel. It also draws yellow dots on the chart when the price goes beyond the channel. When the price goes beyond this channel, it always tries to return back. Knowing this pattern, every trader can use it for trading. When the price in the oversold zone goes beyond the channel below the red zone, we open a buy deal. When the price in the overbought zone goes beyond the channel above the blue zone, we open a sell deal. In 97% of cases, the price always quickly tries to return to the comfort zone. The comfort zone is when the price is inside the channel. When the price goes beyond the channel, it feels uncomfortable there. In order to see how this happens, download the demo version of the indicator and test it in the strategy tester in visual mode.
Why you should use this indicator:
- This indicator shows a pattern on the chart that works in 97% of cases
- The indicator does not redraw its values
- Works well on intraday timeframes M5, M15, M30, H1
- The indicator is very easy to use for both a novice trader and a professional
- Go to this page from your PC and click the Free Demo button
- Then the indicator will appear in your MT4
- Run the strategy tester and select this indicator from the list of indicators
- Select the GBPUSD or EURUSD pair
- Select the period, for example, M5
- Click the start button and watch how the indicator draws signals on the chart. Imagine that you will enter the market at each yellow dot. Calculate the potential result of these transactions.
- StdChannelPeriod - the period for calculating the standard deviation.
- StdDevMultiplier - the standard deviation multiplier for calculating the channel width.
- SignalPeriod - period for calculating signal points.