Price Histogram Analyze MT4
- 지표
- Sathit Sukhirun
- 버전: 1.28
- 활성화: 20
Benefits of the Price Histogram Analyze MT4 Indicator
This Price Histogram Analyze MT4 indicator offers numerous advantages for traders looking to analyze the market and make informed trading decisions. It's especially powerful for understanding price and volume behavior at different levels. Here are its main benefits:
-
Identifying Key Support and Resistance Levels:
- Volume Profile Mode: Displays a histogram of trading volume at various price levels, highlighting "zones" where high trading activity occurred. These areas often act as strong support or resistance because many traders showed interest in buying or selling there.
- Delta Money Flow Mode: Can also help identify these levels, particularly when significant buying (Buy Delta) or selling (Sell Delta) volume is concentrated at a specific price.
-
Understanding Market Sentiment:
- Volume Profile Mode: Shows where most traders were interested in buying or selling, helping you understand whether buying or selling pressure is dominating the market within specific price ranges.
- Delta Money Flow Mode: Separates buy volume/money flow from sell volume/money flow, providing a clear view of the true "pressure" from buyers and sellers, indicating who is driving the price at that moment.
-
Assisting with Entry and Exit Decisions:
- By clearly seeing support/resistance levels from the Volume Profile or dominant buying/selling pressure from the Delta Money Flow, traders can plan their buy or sell entry points more strategically.
- It also aids in setting Stop Loss and Take Profit levels by referencing these significant price zones.
-
Analyzing "Delta" (The Difference Between Buy and Sell Pressure):
- In Delta Money Flow mode, the indicator calculates the difference between buy and sell money flow at each price level, which is crucial insightful data.
- Divergence: If the price is rising but Delta is decreasing (indicating weakening buying pressure), it might signal that the uptrend is losing momentum. Conversely, if the price is falling but Delta is increasing, it could suggest that selling pressure is weakening.
- Confirmation: Delta can serve as additional confirmation for other trading strategies, such as trading support/resistance or supply and demand.
-
Flexible Customization:
- This indicator offers a wide range of customizable parameters, including the Lookback Period (number of bars for calculation), Number of Rows (price levels), display mode (Volume Profile or Delta Money Flow), colors, and the display of numerical values and percentages. This allows traders to tailor it precisely to their trading style and preferences.
Overall, the Price Histogram Analyze MT4 is a highly effective tool that empowers traders to gain a deeper understanding of market structure. It goes beyond just observing price movements, revealing the underlying "activity" that drives those movements.
Buy 1 get 1 free
When you add this indicator to an MT5 chart, the "Inputs" window will appear, allowing you to configure its settings. These are divided into sections:
-
====== 1. Profile Calculation & Core Settings ======
- InpLookbackPeriod : The number of past bars to use for calculating the price profile and the Calculation Range Background. For example, if set to 100, the indicator will analyze data from the last 100 bars.
- InpNumberOfRows : The number of price rows to divide the profile histogram into. A higher value means a more detailed profile with narrower rows.
- InpProfileOffsetBars : The distance (in number of bars) to shift the profile histogram to the right of the current bar.
- InpMaxProfileWidthBars : The maximum width of the histogram bars in the profile (measured in bars), to prevent the profile from becoming too wide.
-
====== 2. Profile Display Mode & Colors ======
- InpProfileDisplayMode :
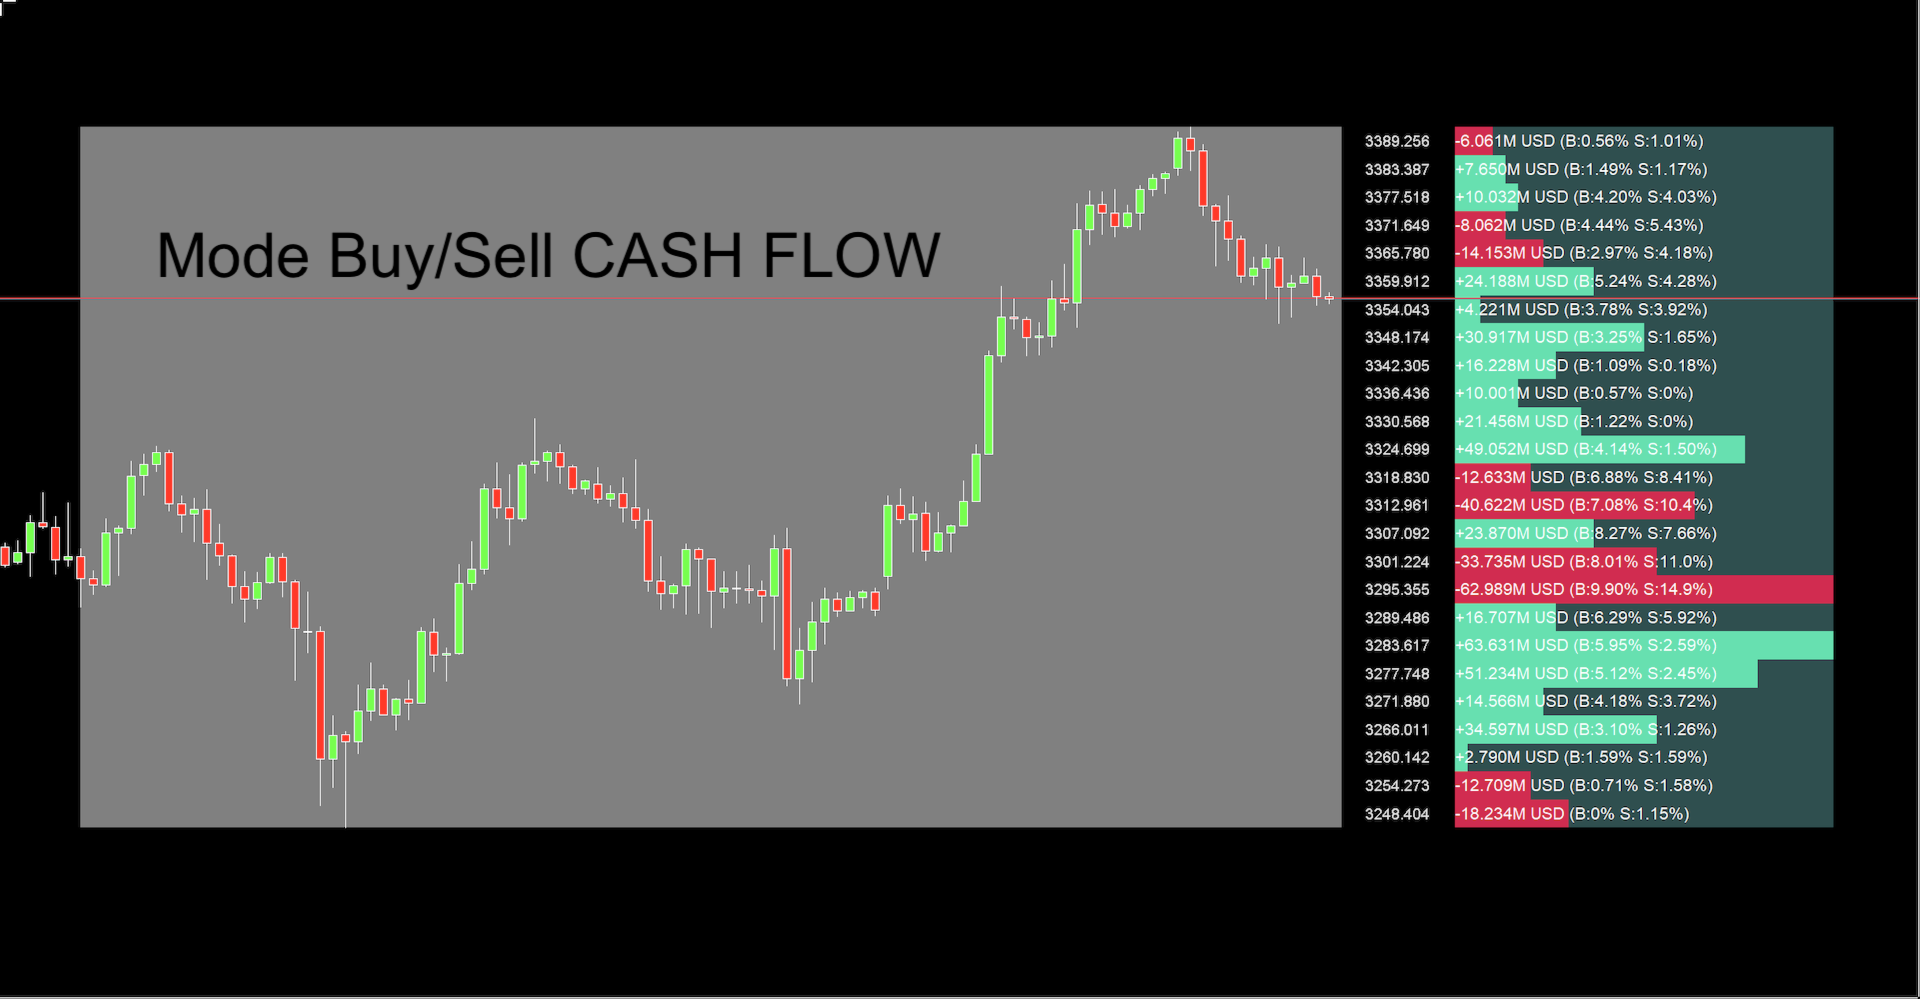
- Display Buy/Sell Money Flow Delta : Shows the difference between "buy money flow" and "sell money flow" at each price level. Blue bars (or the configured color) indicate more buying pressure; orange bars (or the configured color) indicate more selling pressure.
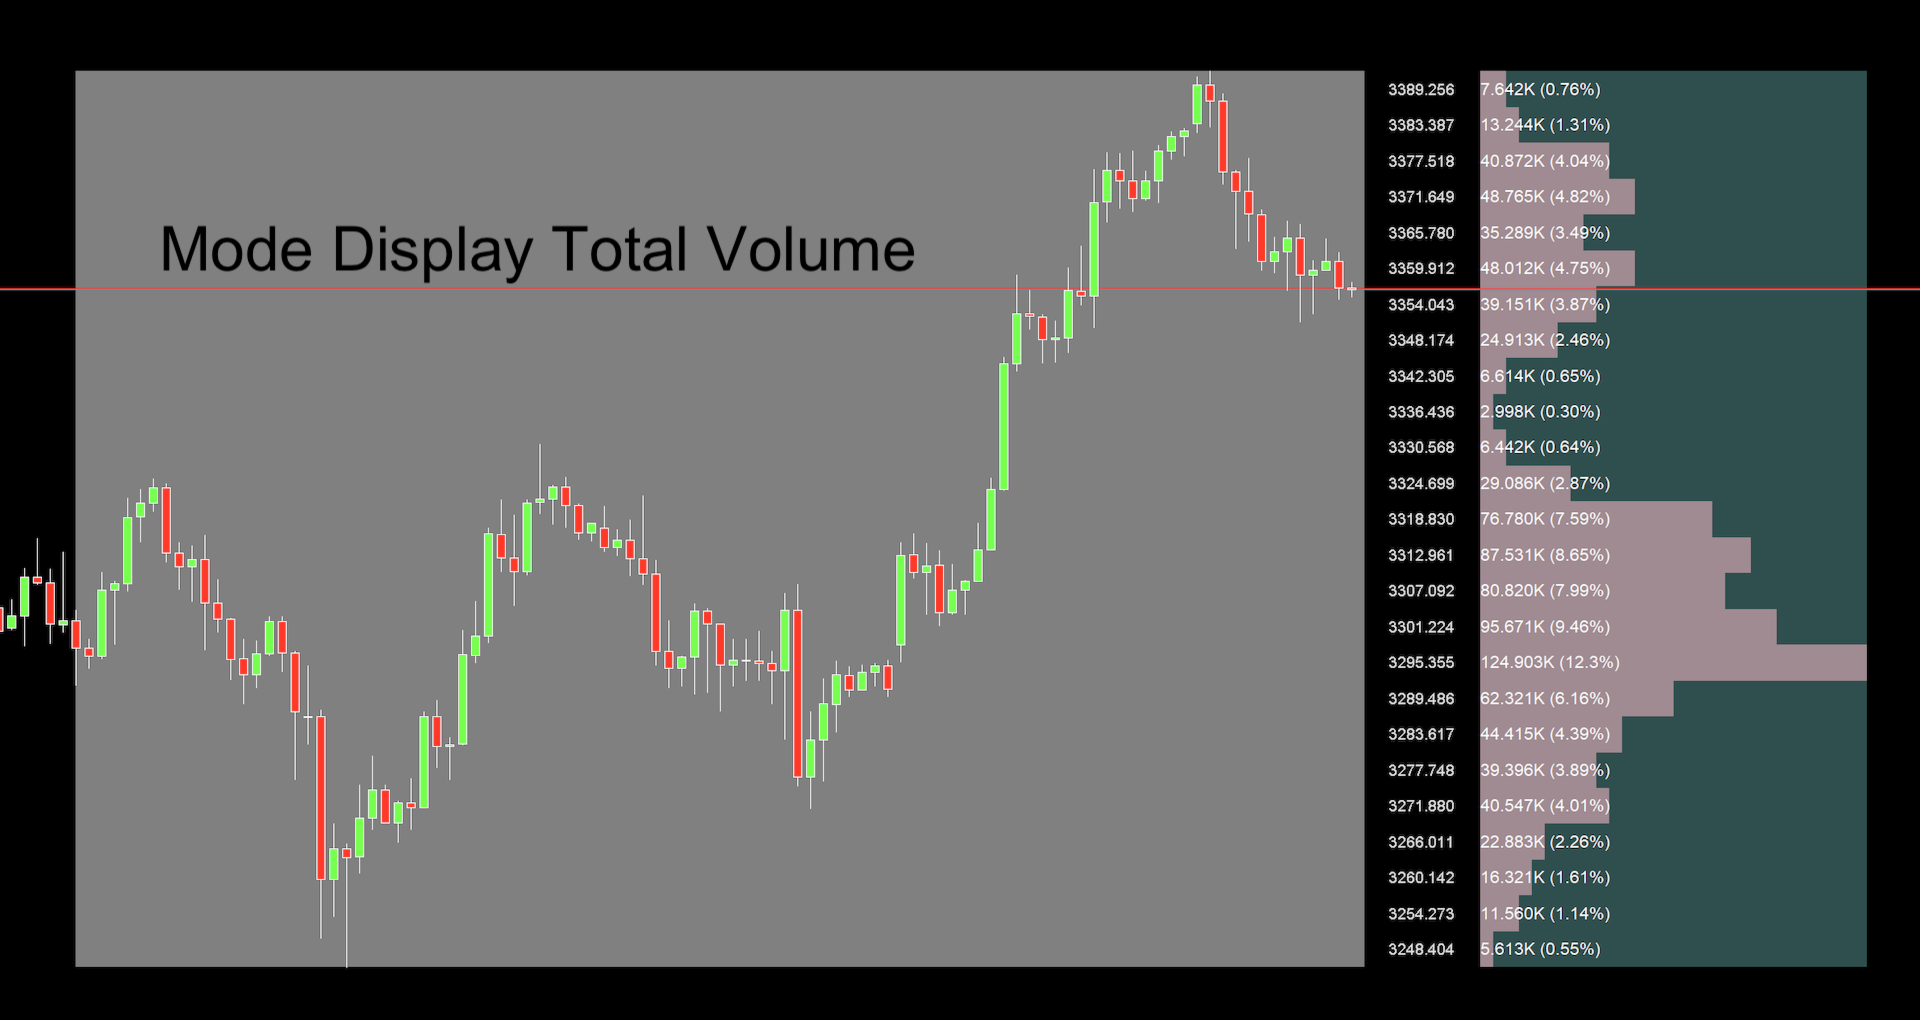
- Display Total Volume : Shows the total trading volume at each price level.
- InpPolarityMethod (used when InpProfileDisplayMode is MODE_DELTA_MONEY_FLOW ):
- Close > Open for Buy : Defines a bar as having buy volume if the closing price is higher than the opening price.
- (Close-Low) > (High-Close) for Buy : Defines it as buy volume if the pressure from the bottom (buyers pushing the price up from the low) is greater than the pressure from the top (sellers pushing the price down from the high).
- InpBuyDeltaColor : Color for histogram bars showing more buying pressure (in Delta Money Flow mode).
- InpSellDeltaColor : Color for histogram bars showing more selling pressure (in Delta Money Flow mode).
- InpVolumeProfileBarColor : Color for histogram bars (in Volume Profile mode).
- InpProfileDisplayMode :
-
====== 3. Text Display on Profile Bars ======
- InpShowProfileBarValues : Enable/disable the display of numerical values on the histogram bars.
- InpProfileTextColor : Color of the text displayed on the histogram bars.
- InpFontSize : Font size of the text on the histogram bars.
- InpShowDeltaPercentage : (In Delta Money Flow mode) Enable/disable showing the percentage of Buy Money Flow and Sell Money Flow for each row relative to the total Buy/Sell Money Flow of the entire profile.
- InpShowVolumePercentage : (In Volume Profile mode) Enable/disable showing the percentage of Volume in each row relative to the total Volume of the entire profile.
- InpShowCurrency : (In Delta Money Flow mode) Enable/disable displaying the currency symbol after the Money Flow value.
- InpCurrencySymbol : The currency symbol to display (e.g., USD, EUR, JPY).
- InpSuffixDecimalPlaces : Number of decimal places for abbreviated values (K, M, B).
- InpPercentageDecimalPlaces : Number of decimal places for percentage values.
- InpTextLeftPaddingRatio : The ratio for padding text from the left edge of the histogram bar (0.05 means 5% of the bar width).
-
====== 4. Row Price Label Settings ======
- InpShowRowPriceLabels : Enable/disable displaying price level labels for each row in the profile.
- InpRowPriceLabelColor : Color of the price level labels.
- InpRowPriceLabelFontSize : Font size of the price level labels.
- InpRowPriceLabelXOffset : Distance (in pixels) of the price level labels from the right edge of the profile.
- InpRowPriceLabelAnchor : Anchor point for the price label text (e.g., right-aligned, center). In the screenshot, it's ANCHOR_RIGHT (right-aligned) and "Right side's center," which could refer to ANCHOR_RIGHT_UPPER , ANCHOR_RIGHT , or ANCHOR_RIGHT_LOWER depending on the ENUM_ANCHOR_POINT used in the code.
-
====== 5. Background Settings ======
- InpShowProfileGlobalBackground : Enable/disable displaying a background covering the entire area of the profile histogram.
- InpProfileGlobalBackgroundColor : Color of the profile background.
- InpProfileGlobalBackgroundStyle : Border style of the profile background (e.g., Solid, Dot).
- InpProfileGlobalBackgroundWidth : Thickness of the profile background border.
- InpShowCalcRangeBackground : Enable/disable displaying the background for the calculation range (based on InpLookbackPeriod ).
- InpCalcRangeBackgroundColor : Color of the calculation range background.
- InpCalcRangeBackgroundStyle : Border style of the calculation range background.
- InpCalcRangeBackgroundWidth : Thickness of the calculation range background border.
How to Adjust for Use:
- Define Analysis Range: Adjust InpLookbackPeriod to suit your timeframe and strategy. For short-term charts, a smaller value might be used; for long-term charts, a larger value might be appropriate.
- Profile Granularity: InpNumberOfRows determines the detail. Too few rows might miss important details; too many might make it look cluttered. Experiment to find a suitable value for the instrument and timeframe.
- Choose Display Mode:
- Display Total Volume : Ideal for seeing which price levels have the highest accumulated trading volume (POC from Volume), often acting as significant support/resistance.
- Display Buy/Sell Money Flow Delta : Helps visualize where buying or selling pressure is dominant at different price levels, useful for gauging market momentum.
- Customize Appearance: Set colors, font sizes, and on-bar data display (numbers, percentages) for easy viewing and comfort.
- Observe POC Line: The POC line will point to the price level with the highest trading activity (according to the selected mode), serving as a very significant reference point.
Benefits of the Indicator
The "Price Histogram Analyze MT5" indicator with the POC feature offers several benefits for traders:
- Identify Key Support/Resistance Levels:
- Price levels with high accumulated trading volume (long histogram bars) or the POC level often act as strong support or resistance because they are areas where the market has shown significant interest and transacted heavily.
- Understand "Value Areas":
- Although this indicator doesn't directly calculate a Value Area (e.g., 70% of Volume), the distribution of Volume/Money Flow helps visualize whether the price is trading in a "value area" (high volume region) or a "non-value area" (low volume region).
- Assess Strength of Buying/Selling Pressure:
- In MODE_DELTA_MONEY_FLOW , it's clear at which price levels buy delta or sell delta is dominant, which can indicate short-term market direction.
- Confirm Trading Signals:
- Profile data can be used to confirm signals from other indicators or Price Action. For example, if price breaks a resistance level with increased volume at that level, it confirms the strength of the breakout.
- Find Entry/Exit Points or Set Stop Losses:
- The POC level or areas of high volume can be used as reference points for considering trade entries, setting price targets (Take Profit), or placing stop-loss orders.
- Visualize Market Structure:
- Helps understand how the market is accepting or rejecting prices at various levels.
In summary, this indicator is a powerful tool for analyzing market structure based on trading volume or money flow at different price levels, enabling traders to make more informed decisions.