Horizontal tick volumes
- 지표
- Aleksandr Suchkov
- 버전: 4.1
- 업데이트됨: 19 5월 2023
- 활성화: 7
Horizontal tick volumes (HTV)
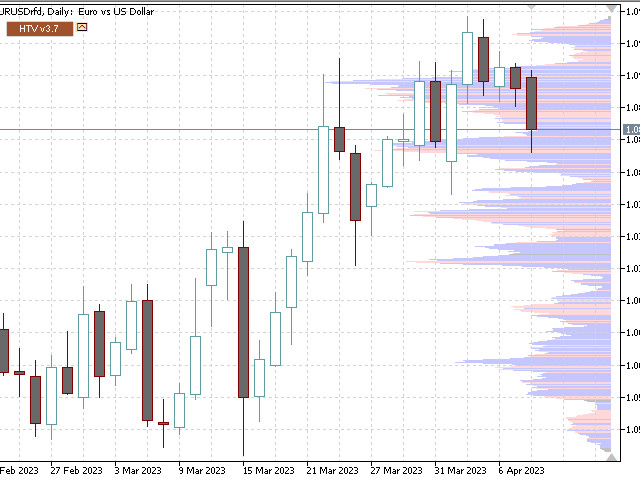
Horizontal tick volumes - an easy and convenient indicator of a horizontal market profile in a user-selected time.
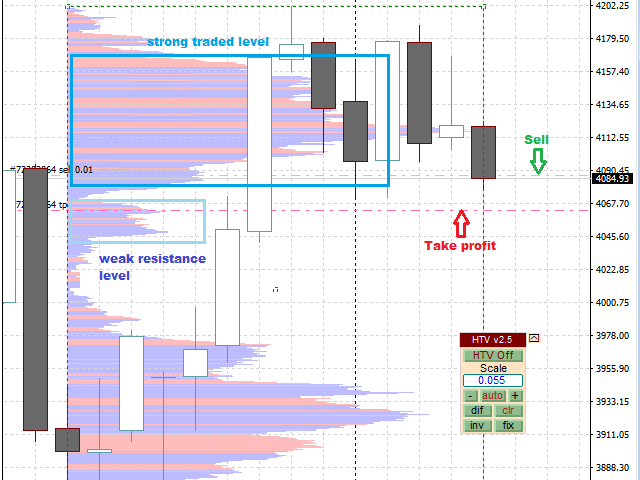
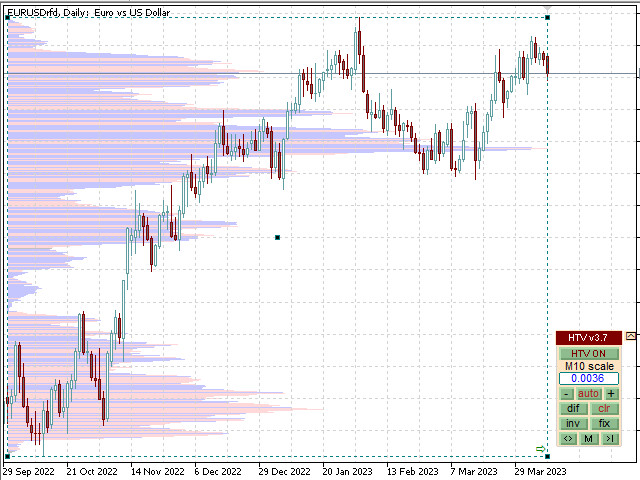
Produces a visual image of strong trading levels by maximum peaks past volumes and trading direction by color (sell or buy), and also allows you to detect smaller trading levels by differentiating past volumes.
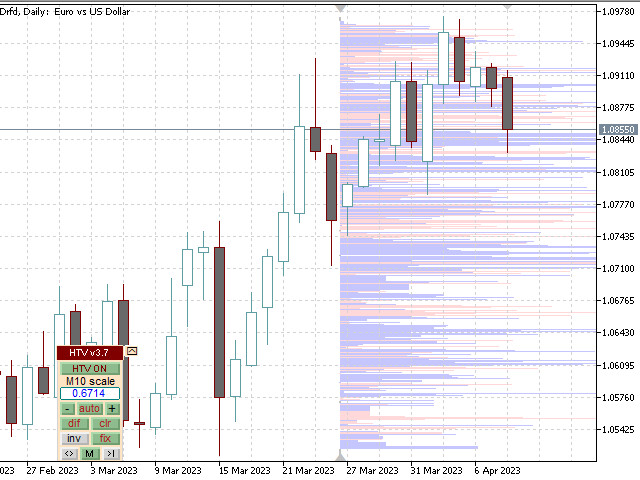
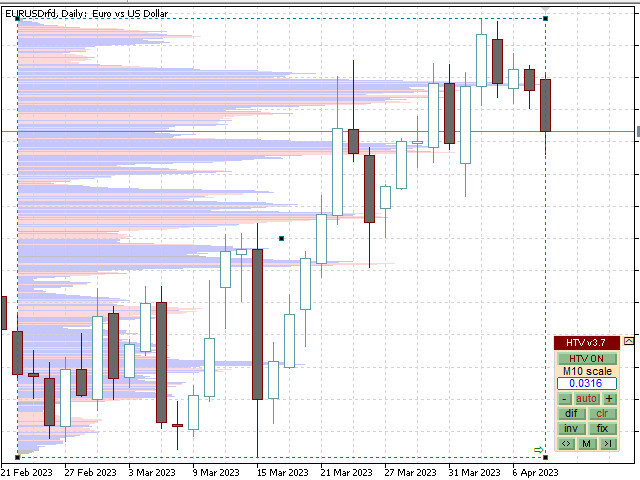
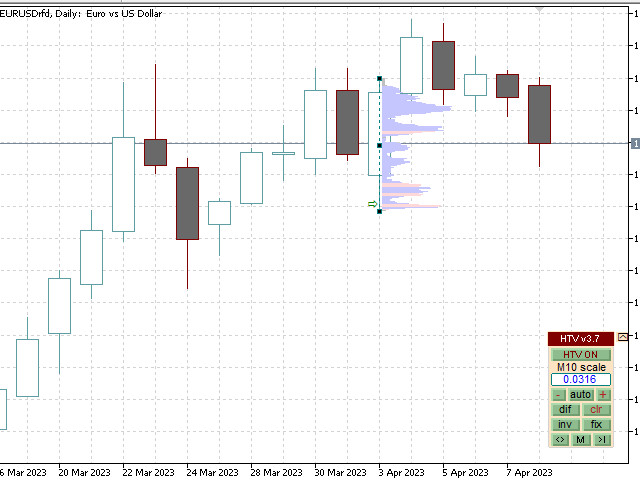
In the "Optimal" mode, when displayed on chart periods up to and including "M30", the data of one-minute bars are used, on H1 and H4 - five-minute ones, starting from the "D1" period, the data of hourly bars are used in the calculations.
You can also choose any period for calculations, not exceeding the current one.
Successful operation requires a downloaded bar history for a given time interval in the MT4 terminal.