Snap Entry System

Snap Entry System

고압 시장 상황에서 정밀한 실행을 위한 설계
Snap Entry System은 높은 변동성 환경에서 타이밍과 구조의 정밀성을 요구하는 트레이더를 위해 개발된 고급 신호 시스템입니다. 핵심 로직은 상대적인 가격 움직임과 방향성 확인을 결합하여, 외부 지표가 아닌 가격 내부의 행동을 기반으로 한 전략적 진입 포인트를 제공합니다.

최신 정보 받아보기
앞으로 출시될 업데이트와 소식을 가장 먼저 받아보려면 공식 채널에 참여하세요: https://www.mql5.com/en/channels/signalsandindicators


실제 구조적 전환에 기반한 진입 로직
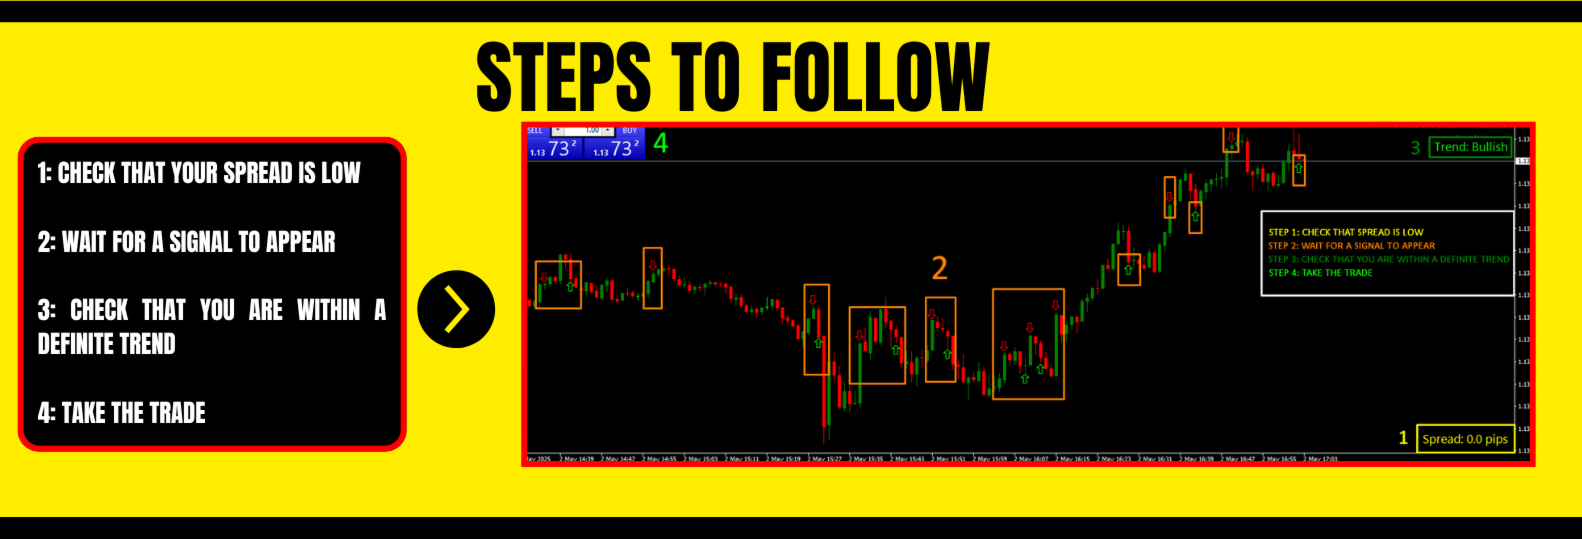
이 시스템은 무작위 스파이크나 일반적인 과매수/과매도 조건에는 반응하지 않습니다. 단기 및 중기 내부 흐름 간의 상호작용을 평가하며, 진정한 추세 시작에 앞서 나타나는 가속 패턴을 분석합니다. 방향성 편향이 확인되고 압력의 명확한 변화가 감지되면 신호가 즉시 생성되어 차트에 표시됩니다.


최소한의 설정, 최대한의 집중
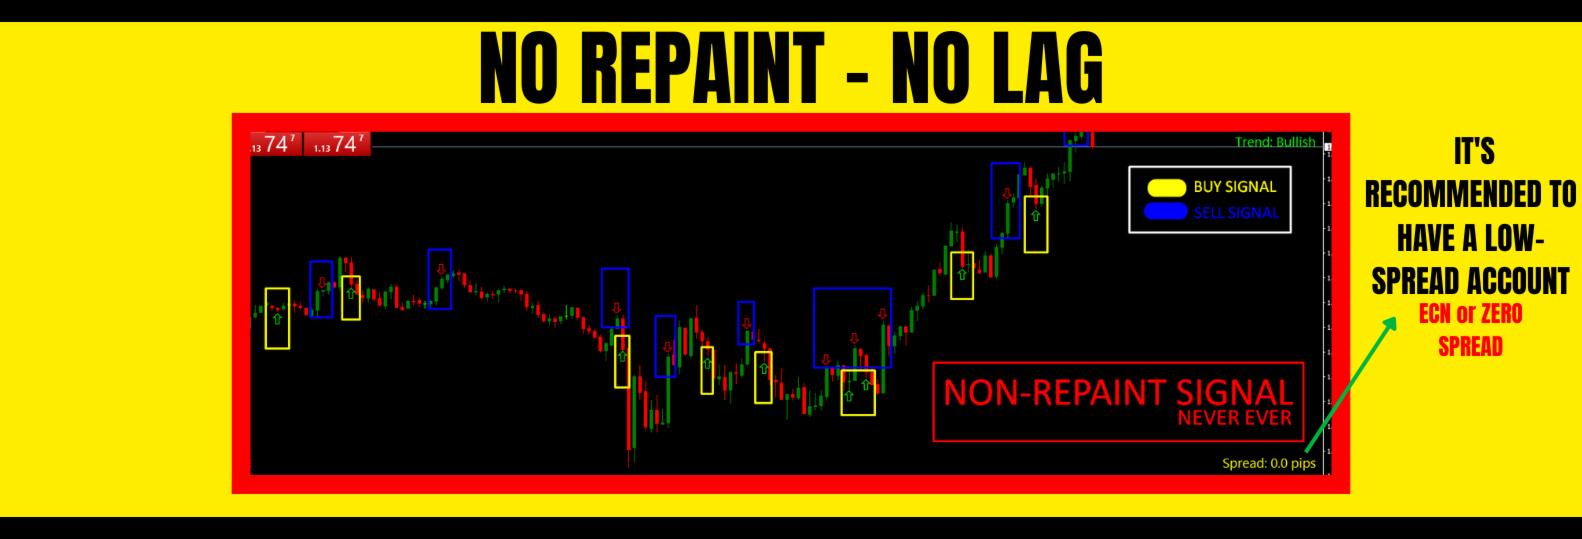
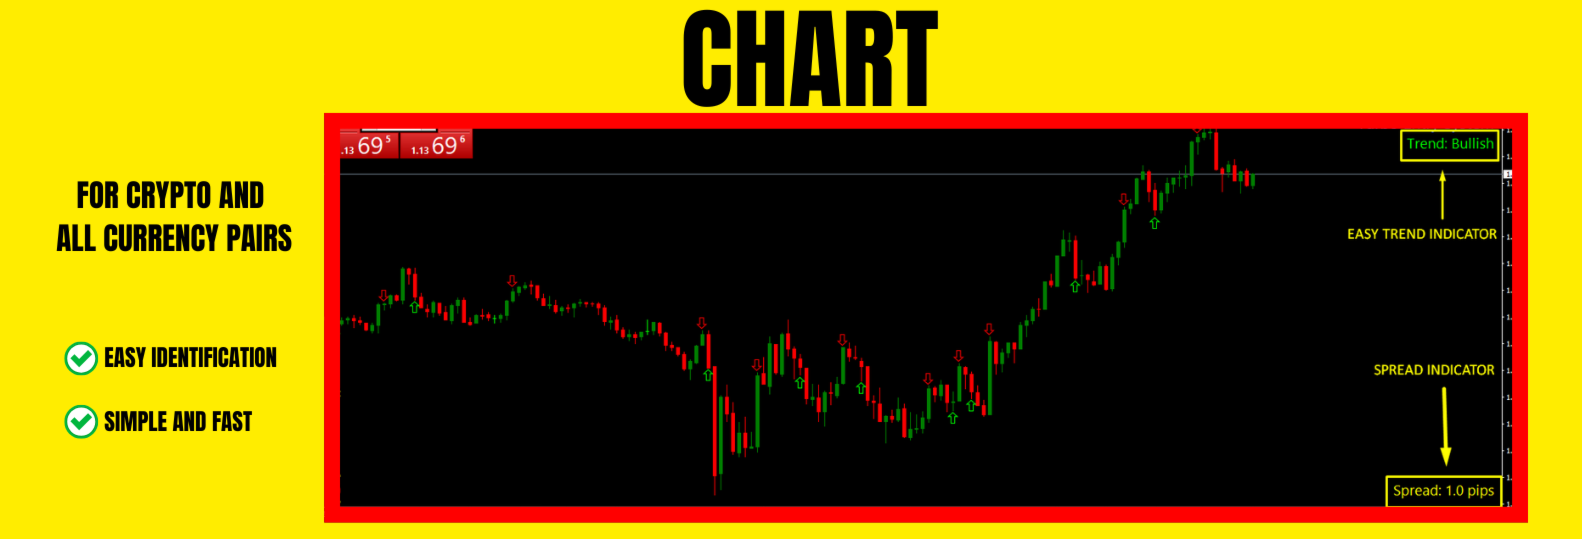
Snap Entry System은 불필요한 매개변수와 시각적 요소를 제거합니다. 신호 로직은 간단하고 실행 가능하게 설계되어 있으며, 매수 신호는 캔들 아래에, 매도 신호는 캔들 위에 표시됩니다. 영역 없음, 리페인트 없음, 지연 없음 — 시장의 실제 움직임에 기반한 명확한 실시간 진입 포인트만 제공합니다.

모든 시간대에 유연하게 적용
이 시스템은 빠르게 움직이는 시장에 최적화되어 있지만, M1 스캘핑부터 구조적인 H1 진입까지 모든 시간대에서 원활하게 작동합니다. 내부 로직은 자산의 변동성과 리듬에 따라 조정되므로, 전술적 인트라데이 전략뿐만 아니라 여러 세션에 걸친 모멘텀 기반 트레이딩에도 적합합니다.

실시간 알림, 방해 없는 반응
화면을 계속 주시할 필요는 없습니다. 내장된 알림 기능과 선택 가능한 이메일 알림을 통해, 시스템은 제때 반응하며 늦지 않습니다. 반복적인 신호를 방지하고, 기술적으로 유효한 움직임이 발생할 때에만 신호를 발생시킵니다.

자주 묻는 질문

신호가 리페인트되나요?
아니요. 신호가 한 번 표시되면 그대로 유지됩니다. 재계산이나 스무딩 처리는 없습니다. 이 시스템은 실시간에서의 명확성과 신뢰를 위해 설계되었습니다.

금 외의 다른 자산에서도 사용할 수 있나요?
네. 이 시스템은 고변동성 자산을 위해 설계되었지만, 가격 구조와 모멘텀이 중요한 모든 종목에 잘 작동합니다. 특히 리듬감 있는 변동성을 보이는 시장에서 탁월한 효과를 발휘합니다.

알림 기능이 포함되어 있나요?
네. 알림은 설정에서 활성화하거나 비활성화할 수 있으며, 유효한 신호가 감지되면 즉시 발생하며 이메일 전송도 가능합니다.

어떤 시간대에서 가장 효과적인가요?
다양한 시간대에서 효과적으로 작동합니다. 스캘퍼는 일반적으로 M1~M5를 선호하고, 스윙 트레이더는 M15 및 H1에서도 성공적으로 사용합니다. 이 시스템의 로직은 특정 시간대가 아니라 가격의 움직임 자체에 반응합니다.

자동화 전략에 통합할 수 있나요?
네. 리페인트가 없고 버퍼 기반 로직과 명확한 신호 구조를 갖추고 있어, EA 또는 수동/자동 혼합 전략에 쉽게 통합할 수 있습니다.

추천 제품
Switchman
Vitalii Zakharuk
Switchman is a smart indicator without delays or redrawing that shows the trend of the selected timeframes. The most important task of a trader is to spot a trend and follow it on time. Uses an algorithm for calculating finding possible price reversals. It can be used as an additional or auxiliary tool for your trading strategy. The current timeframe the indicator is set to is used. Using arrows for this that show the direction of the pivot points. Can be used with an optimal risk to reward r
Winner of Balance
Vladimir Starikov
The Winner of Balance indicator is based on the author's method of detecting market sentiment. designed to understand what the mood is in the market, who wins-bears or bulls. Input parameters: 1. Settings for setting levels: 1.1. ATR Period - the period of the standard ATR indicator 1.2. K Lower Order, ATR-coefficient for setting the lower threshold in ATR (hotpink color) 1.3. KUpper Border, ATR - coefficient for setting the upper threshold in ATR (the Aqua color) 2. Settings for calculatio
Day Pattern
Oleksandr Martsynyshen
Description: - D ay Pattern - an indicator that helps to identify patterns of price changes for the development of trading algorithms and strategies. For whom this tool? - For developers of trading strategies and algorithms. - Medium- and long-term traders. Time frames H1-W1. Features of the indicator: - There is a function of exporting indicator values to a file of the csv format. - Using the information panel, you can conduct an express analysis of trading tool. - The indicator is sui
Overview  Market Structure Analysis Indicator MT4 Structure Analysis Indicator   automatically identifies Market Structure based on Smart Money Concepts (SMC). It clearly displays Break of Structure (BoS), Change of Character (CHoCH), Higher Highs, Higher Lows, Lower Highs, and Lower Lows in real-time. Key Features Automatic Market Structure Detection   Break of Structure (BoS)   - Price breaks previous structure in trend direction   Change of Character (CHoCH)   - Trend reversal sig
History Pattern Search
Yevhenii Levchenko
표시기는 현재 시세를 작성하여 과거 시세와 비교할 수 있으며 이를 바탕으로 가격 변동을 예측합니다. 표시기에는 원하는 날짜로 빠르게 이동할 수 있는 텍스트 필드가 있습니다. 옵션: 기호 - 표시기가 표시할 기호 선택. SymbolPeriod - 지표가 데이터를 가져올 기간 선택. IndicatorColor - 표시기 색상. HorisontalShift - 지시자가 그린 따옴표를 지정된 막대 수만큼 이동합니다. Inverse - true는 인용 부호를 반대로, false - 원래 보기를 반전합니다. ChartVerticalShiftStep - 차트를 수직으로 이동합니다(키보드의 위/아래 화살표). 다음은 날짜를 입력할 수 있는 텍스트 필드의 설정으로, '엔터'를 누르면 즉시 이동할 수 있습니다.
Reversal Pattern Pro
Boonyapagorn Rodvattanajinda
Reversal Patterns Pro Reversal Patterns Pro is a Price Action (PA) analytical tool that scans the reversal patterns.  - Finds and marks the most dependable Japanese candlestick patterns in real-time. - Supports all time frames (Best for Scalping) - Doesn't repaint making it an exceptional indicator for Expert Advisors. Input parameters : - Support & Resistance Mode ( true or false ) for enabling advanced filtering - Donchian Period - RSI Period - RSI Oversold Level - RSI Overbought Level - Al
Transsion
Tatiana Savkevych
A trend indicator is a hybrid of several indicators that process data sequentially with signaling a trend change. Advanced net price action calculation to find LH and HL breakouts. Finishing the indicator data will give you excellent pivot points in the market. LH and HL signals can also be used for breakouts of the training. The indicator has proven itself well in a strategy based on impulse levels and false breakouts. When a breakout occurs, it indicates a strong reversal. A good filter for mo
Alpha Trend sign has been a very popular trading tool in our company for a long time. It can verify our trading system and clearly indicate trading signals, and the signals will not drift. Main functions: Based on the market display of active areas, indicators can be used to intuitively determine whether the current market trend belongs to a trend market or a volatile market. And enter the market according to the indicator arrows, with green arrows indicating buy and red arrows indicating se
Extremes Day
Aleksey Maltsev
v. 1.0 This indicator can show with maximum accuracy up to 1 bar the presence of a Maximum/minimum on the chart, regardless of the timeframe. It has a flexible configuration. You can use either one value on all TF, or you can use your own value on each TF individually. This indicator is already being improved and those who purchase it receive all updates for free. Next, it is planned to display an indication of the strength of the pivot point at each extremum (in % or in color drawing). It wi
El indicador "MR BEAST ALERTAS DE LIQUIDEZ" es una herramienta avanzada diseñada para proporcionar señales y alertas sobre la liquidez del mercado basándose en una serie de indicadores técnicos y análisis de tendencias. Ideal para traders que buscan oportunidades de trading en función de la dinámica de precios y los niveles de volatilidad, este indicador ofrece una visualización clara y detallada en la ventana del gráfico de MetaTrader. Características Principales: Canal ATR Adaptativo: Calcula
New, more accurate version of the Xmaster indicator. More than 200 traders from around the world have conducted more than 15,000 tests of different combinations of this indicator on their PCs in order to get the most effective and accurate formula. And here we present to you the "Xmaster formula indicator forex no repaint" indicator, which shows accurate signals and does not repaint. This indicator also sends signals to the trader by email and push. With the arrival of each new tick, it constan
VR Grid
Vladimir Pastushak
5 (3)
VR 그리드 표시기는 사용자 정의 설정으로 그래픽 그리드를 생성하도록 설계 되었습니다. 표준 그리드 와 달리 VR 그리드는 원형 레벨 을 구축하는 데 사용됩니다. 사용자의 선택에 따라 라운드 수준 사이의 단계는 임의적일 수 있습니다. 또한 VR Grid는 다른 인디케이터나 유틸리티와는 달리 기간이 바뀌거나 단말기를 재부팅해도 그리드의 위치 를 유지합니다. 설정, 세트 파일, 데모 버전, 지침, 문제 해결 등은 다음에서 얻을 수 있습니다. [블로그] 다음에서 리뷰를 읽거나 작성할 수 있습니다. [링크] 버전 [MetaTrader 5] 수직 수준 은 실제 시간 간격을 기준으로 하며 누락 또는 존재하지 않는 기간은 무시 합니다. 따라서 레벨 사이의 단계는 사용자가 선택한 값과 엄격하게 일치합니다. VR 그리드 표시기를 사용할 때 트레이더는 모든 수준에서 스타일 , 수직선 및 수평선의 색상 및 두께를 변경할 수 있습니다. 이를 통해 금융 상품의 라운드 수준 을 제어할 수 있습니다. 라운
FREE
OB Breakout is alert indicator that identifies when a trend or price move is approaching exhaustion(Supply and Demand) and ready to reverse. It alerts you to changes in market movement which typically occur when a reversal or major pullbacks are about to or have happened. The indicator identifies breakouts and price momentum initially, every time a new high or low is formed near a possible Supply or Demand level point. The indicator draws in a rectangle on Supply or Demand Zones.   Once price we
Rainbow Price Visualizer
Vincent Jose Proenca
Rainbow Price Visualizer v1.21 See where the market really breathes. Turns your MT4 chart into an ultra-precise heatmap that highlights price zones favored by big players. Why it matters 300 price levels at 0.2‑pip resolution — microscopic detail. 8 visual themes (Rainbow, Fire, Ocean…) for instant readibility. Smart opacity: low noise fades, real zones pop. Lightweight rendering with automatic cleanup. Fully customizable: saturation, opacity, resolution, history depth. Bands project into the f
PZ Harmonacci Patterns
PZ TRADING SLU
3.17 (6)
Trade smarter, not harder: Empower your trading with Harmonacci Patterns This is arguably the most complete harmonic price formation auto-recognition indicator you can find for the MetaTrader Platform. It detects 19 different patterns, takes fibonacci projections as seriously as you do, displays the Potential Reversal Zone (PRZ) and finds suitable stop-loss and take-profit levels. [ Installation Guide | Update Guide | Troubleshooting | FAQ | All Products ] It detects 19 different harmonic pric
Tunnel Trend Forex
Ruben David Santana Rodriguez
Indicador de tunel de tendencia , este indicador se utiliza de la siguiente forma : Para entradas al alza , el precio debe cerrar primero por encima del tunel , si despues de cerrar el precio encima del tunel la siguiente vela abre y cierra su precio por encima del tunel abriremos una operacion al alza , para las operaciones a la baja las condiciones son las mismas solo que al contrario , el precio debe cerrar debajo del tunel y la siguiente vela debe abrir y cerrar debajo del tunel , el stop lo
Trend PA
Mikhail Nazarenko
5 (3)
The Trend PA indicator uses   Price Action   and its own filtering algorithm to determine the trend. This approach helps to accurately determine entry points and the current trend on any timeframe. The indicator uses its own algorithm for analyzing price changes and Price Action. Which gives you the advantage of recognizing, without delay, a new nascent trend with fewer false positives. Trend filtering conditions can be selected in the settings individually for your trading style. The indicator
Monster Harmonic Indicator
Paul Geirnaerdt
4.59 (29)
Monster Harmonics Indicator is a harmonic pattern indicator. It recognizes Gartley, Bat, Crab, Butterfly, Cypher, White Swan, Black Swan, Shark and several other patterns. Projected patterns that are not yet completed are recognized, too. Monster even shows the PRZ (Potential Reversal Zone). Users can add their own user defined patterns to Monster. Besides the current pattern, Monster also shows all patterns in the symbols history. Monster will provide alerts for developing patterns. Introduced
The   Fibonacci Confluence Toolkit   is a technical analysis tool designed to help traders identify potential price reversal zones by combining key market signals and patterns. It highlights areas of interest where significant price action or reactions are anticipated, automatically applies Fibonacci retracement levels to outline potential pullback zones, and detects engulfing candle patterns. Its unique strength lies in its reliance solely on price patterns, eliminating the need for user-define
WanaScalper MT4
Isaac Wanasolo
1 (1)
A scalping indicator based on mathematical patterns, which on average gives signals with relatively small SL, and also occasionally helps to catch big moves in the markets (more information in the video) This indicator has three main types of notifications: The first type warns of a possible/upcoming signal on the next bar The second type indicates the presence of a ready signal to enter the market/open a position The third type is for SL and TP levels - you will be notified every time price re
Future Candle One Candle is an arrow indicator of candlestick patterns, based on the calculation of historical statistics. It identifies and calculates patterns consisting of one candle. Advantages of the indicator Gives information about the next candle right now; The indicator values are based on statistical data on the history of the current instrument; Forecasts and displays the result of trading based on its signals; The colors of the indicator have been selected for a comfortable operatio
Progres
Oleksii Ferbei
The Progres indicator uses calculations designed to smooth out sharp fluctuations that do not affect the overall picture of price movement. This is an auxiliary tool for technical analysis, which helps to determine the direction of the trend: either upward or downward price movement on the selected trading instrument. The indicator is a trend-type indicator; it smooths out price fluctuations during signal formation by averaging data. The trend can be ascending (bullish) and decreasing (bearis
Price Magnets
Ivan Simonika
Price Magnet — Price Density and Attraction Levels Indicator Price Magnet is a professional analytical tool designed to identify key support and resistance levels based on statistical Price Density. The indicator analyzes a specified historical period and detects price levels where the market spent the most time. These zones act as “magnets,” attracting price action or forming a structural base for potential reversals. Unlike traditional Volume Profile tools, Price Magnet focuses on price-time d
Apollo SR Master
Oleg Rodin
5 (1)
Apollo SR Master는 지지/저항 구간에서의 거래를 더욱 쉽고 안정적으로 만들어 주는 특수 기능을 갖춘 지지/저항 지표입니다. 이 지표는 지역 가격의 고점과 저점을 감지하여 시간 지연 없이 실시간으로 지지/저항 구간을 계산합니다. 새롭게 형성된 저항 구간을 확인하기 위해 지표는 해당 저항 구간을 실제 매도 또는 매수 신호로 활용할 수 있음을 나타내는 특수 신호를 표시합니다. 이 경우, 저항 구간의 강도가 높아지고, 따라서 저항 구간에서의 성공적인 거래 가능성도 높아집니다. 이것이 바로 이 지표의 핵심 아이디어입니다. SR 존은 손절매와 이익실현을 더욱 쉽게 할 수 있도록 해줍니다. 신호 방향에 따라 SR 존 위 또는 아래 공간을 손절매로 활용할 수 있습니다. 또한, 반대쪽 SR 존은 잠재적 이익실현 영역으로 활용할 수 있습니다. 또한 Apollo SR Master 지표를 사용하는 모든 사용자에게 "Apollo Price Action System" 지표를 무료로 제공합니다.
Happy Scalping Indicator
Leandro Bernardez Camero
이 지표는 공격적인 스캘핑 과 바이너리 옵션에서 빠른 진입 을 위해 설계되었습니다 , 각 캔들 마다 신호를 생성하여 언제든지 무엇이 일어나고 있는지 정확히 알 수 있습니다. Happy Scalping 채널에 가입하세요: MQL5 재작성 없음 : 현재 캔들의 신호는 실시간 으로 생성됩니다. 이는 캔들이 아직 형성 중일 때 가격이 이전 캔들의 종가에 비해 상승하거나 하락하는지에 따라 신호가 변경될 수 있음을 의미합니다. 그러나 캔들이 닫히면 , 신호의 색상은 완전히 고정됩니다 . 변경되지 않으며, 사라지지 않고, 이동하지 않습니다. 보이는 그대로 남습니다. 왜 이렇게 설계되었나요? 많은 스캘퍼들은 특히 가격의 돌파나 급격한 움직임 이 있을 때 즉시 신호를 받는 것을 선호합니다. 이를 통해 그런 빠른 피프스를 바로잡을 수 있습니다. 반면, 일부 트레이더는 닫힌 캔들로 확인을 기다리는 것 을 선호하며, 이 지표는 그들도 완벽하게 사용할 수 있습니다. 두 가지 접근 방식 모두 유효합니
The "Scalper M5 system" is a powerful tool designed for scalping strategies in the forex market. With an accuracy of up to 95%, this indicator provides reliable signals for opening trades without repainting. It employs a simple yet effective approach to identify short-term trading opportunities, making it suitable for traders of all levels.  The indicator's algorithm considers various factors such as price momentum, volatility, and market trends to filter out false signals and deliver high-prob
AW Candle Patterns MT4
AW Trading Software Limited
AW 양초 패턴 표시기는 강력한 양초 패턴 스캐너와 결합된 고급 추세 표시기의 조합입니다. 가장 신뢰할 수 있는 30개의 촛대 패턴을 인식하고 강조 표시하는 데 유용한 도구입니다. 또한 색상 막대를 기반으로 하는 현재 추세 분석기입니다.       크기를 조정하고 위치를 지정할 수 있는 플러그인 다중 시간 프레임 추세 패널. 트렌드 필터링에 따라 패턴 표시를 조정하는 고유한 기능. 장점: 캔들 패턴을 쉽게 식별 결과를 다시 그리지 않습니다 내장된 다중 시간 추세 패널 비활성화된 패턴 유형(1, 2, 3 촛불) 패턴 표시 시 트렌드 필터링 조정 MT5 version - >   HERE   / Instructions and description  -> HERE 표시된 패턴 목록: 망치 패턴 핀 업 / 핀 다운 약세 하라미 / 강세 하라미 Bearish Harami Cross / Bullish Harami Cross 피벗 포인트 반전 업 / 피벗 포인트 반전 다운 더 높은 종가와 함께 낮
Jacket
Andriy Sydoruk
Jacket is an arrow indicator for forex, futures and binary options without redrawing. Tracks the market trend, ignoring sharp market fluctuations and noise around the average price. Works only at open prices. Therefore, it is reliable and without redrawing. This indicator uses its algorithms to analyze previous periods and predict further market behavior. It is based on the calculation of levels with a certain period, which allows you to more accurately assess the situation. Often, signals that
The Supply and Demand Zones indicator is one of the best tools we have ever made. This great tool automatically draws supply and demand zones, the best places for opening and closing positions. It has many advanced features such as multi timeframe zones support, displaying the width of zones, alert notifications for retouched zones, and much more. Because of market fractality, this indicator can be used for any kind of trading. Whether you are a positional, swing, or intraday trader does not ma
Ferbey
Oleksii Ferbei
The intelligent algorithm of the Ferbey indicator shows potential reversal points of the market with a high probability. The Ferbey indicator is perfect for trend trading! If you trade with the trend, then a trading strategy based on this indicator will suit you perfectly. The indicator filters out market noise, practically all and all the necessary functions for working on a thread are built into one tool. Works on all currency pairs and on all timeframes, the indicator setting is at your req
이 제품의 구매자들이 또한 구매함
Dynamic Forex28 Navigator
Bernhard Schweigert
4.43 (7)
Dynamic Forex28 Navigator - 차세대 외환 거래 도구. 현재 49% 할인. Dynamic Forex28 Navigator는 오랫동안 인기 있는 지표의 진화형으로, 세 가지의 힘을 하나로 결합했습니다. 고급 통화 Strength28 지표(695개 리뷰) + 고급 통화 IMPULSE with ALERT(520개 리뷰) + CS28 콤보 신호(보너스). 지표에 대한 자세한 정보 https://www.mql5.com/en/blogs/post/758844 차세대 Strength 지표는 무엇을 제공합니까?  원래 지표에서 좋아했던 모든 것이 새로운 기능과 더 높은 정확도로 강화되었습니다. 주요 기능: 독점적인 통화 Strength 공식.  모든 시간대에 걸쳐 부드럽고 정확한 강도선. 추세와 정확한 진입을 식별하는 데 이상적입니다. 역동적인 시장 피보나치 수준(시장 피보나치).  이 지표에만 있는 고유한 기능. 가격 차트가 아닌 통화 강도에 피보나치가 적용됩니다.
Precautions for subscribing to indicator This indicator only supports the computer version of MT4 Does not support MT5, mobile phones, tablets The indicator only shows the day's entry arrow The previous history arrow will not be displayed (Live broadcast is for demonstration) The indicator is a trading aid Is not a EA automatic trading No copy trading function The indicator only indicates the entry position No exit (target profit)  The entry stop loss point is set at 30-50 PIPS Or the front hi
GOLD Impulse with Alert
Bernhard Schweigert
4.64 (11)
이 지표는 Advanced Currency IMPULSE with ALERT  +   Currency Strength Exotics  의 2가지 제품의 슈퍼 조합입니다. 그것은 모든 시간 프레임에 대해 작동하며 8개의 주요 통화와 하나의 기호에 대한 강약의 충동을 그래픽으로 보여줍니다! 이 표시기는 금, 이국적인 쌍, 상품, 지수 또는 선물과 같은 기호에 대한 통화 강도 가속을 표시하는 데 특화되어 있습니다. 금, 은, 오일, DAX, US30, MXN, TRY, CNH 등의 진정한 통화 강도 가속(충동 또는 속도)을 표시하기 위해 9번째 줄에 모든 기호를 추가할 수 있습니다. 새로운 기본 알고리즘을 기반으로 구축되어 잠재적인 거래를 훨씬 더 쉽게 식별하고 확인할 수 있습니다. 이는 통화의 강세 또는 약세가 가속되는지 여부를 그래픽으로 표시하고 가속 속도를 측정하기 때문입니다. 자동차의 속도계처럼 생각하면 됩니다. 가속화할 때 Forex 시장에서 동일한 일이 분명히 더 빠르
RFI levels PRO
Roman Podpora
5 (1)
이 지표는 추세 반전 지점과 가격 반등 영역을 정확하게 보여줍니다.       주요 투자자들   . 새로운 트렌드가 형성되는 곳을 파악하고 최대한 정확하게 의사결정을 내리며 모든 거래를 완벽하게 통제합니다. TREND LINES PRO   지표와 함께 사용할 때 최대의 잠재력을 발휘합니다.  VERSION MT5 지표가 보여주는 내용: 새로운 추세의 시작 시 활성화되는 반전 구조 및 반전 수준. 최소한의 위험 대비 수익률을 갖는 이익 실현   (TAKE PROFIT)   및   손절매(STOP LOSS)   레벨 표시       RR 1:2   . 지능형 손실 감소 로직이 적용된 손절매 기능. 지정된 지표에서 두 가지 추세 유형에 대한 반전 패턴을 표시합니다. 지표: 트렌드를 따라   트렌드 라인 프로   (글로벌 트렌드 변화) 트렌드 프로   (빠른 트렌드 변화) 간단하고 효과적입니다       스캐너       실시간 추세 (신규). 다중 시간 프레임 도구 필터링. 표시하다  
Buy Sell Arrow Swing MT4
Sahib Ul Ahsan
5 (1)
Looking for a powerful yet lightweight swing detector that accurately identifies market structure turning points? Want clear, reliable buy and sell signals that work across any timeframe and any instrument? Buy Sell Arrow MT Swing is built exactly for that — precision swing detection made simple and effective. This indicator identifies Higher Highs (HH) , Higher Lows (HL) , Lower Highs (LH) , and Lower Lows (LL) with remarkable clarity. It is designed to help traders easily visualize market stru
현재 40% 할인 ! 초보자 또는 전문가 트레이더를 위한 최고의 솔루션! 이 대시보드 소프트웨어는 28개의 통화 쌍에서 작동합니다. 2가지 주요 지표(Advanced Currency Strength 28 및 Advanced Currency Impulse)를 기반으로 합니다. 전체 Forex 시장에 대한 훌륭한 개요를 제공합니다. 고급 통화 강도 값, 통화 이동 속도 및 모든(9) 시간대의 28 Forex 쌍에 대한 신호를 보여줍니다. 추세 및/또는 스캘핑 기회를 정확히 파악하기 위해 차트의 단일 지표를 사용하여 전체 시장을 볼 수 있을 때 거래가 어떻게 개선될지 상상해 보십시오! 잠재적인 거래를 식별하고 확인하면서 강력한 통화와 약한 통화를 더욱 쉽게 식별할 수 있도록 이 지표에 기능을 내장했습니다. 이 표시기는 통화의 강세 또는 약세가 증가 또는 감소하는지 여부와 모든 시간대에서 수행되는 방식을 그래픽으로 보여줍니다. 추가된 새로운 기능은 현재 시장 조건 변화에 적응하는
Step into the world of Forex trading with confidence, clarity, and precision using   Gold Indicator   a next-generation tool engineered to take your trading performance to the next level. Whether you’re a seasoned professional or just beginning your journey in the currency markets, Gold Indicator equips you with powerful insights and help you trade smarter, not harder. Built on the proven synergy of three advanced indicators, Gold Indicator focuses exclusively on medium and long-term trends eli
Meravith
Ivan Stefanov
5 (3)
마켓 메이커를 위한 도구. Meravith는 다음과 같은 기능을 제공합니다: 모든 타임프레임을 분석하고 현재 유효한 추세를 표시합니다. 강세와 약세 거래량이 동일한 유동성 구간(거래량 균형 구간)을 강조 표시합니다. 서로 다른 타임프레임의 모든 유동성 레벨을 차트에 직접 표시합니다. 텍스트 기반 시장 분석을 생성하여 참고용으로 제공합니다. 현재 추세를 기반으로 목표가, 지지선 및 손절가를 계산합니다. 거래의 위험 대비 보상 비율(Risk/Reward)을 계산합니다. 계좌 잔고에 따라 포지션 크기를 산출하고 잠재 수익을 추정합니다. 시장에 중대한 변화가 발생할 경우 경고도 제공합니다. 지표의 주요 라인: 강세/약세 거래량 소진 라인 — 목표가로 사용됩니다. 시장 추세를 나타내는 라인. 시장이 강세인지 약세인지에 따라 색상이 변경되며 추세 지지선 역할을 합니다. 색상은 주로 시장 심리를 보여줍니다. 거래량 균형선(Eq). Eq(Volume Equilibrium) 라인은 시스템의 핵심입니
No Repaint Bext is a ready-made trading system. Shows when to open and when to close trades, as well as in which direction. Every time a green arrow appears, you need to open a buy trade. Close all buy trades when a red arrow appears. The same goes for the opposite direction, every time a red arrow appears, open sell trades and close them all when a green arrow appears. We use the M5 timeframe for trading. You can trade on any cozy pair. This indicator does not repaint and practically does not
Dynamic Scalper System
Vitalyi Belyh
5 (1)
" Dynamic Scalper System " 지표는 추세 파동 내에서 스캘핑 방식으로 거래하도록 설계되었습니다. 주요 통화쌍 및 금에서 테스트되었으며, 다른 거래 상품과의 호환성이 가능합니다. 추가적인 가격 변동 지원을 통해 추세에 따라 단기 포지션 진입 신호를 제공합니다. 지표의 원리 큰 화살표는 추세 방향을 결정합니다. 작은 화살표 형태의 스캘핑 신호를 생성하는 알고리즘은 추세 파동 내에서 작동합니다. 빨간색 화살표는 상승 방향을, 파란색 화살표는 하락 방향을 나타냅니다. 민감한 가격 변동선은 추세 방향으로 그려지며, 작은 화살표의 신호와 함께 작용합니다. 신호는 다음과 같이 작동합니다. 적절한 시점에 선이 나타나면 진입 신호가 형성되고, 선이 있는 동안 미결제 포지션을 유지하며, 완료되면 거래를 종료합니다. 권장되는 작업 시간대는 M1~H4입니다. 화살표는 현재 캔들에 형성되며, 다음 캔들이 이미 시작되었더라도 이전 캔들의 화살표는 다시 그려지지 않습니다. 입력 매개
Are you looking for a simple and reliable indicator that can help you spot market swing points easily? Do you want clear buy and sell signals that work on any timeframe and any trading instrument? Buy Sell Signal Pro is designed to do exactly that. It helps traders identify important market turning points and understand the current market structure in a clear and easy way. This indicator detects Higher Highs (HH), Higher Lows (HL), Lower Highs (LH), and Lower Lows (LL) so you can quickly see wh
Super Signal – Skyblade Edition 전문가용 노리페인트 / 노래그 트렌드 신호 시스템, 뛰어난 승률 제공 | MT4 / MT5용 1분, 5분, 15분과 같은 낮은 타임프레임에서 가장 좋은 성능을 보입니다. 핵심 기능: Super Signal – Skyblade Edition은 추세 매매를 위해 설계된 스마트 신호 시스템입니다. 이 시스템은 다중 필터 로직을 활용하여, 명확한 방향성과 실질적인 모멘텀이 수반된 고품질 추세만을 감지합니다. 이 시스템은 고점 또는 저점을 예측하지 않으며 , 다음 세 가지 조건이 모두 충족될 때만 신호를 발생시킵니다: 명확한 추세 방향 강화되는 모멘텀 건전한 변동성 구조 또한, 시장 세션 기반의 유동성 분석을 통해 신호의 신뢰성과 타이밍을 더욱 향상시킵니다. 신호 특성: 모든 화살표 신호는 100% 리페인트 없음 / 지연 없음 신호가 한 번 발생하면 고정되며, 깜빡이거나 사라지지 않음 차트 상의 시각적 화살표, 정보 패널, 팝업 알
GM Arrows Pro
Guillaume Pierre Philippe Mesplont
Product Name: GM Arrows Pro – Signals & Alerts Short Description: GM Arrows Pro is a clean, reliable MT4 indicator showing BUY/SELL arrows on the chart with unique alerts at the moment the signal appears. Full Description: GM Arrows Pro is a professional MT4 indicator designed for traders who want clear, actionable signals: BUY and SELL arrows visible on the entire chart history Unique alerts when a new signal appears (no repeated alerts) Option to disable repetitive signals ( disable_repeatin
VPPD - Volume Profile POC Delta *Professional Volume Analysis Tool for MetaTrader 4* ---   INDICATOR FEATURES   Unique Capabilities: **Advanced Volume Profile** - Horizontal volume histograms across selected periods - Precise Point of Control (POC) identification — the level of maximum volume **Delta Analysis (Exclusive Feature!)** - Volume delta calculation — buy/sell ratio - Tick movement simulation inside bars - POC color coding:   - Green — Bullish delta (buyers dominate)   -
Miraculous Indicator – Gann Square of Nine 기반 100% 비리페인트 Forex 및 바이너리 도구 이 영상은 Miraculous Indicator 를 소개합니다. 이 지표는 Forex 및 바이너리 옵션 트레이더를 위해 특별히 개발된 매우 정확하고 강력한 트레이딩 도구입니다. 이 지표가 독특한 이유는 전설적인 **Gann Square of Nine(Gann 9의 사각형)**과 **Gann's Law of Vibration(Gann 진동의 법칙)**에 기반을 두고 있기 때문입니다. 이는 현대 트레이딩에서 가장 정밀한 예측 도구 중 하나로 손꼽힙니다. Miraculous Indicator는 완전히 비리페인트(non-repaint) 됩니다. 즉, 캔들이 마감된 후에도 신호가 변경되거나 사라지지 않습니다. 보이는 것이 곧 결과입니다. 이는 트레이더가 자신감을 가지고 거래에 진입하고 청산할 수 있는 신뢰할 수 있고 일관된 기반을 제공합니다. 주요 특징: Gann
PairMaster Buy Sell Arrow Indicator for MT4 Trade Reversals Like a Pro — Catch Every Swing Point with Precision The PairMaster Buy Sell Arrow Indicator is a powerful MetaTrader 4 tool built to identify high-probability swing trading opportunities . Designed for traders who value accuracy, clarity, and simplicity, PairMaster detects key market turning points and plots intuitive buy and sell arrows directly on your chart. Key Features Accurate Swing Point Detection – Automatically identifies ma
Cyclic Impulse
Vitalyi Belyh
차트를 구조화하고 주기적인 가격 변동을 식별하는 기술 지표입니다. 모든 차트에서 작업할 수 있습니다. 다양한 유형의 알림. 그래프 자체에도 추가 화살표가 있습니다. 역사를 재구성하지 않고, 촛불을 닫는 작업에 임한다. M5 이상에서 권장되는 TF입니다. 사용 및 구성이 쉬운 매개변수입니다. 매개변수가 다른 2개의 지표를 사용하는 경우, 다른 지표 없이 해당 지표만 사용할 수 있습니다. 2개의 입력 매개변수가 있습니다 주기성과 신호 지속 시간 이 2개의 매개변수는 차트 구조의 처리와 관련이 있습니다. Cyclicity - 역전 주기가 얼마나 자주 바뀌는지 조절하고 주기를 매끄럽게 합니다. Signal duration - 최소 숫자에서는 가격 움직임의 충격을 감지하고, 최대 숫자에서는 장기적 추세 움직임을 감지합니다.. --------------------------------
Quantum Regime Indicator
Gideon Asiamah Yeboah
Product Name:   Quantum Regime Indicator Short Description:   A multi-engine structural regime and volatility filter. Description: Quantum Regime Indicator (QRI) is a sophisticated technical analysis algorithm designed to identify market structure shifts and volatility regimes. Unlike standard indicators that rely on immediate price action, QRI utilizes a hierarchical logic architecture to filter market noise and identify statistical extremes. The indicator is built on the philosophy of "Market
"Dragon's Tail" is an integrated trading system, not just an indicator. This system analyzes each candle on a minute-by-minute basis, which is particularly effective in high market volatility conditions. The "Dragon's Tail" system identifies key market moments referred to as "bull and bear battles". Based on these "battles", the system gives trade direction recommendations. In the case of an arrow appearing on the chart, this signals the possibility of opening two trades in the indicated directi
Rtc ML Ai Predictor MT4
Muhammad Faisal Sagala
Rtc ML Ai | Predictor CORE MACHINE LEARNING ENGINE Adaptive ML Market Predictor – Multi-Bar Trend & Candle Forecast What This Indicator Does This indicator is a  real-time market prediction engine  designed to analyze price behavior and estimate  future market tendencies . Unlike conventional indicators, this system  does not rely on static parameters or historical curve-fitting , but adapts its internal state dynamically during live market operation. Instead of using static rules, the indic
IQ Gold Gann Levels
INTRAQUOTES
5 (4)
Presenting one-of-a-kind Gann Indicator for XAUUSD IQ Gold Gann Levels is a non-repainting, precision tool designed exclusively for XAUUSD/Gold intraday trading. It uses W.D. Gann’s square root method to plot real-time support and resistance levels, helping traders spot high-probability entries with confidence and clarity. William Delbert Gann (W.D. Gann) was an exceptional market analyst whose trading technique was based on a complex blend of mathematics, geometry, astrology, and ancient calcul
The Super Arrow Indicator provides non-repainting buy and sell signals with exceptional accuracy. Key Features No repainting – confirmed signals remain fixed Clear visual arrows: green for buy, red for sell Real-time alerts via pop-up, sound, and optional email Clean chart view with no unnecessary clutter Works on all markets: Forex, gold, oil, indices, crypto Adjustable Parameters TimeFrame Default: "current time frame" Function: Sets the time frame for indicator calculation Options: Can be set
KT Trend Trading Suite MT4
KEENBASE SOFTWARE SOLUTIONS
KT Trend Trading Suite는 트렌드 추종 전략과 여러 돌파 지점을 결합한 다기능 지표입니다. 이러한 돌파 지점은 진입 신호로 사용됩니다. 새로운 추세가 형성되면 이 지표는 여러 번의 진입 기회를 제공하여 트렌드를 성공적으로 따라갈 수 있도록 돕습니다. 덜 중요한 진입 신호를 피하기 위해 되돌림 기준값이 사용됩니다. MT5 버전은 여기에서 확인할 수 있습니다  https://www.mql5.com/en/market/product/46270 기능 여러 가지 시장 흐름을 하나의 수식으로 결합하여 현재 추세를 명확하게 시각화합니다. 진입 신호가 발생한 구간에 직사각형 박스를 표시하여 지역 고점과 저점을 명확히 나타냅니다. 신호의 정확도를 측정하고 간단한 성능 지표를 제공합니다. 다중 시간대 대시보드를 포함하여 모든 시간 프레임을 스캔하고 각 시간대의 추세 방향을 표시합니다. 입력 파라미터 History Bars:   과거 신호 분석에 사용할 히스토리 바 개수입니다.
IQ FX Gann Levels
INTRAQUOTES
5 (2)
IQ FX Gann Levels a precision trading indicator based on W.D. Gann’s square root methods . It plots real-time, non-repainting support and resistance levels to help traders confidently spot intraday and scalping opportunities with high accuracy. William Delbert Gann (W.D. Gann) was an exceptional market analyst, whose trading technique was based on a complex blend of mathematics, geometry, astrology, and ancient mathematics which proved to be extremely accurate. Setup & Guide:  Download  MT5 Ver
Supply and Demand Dashboard PRO
Bernhard Schweigert
4.8 (20)
현재 40% 할인! 이 대시보드는 여러 기호와 최대 9개의 타임프레임에서 작동하는 매우 강력한 소프트웨어입니다. 주요 지표(최상의 리뷰: 고급 공급 수요)를 기반으로 합니다.   Advanced Supply Demand 대시보드는 훌륭한 개요를 제공합니다. 다음과 같이 표시됩니다.  영역 강도 등급을 포함하여 필터링된 공급 및 수요 값, 영역에 대한/및 영역 내 Pips 거리, 중첩된 영역을 강조 표시하고 모든 (9) 시간 프레임에서 선택한 기호에 대해 4가지 종류의 경고를 제공합니다. 그것은 당신의 개인적인 필요에 맞게 고도로 구성 가능합니다! 당신의 혜택! 모든 트레이더에게 가장 중요한 질문: 시장에 진입하기에 가장 좋은 수준은 무엇입니까? 최고의 성공 기회와 위험/보상을 얻으려면 강력한 공급/수요 영역 내 또는 그 근처에서 거래를 시작하십시오. 손절매를 위한 최적의 장소는 어디입니까? 가장 안전하려면 강력한 수요/공급 구역 아래/위에 정류장을 두십시오.
Introducing a powerful, precision-engineered indicator that seamlessly combines Pivot Points, Moving Averages, and Multi-Timeframe Analysis to deliver high-probability Buy and Sell signals in real-time. This tool is your strategic edge, designed to identify trend reversals, market momentum, and optimal trade entries, no matter your preferred trading style. Our algorithm goes beyond standard indicators—by analyzing multiple timeframes simultaneously, it spots true market turning points while fi
Weis Wave with Alert
Trade The Volume Waves Single Member P.C.
4.82 (22)
Rental/Lifetime Package Options and Privileges' Rent Monthly Six Months   Yearly/Lifetime Weis Wave with Speed with Alert+Speed Index x x x Manual  x x x Quick Set up Video x x x Blog x x x Lifetime Updates x x x Setup and Training Material x x Rectangle Break Alert Tool      x Discord Access Channel "The SI traders" x   How to trade info visit:    http://www.tradethevolumewaves.com   ** If you purchase please contact me to setup your  : training Room and  complete manual access.  This is
Beast Super Signal
Dustin Vlok
4.73 (89)
수익성 있는 거래 기회를 쉽게 식별하는 데 도움이 되는 강력한 외환 거래 지표를 찾고 계십니까? Beast Super Signal보다 더 이상 보지 마십시오. 사용하기 쉬운 이 추세 기반 지표는 시장 상황을 지속적으로 모니터링하여 새로운 개발 추세를 찾거나 기존 추세에 뛰어들 수 있습니다. Beast Super Signal은 모든 내부 전략이 정렬되고 서로 100% 합류할 때 매수 또는 매도 신호를 제공하므로 추가 확인이 필요하지 않습니다. 신호 화살표 알림을 받으면 구매 또는 판매하기만 하면 됩니다. 구매 후 비공개 VIP 그룹에 추가되도록 저에게 메시지를 보내주세요! (전체 제품 구매만 해당). 최신 최적화된 세트 파일을 구입한 후 저에게 메시지를 보내주세요. MT5 버전은   여기에서 사용할 수 있습니다. 여기에서   Beast Super Signal EA를 받으세요. 최신 결과를 보려면 댓글 섹션을 확인하세요! Beast Super Signal은 1:1, 1:2
Introduction to Fractal Pattern Scanner Fractal Indicator refers to the technical indicator that makes use of the fractal geometry found in the financial market. Fractal Pattern Scanner is the advanced Fractal Indicator that brings the latest trading technology after the extensive research and development work in the fractal geometry in the financial market. The most important feature in Fractal Pattern Scanner is the ability to measure the turning point probability as well as the trend probabi
Allows multiple indicators to be combined into a single indicator, both visually and in terms of an alert. Indicators can include standard indicators, e.g. RSI, CCI, etc., and also Custom Indicators, even those purchased through Market, or where just have the ex4 file. An early alert is provided, say when 4 out 5 indicators have lined up, and a confirmed alert when all are in agreement. A‌lso features a statistics panel reporting the success of the combined indicator by examining the current cha
제작자의 제품 더 보기
Prime Strike Signal
Camila Bernardez Camero
Prime Strike Signal – 명확한 진입, 리페인트 없음. Prime Strike Signal No Repaint Never는 시장이 급변할 때에도 명확하고 일관된 시그널을 원하는 트레이더를 위해 설계된 간단하고 규칙 기반의 도구입니다. 방향 전환을 즉시 차트에 화살표로 표시해주며, 복잡한 분석 없이도 단기 가격 흐름에 쉽게 따라갈 수 있도록 도와줍니다. 최신 정보 받기 업데이트 및 신규 출시 소식을 빠르게 받으려면 공식 채널에 가입하세요: https://www.mql5.com/en/channels/signalsandindicators 로직 이 시스템은 서로 다른 평활 기간을 가진 두 가지 가격 기반 계산을 비교하여 모멘텀 변화를 감지합니다. 계산된 차이는 두 번째 로직 계층에서 필터링되어, 유효한 크로스가 발생할 경우에만 시그널을 생성합니다. 이는 불필요한 노이즈가 아닌 실제 움직임에 기반한 진입을 보장합니다. 리페인트 하나요? 아니요. 이 도구는 캔들이
Quantum Impulse
Camila Bernardez Camero
Quant Impulse Signal – 리페인트 없음, 백페인팅 없음 Quant Impulse Signal은 최고가와 최저가 지수 이동평균을 비교하여 시장 전환점을 포착하는 고정밀 도구입니다. 실시간 가격 움직임에 반응하여 확인된 방향성 움직임에 기반한 명확한 진입 신호를 제공합니다. 로직 이 지표는 모든 타임프레임에서 각 캔들의 최고가와 최저가에 대해 8기간 EMA를 계산한 뒤, 현재 가격을 해당 EMA와 비교합니다. 시가와 종가가 고가 EMA 위에 있고 가격이 이전 캔들의 최고가를 넘으면 매수 신호가 생성됩니다. 반대로 시가와 종가가 저가 EMA 아래에 있고 가격이 이전 캔들의 최저가를 깨면 매도 신호가 발생합니다. 이중 필터 방식으로 시장의 진정한 강약을 반영합니다. 신호 생성 화살표는 캔들 극값에서 0.2 × ATR 거리만큼 떨어진 위치에 표시되며, ATR은 최근 10개 캔들의 평균 실제 변동폭으로 계산됩니다. 이 동적 배치는 변동성에 관계없이 시각적 일관성을 유지합니다.
Pip Storm Signal
Camila Bernardez Camero
PIP STORM 신호 PIP STORM 은 변동성이 큰 시장 상황에서 초고빈도 실행을 위해 설계된 화살표 기반의 고급 시스템입니다. 이 시스템의 핵심 목표는 지연되거나 과도하게 사용된 인디케이터에 의존하지 않고, 실행 가능한 스캘핑 신호를 지속적으로 제공하는 것입니다. 예측하지 않고, 가격 전환 구간에 정밀하게 반응하며, 최소한의 실시간 확인 로직을 통해 마이크로 브레이크아웃과 유동성 불균형을 포착합니다. 업데이트 받기 향후 릴리스 및 공지사항을 확인하려면 공식 채널에 가입하세요: https://www.mql5.com/en/channels/signalsandindicators 스캘핑 빈도 이 도구는 조용히 사용하기 위한 것이 아닙니다. PIP STORM 은 활성 시장에서 거의 모든 캔들에 대해 공격적이고 지속적으로 신호를 생성하며, 현재의 방향을 확인하거나 중요한 되돌림을 정밀하게 감지합니다. 신호 해석 시각적으로는 단순하지만, 작동 면에서는 매우 강력합니다: 빨
Pulse Mark Pro
Camila Bernardez Camero
Pulse Mark Pro – 트렌드 전환 감지의 정밀함 PulseMark Pro 는 시장 방향의 초기 변화를 감지하기 위해 설계된 인디케이터입니다. 일반적인 인디케이터가 마지막 캔들의 결과에만 의존하는 것과 달리, PulseMark Pro는 새로운 추세의 가능성 있는 시작점 을 포착하기 위한 독자적인 로직을 사용합니다. 단기적으로 직관에 반하는 것처럼 보여도, 컬러 신호점과 동적 점선 추세선을 통해 모멘텀 변화를 시각적으로 표현합니다. 트렌드 전환 감지 로직 이 도구의 핵심은 차트에 컬러 점 으로 표시되는 추세 전환 지점입니다. 이 점은 알고리즘이 상승 또는 하락 모멘텀 전환 가능성을 높은 확률로 감지한 시점을 나타냅니다. PulseMark Pro의 특징은 이 지점이 최근 캔들의 색상이나 방향에 기반하지 않는다는 것 입니다. 대신, 변동성, 과거 가격 움직임, 통계적 편차 등을 고려한 사용자 정의 계산식을 통해 결정됩니다. 이로 인해 신호점은 명확한 추세가 시작되기 전이나 후 에
Trend Flip Pro
Camila Bernardez Camero
Trend Flip Pro Trend Flip Pro는 전통적인 시각적 오버레이에 의존하지 않고, 내부 모멘텀 이동을 기반으로 시장의 방향성 전환을 포착하는 구조 기반의 신호 시스템입니다. 각 화살표는 매수자와 매도자 간의 통제권이 명확하게 전환되었음을 나타내며, 이는 단순한 가격 움직임이 아닌 근본적인 방향 강도에 기반합니다. 리페인트 없음 — 고정된 신호 이 도구는 리페인트되지 않습니다. 신호는 엄격한 조건이 충족될 때만 나타나며, 한 번 생성되면 변경되지 않고 고정됩니다. 일반적으로 신호를 지연시키거나 수정하는 지표들과 달리, Trend Flip Pro는 시장 불균형이 발생하는 즉시 정확하게 반응합니다. 멀티 자산 및 다양한 타임프레임 지원 Trend Flip Pro는 모든 주요 통화쌍 및 타임프레임과 호환되며, 빠른 M1 스캘핑부터 H4 구조 기반 트레이딩까지 다양하게 활용할 수 있습니다. 특히 XAUUSD에서는 높은 변동성 덕분에 선명한 모멘텀 전환을 포착할 수 있
Zone Crack Alpha
Camila Bernardez Camero
ZONE CRACK ALPHA — 시장 단계 전환의 전략적 탐지 Zone Crack Alpha는 이중 구조의 논리 시스템을 통해 가격 행동에서 발생하는 구조적 전환을 감지하도록 설계되었습니다. 기존의 지표나 지연된 신호에 의존하지 않고, 히스토그램의 극성 변화와 방향성 시각 신호를 활용하여 돌파 가능성이 높은 지점을 포착합니다. 신호 논리 이 시스템은 히스토그램이 0축을 교차하는 순간을 핵심 트리거로 사용합니다. 방향 전환이 확인되면 — 예를 들어 매수 압력이 약해지고 매도 전환이 감지되었을 때 — 차트 상에 화살표 형태의 시각적 표시가 생성됩니다. 모든 신호는 캔들 마감 시점에 확정되며, 리페인트나 예측식 표시 없이 신뢰성을 유지합니다. 신호 생성 과정 각 진입 신호는 최근 시장의 움직임을 평활화하여 분석한 결과로, 신뢰도 높은 모멘텀 변화를 포착합니다. 시스템은 단기적인 시장 노이즈를 제거하고 외부 신호나 일시적 변동이 아닌 실제 구조적 변화를 기반으로 반응합니다.
Auric Pulse System
Camila Bernardez Camero
Auric Pulse System 전략적 시장 반전을 포착하도록 정밀하게 설계된 시스템 Auric Pulse System은 고변동성 시장에서 구조적인 명확성을 추구하는 트레이더를 위해 개발된 고해상도 신호 시스템입니다. 특히 XAUUSD(금)의 복잡한 시장 환경을 위해 최적화되어 있습니다. 기존의 시각적 오버레이나 지연형 오실레이터에 의존하는 도구들과 달리, 이 시스템은 시장 내부의 흐름 메커니즘과 비대칭 가격 이동을 기반으로 방향성 트리거를 포착합니다. 최신 정보 받아보기 향후 업데이트 및 출시 소식을 가장 먼저 받아보려면 공식 채널을 구독하세요: https://www.mql5.com/en/channels/signalsandindicators 모멘텀 전환 및 레인지 돌파에 최적화 이 시스템은 레인지 확장의 속도 및 일관성, 갑작스러운 유동성 이탈, 평균 변동성에서의 이탈을 분석하여 핵심 전환 지점을 감지합니다. 각 신호는 시간적 이상 현상과 방향성 압력이 동시에 충족
Nexus Pulse Detector
Camila Bernardez Camero
Nexus Pulse Detector — 가격 구조 기반의 고급 신호 시스템 작동 방식 Nexus Pulse Detector는 단순히 재포장된 트렌드 도구도 아니며, 정밀도를 가장한 리페인트 인디케이터도 아닙니다. 이 시스템은 가격의 압축 및 확장 단계에서 발생하는 방향성 불균형을 감지하는 구조 중심의 신호 엔진입니다. 각 신호는 시장 참여자 간의 주도권 변화의 결과이며, 다층적인 돌파 검증 과정을 거쳐 생성됩니다. 노이즈가 아닌 가격 구조에 집중 일반적인 고점이나 저점에 반응하는 대신, 최근 구조적 극단값과 단기 이동 평균 간의 동적 관계에서 압력 지점을 식별합니다. 그런 수준이 흡수되었는지, 거부되었는지, 혹은 충분한 힘으로 돌파되었는지를 판단한 후에만 신호를 발생시킵니다. 시장 조건이 충족될 때만 신호 발생 모든 변동에 반응하지는 않습니다. Nexus Pulse Detector는 이전 구조에서의 이탈, 내부 트렌드의 전환, 그리고 최근 시장 대칭에서의 명확한 이격이
Xau Pulse Edge
Camila Bernardez Camero
XAU PulseEdge — 금 거래를 위한 정밀 진입 시스템 금 전용으로 설계됨 XAU PulseEdge는 단순히 추세를 따라가거나 지연된 패턴에 반응하는 도구가 아닙니다. 이 시스템은 XAUUSD에서 고정밀 진입 지점을 포착하기 위해 단기 및 장기 시장 리듬 간의 모멘텀 차이를 평가하도록 설계되었습니다. 일반적인 임계값에 의존하지 않고, 빠른 주기와 느린 주기 사이의 내부 충돌을 구조적으로 분석합니다. 정적인 트리거가 아닌 동적인 조건 각 진입 신호는 여러 구조적 요소가 실시간으로 정렬될 때 생성됩니다. 이는 모멘텀 평균 간의 교차, 가중 이동 평균을 통한 신호 확인, 그리고 맞춤형 EMA 필터로 포착된 RSI 내부 불균형의 조합으로 발생합니다. 이는 단순한 조건이 아니라, 다층 분석을 기반으로 계산된 전환 지점입니다. No Repaint 이 인디케이터는 고정된 재도색되지 않는 화살표를 표시합니다. 이는 단순한 시각 효과가 아니라, 빠른/느린 모멘텀 스프레드와 RSI
Breakout Box Sentinel
Camila Bernardez Camero
Breakout Box Sentinel Signal 시스템 논리 Breakout Box Sentinel Signal  는 단순한 그래픽 오버레이가 아닙니다. 이는 가격 압축으로 형성된 돌파 구역을 통해 방향성 있는 움직임을 감지하는 구조 기반 도구입니다. 전통적인 지표처럼 데이터를 부드럽게 하거나 시각적 노이즈를 생성하지 않고, 시장의 변동성에 의해 유발되는 행동을 세션 기반의 깔끔한 프레임 안에서 분석합니다. 세션 적응 시장 행동은 유동성에 따라 달라집니다. 이 도구는 아시아, 런던, 뉴욕과 같은 글로벌 거래 세션에 자동으로 적응하여, 각 세션의 전형적인 움직임에 기반한 구역을 표시합니다. 신호는 항상 시간적 맥락 속에서 제공됩니다. 실전 트레이더를 위한 설계 프라이스 액션, 캔들 구조, 또는 명확한 차트 패턴을 기반으로 거래하는 트레이더라면, 이 시스템은 자연스럽게 기존 전략에 녹아들 것입니다. 불필요한 노이즈 없이 분석을 보완하며, 주관적 판단을 대체하지 않습니다
Impulse Reactor Signal
Camila Bernardez Camero
IMPULSE REACTOR – 더 스마트하게 스캘핑하고, 더 빠르게 반응하세요. Impulse Reactor 는 사용자 정의 가중 가격 엔진을 통해 시장 구조를 실시간으로 모니터링하는 실행 프레임워크를 기반으로 구축되었습니다. 기존의 오실레이터나 이동 평균 교차를 따르지 않으며, 대신 캔들 내부의 가속 및 감속 구간에서 파생된 방향성 모멘텀을 추적합니다. 이 시스템은 각 캔들을 개별적으로 평가하며, 단기적인 가격 변위와 변동 강도에 따라 시장 바이어스를 재조정합니다. 최신 정보 받아보기 공식 채널에 가입하여 향후 출시 및 업데이트 소식을 받아보세요: https://www.mql5.com/en/channels/signalsandindicators 신호 메커니즘 모든 캔들은 잠재적인 진입 지점으로 해석됩니다. 인디케이터는 각 틱마다 방향성 강도를 재계산하며, 가격 흐름의 리듬에 맞춰 조정되는 전방 가중 편차 모델을 사용합니다. 신호는 반응형이 아니라 예측형입니다. 화면에 표
Shock Wave
Camila Bernardez Camero
Shock Wave Signal – 리페인트 없음, 지연 없음, 백페인팅 없음 Shock Wave Signal은 극단적인 CCI 값을 활용하여 모든 타임프레임에서 강력한 모멘텀 반전을 정확히 포착합니다. 가격이 사전 정의된 과매수 또는 과매도 수준에 도달하면 캔들 종가에서 명확한 진입 신호를 생성합니다. 로직 이 인디케이터는 최대 600개의 과거 캔들에 대해 5기간 CCI를 계산합니다. CCI가 +165를 초과하면 매수 신호가, –165 미만이면 매도 신호가 발생하여 가장 강력한 모멘텀만 필터링합니다. 신호 위치 매수 마커는 신호를 발생시킨 캔들의 고가에, 매도 마커는 저가에 표시됩니다. 각 화살표는 캔들 종가 시 한 번만 그려지며 고정되어 리페인트나 백페인팅이 없습니다. 타임프레임 Shock Wave Signal은 M1부터 MN1까지 모든 타임프레임에서 작동하지만, CCI 극값이 트렌드 전환과 일치하기 쉬운 H1 및 H4에서 최상의 성능을 발휘합니다. 더 짧은 타임프레임에서도 모멘
Signal Flash
Camila Bernardez Camero
Signal Flash – 리페인트 없음, 지연 없음, 백페인팅 없음 Signal Flash는 닫힌 바에서 스토캐스틱 크로스를 감지하여 정확한 진입 시점을 지정합니다. 차트 마커, 소리 및 이메일 알림으로 즉시 알림을 제공하며, 모든 심볼과 타임프레임에서 과거 신호를 변경하지 않고 지원합니다. 로직 이 인디케이터는 설정한 기간( KPeriod , DPeriod , Slowing )과 이동평균 방식을 사용해 전형 가격 또는 종가를 기반으로 %K와 %D 라인을 계산합니다. %K가 %D를 상향 크로스하면 매수 화살표가, 하향 크로스하면 매도 화살표가 표시됩니다. 과매수나 과매도 레벨에서만 크로스를 표시하도록 설정할 수 있습니다. 신호 표시 화살표는 신호를 트리거한 바의 고점 또는 저점에 한 번만 그려지며 그대로 고정됩니다. 색상, 크기, 문자 코드는 완전히 사용자 정의 가능하여 유효한 크로스를 절대 놓치지 않습니다. 설정 모든 입력 파라미터는 패널에서 확인할 수 있습니다: 소리/이메일 알
Wolf Pack Fury EA
Camila Bernardez Camero
Wolf Pack Fury EA 소개 Wolf Pack Fury EA는 안정성과 책임 있는 자금 관리를 중시하는 트레이더를 위해 설계되었습니다. 단기간에 기적을 약속하지 않으며, 계좌 잔고를 완벽하게 통제하면서 안정적인 월간 수익을 제공하는 것을 목표로 합니다. 이 EA는 주 5일, 하루 24시간 작동하며, 변동성 기반 알고리즘을 사용해 다양한 시장 상황에 적응합니다. 가격 10개 단위가 판매될 때마다 가격이 100달러 인상됩니다 구매 가격: 1,899달러 주요 기능 EURUSD 쌍의 H1 차트에 최적화되어 과도한 거래 없이 정밀한 진입을 가능하게 합니다 200달러에서 5,000달러까지의 소액 계좌용으로 설계되었으며, 높은 잔고로도 문제없이 확장 가능합니다 강력한 리스크 관리로 거래 사이클당 총 노출을 제한해 낮은 손실(드로우다운)과 계좌 안정성을 유지합니다 스마트 진입 간격: 고변동성 캔들(예: 뉴스 이벤트) 동안 신규 주문을 일시 중지하여 거래 로직과 자금을 보호합니다 권
Trend Pulse Apex
Camila Bernardez Camero
Trend Pulse Apex — 패턴 인식 + 트렌드 필터 + 모멘텀 필터 (리페인트 없음) Trend Pulse Apex는 높은 확률의 캔들 패턴을 감지하여 실시간 트렌드 및 모멘텀 분석으로 확인합니다. 닫힌 봉에만 고정된 화살표와 명확한 레이블을 표시하여 리페인트나 지연 없이 정확한 신호를 제공합니다. 주요 기능 • 패턴 인식: 엄격한 시가/고가/저가/종가 조건을 평가하여 Shooting Stars, Engulfings, Stars, Dojis, Hammers, Piercing Lines, Dark Cloud Covers 등 10가지 이상의 고급 일본식 캔들 패턴을 식별합니다. • 트렌드 필터: 내장된 ADX 모듈이 타임프레임에 따라 자동 조정되어 강세 추세와 횡보장을 구분하며, 차트에 “Weak” 또는 “Strong” 상태를 표시합니다. • 모멘텀 오버레이: 설정 가능한 RSI 수치가 트렌드 레이블 옆에 표시되어 과매수/과매도 구역을 강조하고 진입 타이밍을 최적화합니다.
Flash Candle MT5
Camila Bernardez Camero
Flash Candle – 실시간 캔들 색상 지정 및 알림 시스템 (리페인트 없음) Flash Candle은 최근에 마감된 캔들(bar 1)의 Williams Percent Range를 평가하여 해당 캔들에 확정된 색상을 할당합니다. 현재 형성 중인 캔들(bar 0)은 마감 시점까지 임시 색상을 표시하여, 신호가 완전한 데이터에만 기반하도록 보장합니다. 리페인트 없음 Flash Candle은 모든 형태의 리페인트, 백페인팅 또는 시각적 변경을 완전히 차단하도록 설계되었습니다. 신호는 bar 1에서만 확정되며, 형성 중인 캔들(bar 0)은 참조용 임시 버퍼만 사용하고 신호 생성에는 영향을 주지 않습니다. bar 1이 마감되면 최종 색상이 ExtColorsBuffer[1] 에 기록되어 이후 모든 OnCalculate 호출에서 변경되지 않습니다. 업데이트 루프( for (int bar = limit; bar >= 0; bar--) )는 모든 과거 버퍼 데이터를 보존하며, iBarShif
Quantum Channel Indicator
Camila Bernardez Camero
1 (1)
Quantum Channel 지표 논리 Quantum Channel은 고정된 되돌림 기간 동안의 가장 높은 고점과 가장 낮은 저점을 기준으로 상한선과 하한선을 계산합니다. 이 수준 사이의 영역을 음영 채널로 채우며, 오직 봉이 마감될 때만 업데이트됩니다. 이 접근 방식은 거래자에게 지연 왜곡 없이 가격의 극단값을 명확하게 보여줍니다. 신호 가격이 채널의 하한 또는 상한에 도달하면 각각 매수 또는 매도 화살표 신호가 나타납니다. 하단의 녹색 화살표는 잠재적 롱 진입을 표시하고, 상단의 빨간 화살표는 잠재적 숏 진입을 표시합니다. 이 신호는 미완 봉이 아닌 오직 마감된 봉 데이터만을 기반으로 하여 잘못된 트리거를 방지합니다. 리페인트 되나요? Quantum Channel은 마감된 봉에서 리페인트되지 않습니다. 일단 봉이 마감되면 해당 봉의 채널 값은 고정됩니다. 지표는 현재 봉에 어떤 수준도 그리지 않으므로 백페인팅이 발생하지 않습니다. 신호는 다음 마감된 봉에서만 나타나므
Clarity Pulse Detector
Camila Bernardez Camero
Clarity Pulse Detector Clarity Pulse Detector 닫힌 봉과 해당 거래량 막대를 분석하여 향후 데이터에 의존하지 않고 실제 추세 전환을 식별합니다. 이 지표는 구성 가능한 SSP(신호 강도 매개변수) 설정을 기반으로 펄스 강도를 계산하고 최근 최고점과 최저점을 비교하여 돌파 지점을 감지합니다. 필요한 조건이 닫힌 봉에서 충족되면 도구는 해당 봉 위에 명확한 매수 또는 매도 표시를 그립니다. 모든 계산은 확인된 봉에서 수행되므로 과거 신호에 잘못된 조정이 발생하지 않습니다. Signal 유효한 전환이 감지되면 지표는 매수 신호를 나타내기 위해 강세 봉 아래에 녹색 원을 표시하거나 매도 신호를 나타내기 위해 약세 봉 위에 빨간색 원을 표시합니다. 이 표시들은 봉이 마감될 때 정확히 나타나므로 다음 오픈 시 즉시 진입할 수 있습니다. 모든 화살표와 원은 닫힌 봉에 표시되므로 신호가 표시되면 이동하거나 사라지지 않습니다. HOW TO USE IT
Pip Blaze Signal
Camila Bernardez Camero
Pip Blaze Signal Pip Blaze Signal은 리페인팅(repainting)이나 백페인팅(backpainting) 없이 명확한 매수/매도 알림을 제공하도록 설계된 가격 행동 기반 지표입니다. 닫힌 봉의 최근 고가와 저가를 미리 정의된 임계값과 비교하여 지속적으로 스캔합니다. 캔들 클로즈 시 계산된 수준을 가격이 돌파하면 해당 지표는 점을 표시하여, 봉이 닫히면 과거 시그널이 고정되게 합니다. 이를 통해 트레이더는 실시간 및 백테스트 중에도 명확한 진입 신호를 받을 수 있습니다. 로직 핵심 로직은 구성 가능한 조회 기간(Lookback Period) 동안의 최고가와 최저가를 사용하여 동적 범위를 계산합니다. 리스크 파라미터는 이 범위를 조정하여 상단 및 하단 임계값을 생성합니다. 이전 봉의 종가가 상단 임계값 아래에 있고 현재 봉의 종가가 이를 초과하면 파란 점이 표시됩니다. 반대로 이전 봉의 종가가 하단 임계값 위에 있고 현재 봉의 종가가 이를 하회하면 마젠타
필터:
리뷰 없음
리뷰 답변